


What is predictive churn modeling in 2027 and which tools lead?
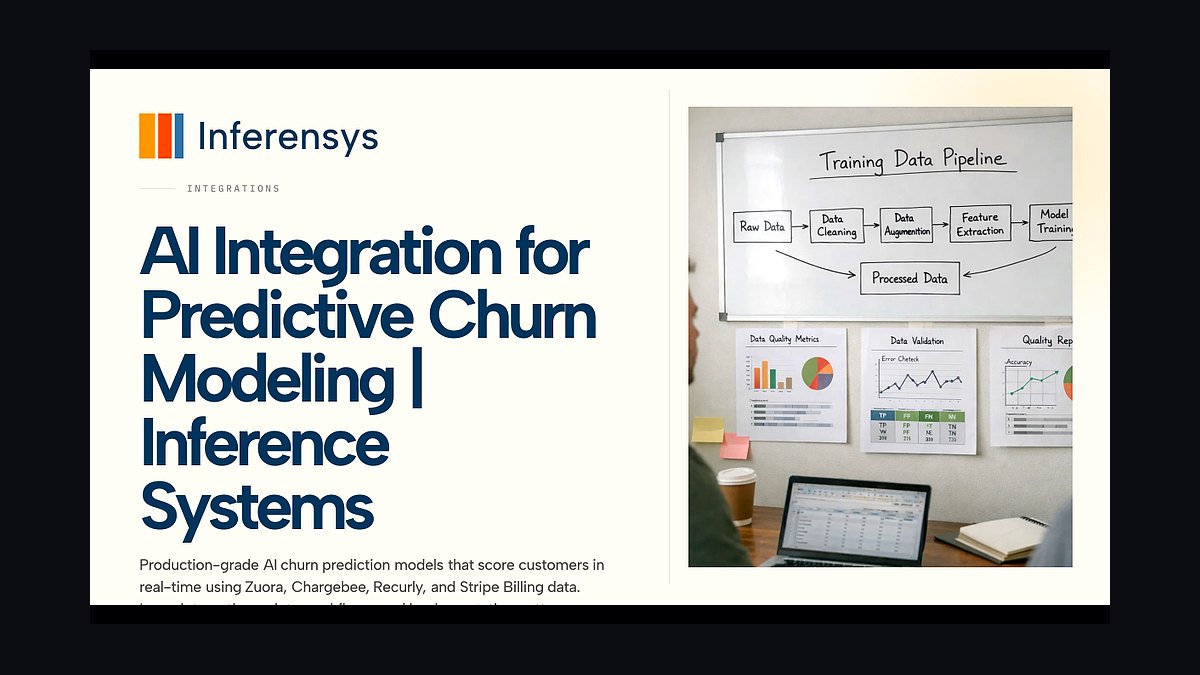
Predictive churn modeling in 2027 has evolved from the 2020-2022 era of simple risk-scoring models to sophisticated agentic AI systems that not only predict churn but also generate intervention recommendations, automate routine outreach, and continuously learn from intervention outcomes. The dominant 2027 platforms include Gainsight Customer Success AI (enterprise leader), ChurnZero AI (mid-market leader), Catalyst CS (product-led growth leader), Salesforce Service Cloud with Agentforce (Salesforce-native option), and several specialized players (Vitally, Totango, Planhat). The 2027 best-in-class predictive accuracy is 75 to 88 percent for identifying churn 60 to 120 days in advance — meaning the model correctly flags 75 to 88 percent of customers who will churn within that window. The 2024-2027 evolution is driven by three factors: agentic AI that goes beyond prediction to automated intervention; product-usage signal integration that produces richer training data; and continuous learning from intervention outcomes that improves the models over time. Companies running modern predictive churn modeling typically reduce churn rates by 15 to 25 percent versus pre-AI baselines and improve net retention by 5 to 12 percentage points.
1What Modern Predictive Churn Modeling Actually Does
Predictive churn modeling in 2027 operates as a continuous feedback loop with five components.
Data ingestion. The churn model ingests data from across the customer relationship — product usage telemetry (DAU, MAU, feature adoption depth, error rates), CRM activity (last AE touch, last CS touch, recent QBR participation), support tickets (open ticket count, ticket sentiment, escalation patterns), billing and contract data (payment timing, contract size, renewal date, recent expansion or contraction), engagement signals (recent email opens, content downloads, webinar attendance), and external signals (job changes among champions, company financial signals, M&A activity).
Predictive scoring. The model scores each customer's churn likelihood on a 0-to-100 scale (or equivalent), updated daily or hourly depending on tier. The scoring uses ensemble methods combining gradient boosting, neural networks, and large language model assessments of unstructured signal data (support ticket text, conversation summaries, customer communications).
Intervention recommendation. When a customer score crosses a risk threshold, the system generates specific intervention recommendations — which exact tactic to deploy (executive sponsor outreach, technical health review, product training session, pricing renegotiation), who should execute it (CSM, CS Architect, Sales Executive, Customer Success Manager), and when (immediate, this week, this month).

Automated intervention execution. For routine interventions (product training scheduling, content recommendations, in-app messaging), agentic AI executes the intervention directly. For high-stakes interventions (executive outreach, contract restructuring), the system queues the recommendation for human CSM action.
Continuous learning. The model tracks intervention outcomes (which interventions prevented churn, which didn't) and retrains continuously. Over 12 to 24 months of operation, the model accuracy typically improves 10 to 20 percentage points as the training data accumulates.
1.1 The signal hierarchy
The 2027 churn model signal hierarchy puts product-usage signals at the top because they are most predictive. Within product usage, the most predictive signals are: declining DAU among power users; reduced feature adoption depth; rising error rates; reduced API call volume. CRM and support signals come second: reduced AE/CSM touches; rising open ticket count; ticket sentiment deterioration. Engagement signals come third: reduced email opens; reduced content engagement; reduced webinar attendance.

Companies with strong product-usage data integration see significantly better predictive accuracy than companies without. The investment in product-usage telemetry integration is one of the highest-leverage decisions in deploying predictive churn modeling.
2The 2027 Performance Benchmarks
The 2027 best-in-class predictive churn modeling performance benchmarks look approximately as follows.
Recall (sensitivity). The percentage of customers who actually churn that the model successfully flagged in advance. Top-quartile models hit 75 to 88 percent recall at 60 to 120 days advance notice. Median models hit 55 to 70 percent. Bottom-quartile models hit below 50 percent — barely better than no model.
Precision. The percentage of flagged customers who actually churn. Top-quartile models hit 60 to 80 percent precision at the highest risk tier. Median models hit 40 to 55 percent. The precision-recall tradeoff is intentional — most companies prefer to over-flag and intervene on some non-churners rather than miss actual churners.

Advance notice window. The number of days before actual churn that the model flags. Top-quartile models flag at 90 to 180 days, providing ample intervention time. Median models flag at 30 to 60 days, providing tight intervention time.
Intervention effectiveness. The percentage of flagged customers who, after intervention, do not churn. Top-quartile programs achieve 35 to 55 percent intervention save rate — meaning 35 to 55 percent of customers who were flagged for churn and intervened upon do not churn. Median programs hit 20 to 30 percent.
Net churn rate reduction. The reduction in overall churn rate attributable to the predictive program. Top-quartile programs achieve 20 to 35 percent churn rate reduction. Median programs achieve 10 to 15 percent reduction.
3The Platforms Leading the Category
Five platforms dominate the 2027 predictive churn modeling category, each with distinct positioning.

Gainsight Customer Success AI. The dominant enterprise CS platform with deep agentic AI churn modeling. Gainsight has the deepest enterprise integration capabilities, the most sophisticated customer health frameworks, and the largest enterprise customer base. Pricing typically 200 to 450 thousand dollars per year for enterprise deployments.
ChurnZero AI. The mid-market leader with strong AI capabilities, typically positioned for 50 to 500-employee SaaS companies. ChurnZero offers significantly faster implementation than Gainsight (typically 60 to 120 days vs Gainsight's 6 to 12 months) and lower pricing (typically 100 to 250 thousand dollars per year). The capability gap versus Gainsight is small for most mid-market use cases.
Catalyst CS. The product-led-growth-focused platform with the strongest product-usage analytics. Catalyst is preferred by PLG companies (Notion, Figma, Webflow, Linear) where product-usage signals dominate the churn prediction. Pricing typically 80 to 200 thousand dollars per year.
Salesforce Service Cloud with Agentforce. For Salesforce-heavy enterprises, the native CS option with deep integration into Sales Cloud and Data Cloud. Service Cloud with Agentforce is increasingly competitive with Gainsight at enterprise scale, particularly for companies with strong Salesforce data infrastructure. Pricing typically consumption-based on Agentforce plus Service Cloud license.

Specialized players (Vitally, Totango, Planhat). Smaller platforms with vertical focus or feature differentiation. Vitally is strong for product-led growth; Totango has unique customer journey orchestration; Planhat is positioned for high-touch enterprise CS. Pricing varies but typically 60 to 200 thousand dollars per year.
3.1 The platform selection framework
The platform selection framework depends on three factors. First, company stage and CS budget. Enterprises with strong CS budgets and complex requirements typically pick Gainsight. Mid-market companies typically pick ChurnZero. SMB companies typically pick Catalyst or one of the specialized players.
Second, CRM stack alignment. Salesforce-heavy enterprises increasingly evaluate Service Cloud with Agentforce alongside or instead of standalone CS platforms. HubSpot customers often use HubSpot Service Hub with Breeze as their integrated CS option.

Third, product-led growth orientation. PLG-heavy companies strongly prefer Catalyst or Vitally because the product-usage signal integration is deeper. Sales-led companies have more flexibility.
4The Implementation Approach
A CS leader deploying predictive churn modeling in 2027 should approach the project in this sequence.
Months 1 to 3: data infrastructure assessment. Audit the customer data sources (CRM, product, support, billing). Identify data quality and integration gaps. Most companies have data infrastructure work to do before predictive churn modeling can be effective.
Months 3 to 6: platform selection and deployment. Select Gainsight, ChurnZero, Catalyst, or Service Cloud based on the selection framework. Implement the platform with deep data integration. The implementation typically takes 60 to 180 days depending on platform and complexity.

Months 6 to 9: model training and calibration. The platform's out-of-the-box models work but are not optimal for the specific company. Calibrate the models using the company's historical churn data. Tune the signal weights based on what proves most predictive for the specific business.
Months 9 to 12: intervention playbook development. Develop intervention playbooks for different churn-risk patterns. Test interventions on flagged customers and measure save rates. Build the playbook library that the platform can deploy automatically.
Months 12 to 18: scale and optimize. Roll out the full predictive program across all customer segments. Establish ongoing optimization cadence — monthly model retraining, quarterly playbook review, annual platform optimization.
By month 18, the predictive program is producing measurable churn reduction and the CS team is operating with the predictive scoring as a core part of their daily workflow.

5The Mistakes Companies Make on Predictive Churn Modeling
The biggest mistake is treating the predictive model as a stand-alone analytics product. Some companies deploy the model and produce dashboards but don't operationalize the predictions into intervention workflows. The predictions sit unused while customers churn. The right deployment integrates the predictions into daily CSM workflow and automated agentic interventions.
The second mistake is under-investing in product-usage data integration. Companies that try to build predictive churn models from CRM data alone produce significantly weaker accuracy than companies with strong product-usage telemetry integration. The investment in product-usage data infrastructure pays back substantially.
The third mistake is failing to develop intervention playbooks. The predictive model identifies at-risk customers; the playbooks define what to do about them. Companies that have strong models but weak playbooks produce minimal save rate even when predictions are accurate.
The fourth mistake is over-relying on the model versus human judgment. The model is highly accurate but not infallible. Some companies flag customers as low-risk based on the model and miss obvious risk signals that the CSM would have caught. The right approach uses the model as input plus CSM judgment.

The fifth mistake is failing to retrain the model regularly. Customer behavior patterns shift over time; the model's training data ages. Companies that deploy the model and don't retrain quarterly or monthly see accuracy degrade.
6The Outlook for 2028-2029
The predictive churn modeling trajectory through 2028-2029 points in three directions.
Deeper agentic AI integration. The 2028-2029 platforms will increasingly use agentic AI not just to predict but to autonomously execute the full intervention sequence — from initial outreach through escalation through executive engagement. The human CSM role becomes more strategic and less operational.

Multi-modal signal integration. Voice signal analysis (from sales and CS calls), video signal analysis (from meeting recordings), and natural language understanding of customer communications will all contribute to predictive churn scoring. The signal richness will improve predictive accuracy further.
Cross-product portfolio analysis. For companies with multiple product lines, predictive churn will increasingly span the portfolio — predicting which customers will churn from which products and identifying cross-product retention opportunities.
By 2029, predictive churn modeling will be the operational backbone of customer success in most B2B SaaS companies. The 2027 best-in-class accuracy benchmarks of 75 to 88 percent recall are expected to rise to 85 to 95 percent by 2029 as the technology matures.
Related on PULSE
- What data sources are most effective for training AI models to predict next best action in complex enterprise deals?
- How does the expanding size of B2B buying committees increase the risk of vendor consolidation paralysis?
- Which vendor consolidation strategies are failing most often when integrating AI sales tools into existing stacks?
- Why are longer sales cycles now correlating with a shift from pipeline velocity to deal value predictability?
- What specific metrics are B2B RevOps teams using to measure AI's impact on lead quality in the top-of-funnel?
FAQ
What is the typical accuracy range for predictive churn models in 2027? Best-in-class models achieve 75 to 88 percent accuracy for predicting churn 60 to 120 days in advance. This means the model correctly identifies that percentage of customers who will actually churn within that window.
How much can churn rates improve with modern predictive churn modeling? Companies typically see a 15 to 25 percent reduction in churn rates compared to pre-AI baselines. Net retention also improves by 5 to 12 percentage points.
Which tools are the leading platforms for predictive churn modeling in 2027? The dominant platforms include Gainsight Customer Success AI (for enterprise), ChurnZero AI (for mid-market), Catalyst CS (for product-led growth), and Salesforce Service Cloud with Agentforce (for Salesforce-native environments). Specialized players like Vitally, Totango, and Planhat also compete.
How does 2027 predictive churn modeling differ from earlier versions? It has evolved from simple risk-scoring models to agentic AI systems that not only predict churn but also generate intervention recommendations, automate routine outreach, and continuously learn from outcomes. This shift is driven by richer product-usage signals and automated feedback loops.
What data sources do these models typically use? Models integrate product-usage signals (e.g., feature adoption, login frequency), customer support interactions, billing history, and engagement metrics. The richer the data, the better the predictions.
How quickly do these models improve over time? They continuously learn from intervention outcomes, so accuracy and effectiveness typically increase within months as the system sees more real-world results. Most platforms show measurable improvement within 3 to 6 months of deployment.
Sources
- Gainsight 2026 Customer Success AI product documentation and customer benchmarks
- ChurnZero 2026 AI-Driven CS Benchmark Report
- Catalyst CS 2026-2027 product-led customer success benchmarks
- Salesforce Service Cloud with Agentforce 360 documentation 2025-2027
- TSIA 2026 State of Customer Success Operations Report
- Forrester Wave 2026 Customer Success Management Platforms
- Pavilion 2026 RevOps Benchmark Survey on CS technology and churn modeling
- Bessemer Cloud 100 2027 customer success efficiency benchmarks
People also search for: what is predictive churn modeling · predictive churn modeling explained · predictive churn modeling definition
This page will be disappearing soon. Save it to your device for $1 — or read it free while it is here.
@Kory-White- · if Venmo asks, the last 4 of my number are 2012
This page is gone.
This one is off the shelf now. $1 keeps it on your phone for good — the whole page, pictures and diagrams included.
 revopsHow is AI changing customer success in 2027?
 revopsHow do you reduce churn with RevOps in 2027?
 revopsHow do you build a customer handoff process from sales to CS in 2027?
 revopsHow do you build a customer health score in 2027?
 revopsWhat is the 2027 typical CSM comp plan with NRR component?
 revopsWhat is the 2027 Net Revenue Retention (NRR) benchmark for B2B SaaS?
 revopsHow do you align sales and customer success in 2027?
 revopsWhat is the 2027 status of Customer Success org structure and AI?
 revopsHow is AI changing customer onboarding and time-to-value in 2027?
 revopsHow do you build a renewals process that prevents surprise churn in 2027?