


How do you build a renewal-risk scoring model in 2027?
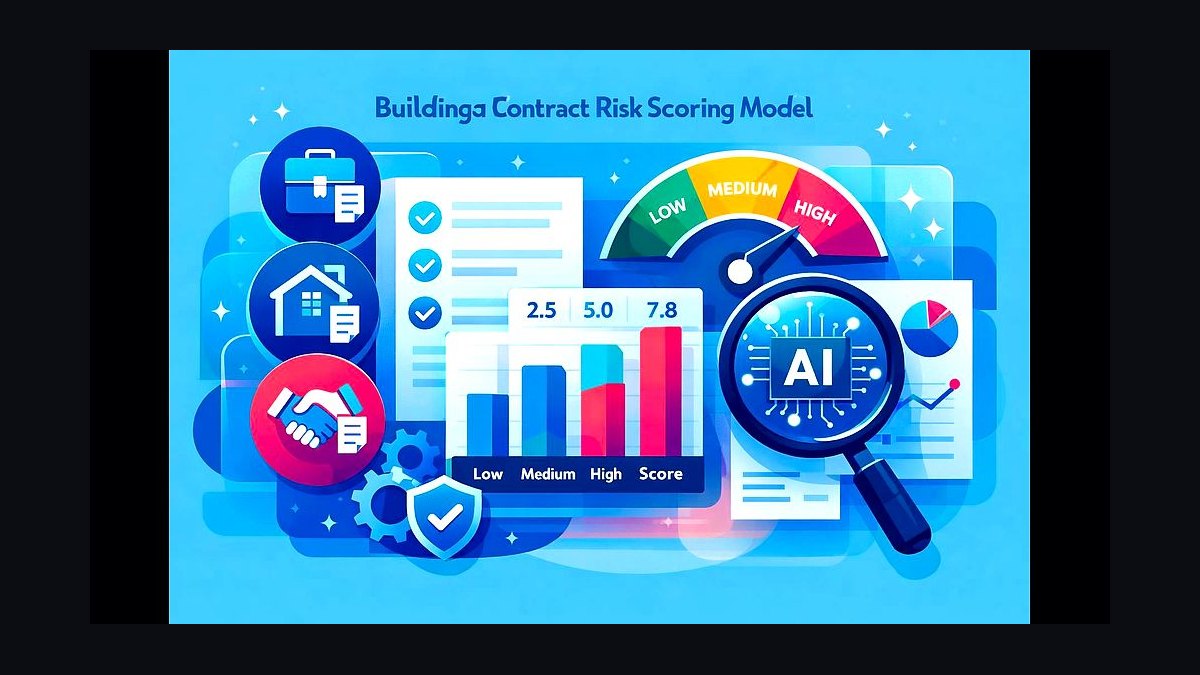
A 2027 renewal-risk scoring model is a 0-100 composite updated every 24 hours by an agentic AI layer (Gainsight Sidekick, Vitally Concierge, Pylon AI) that ingests five weighted signal categories — usage 30%, engagement 25%, commercial 20%, people 15%, external 10% — and is recalibrated quarterly against actual churn outcomes pulled from Snowflake. The model lives in your CS platform (Gainsight, Vitally, ChurnZero, Catalyst, Totango, Planhat), reads product telemetry from Pendo / Heap / Amplitude / Mixpanel, layers champion-departure alerts from UserGems and Champify, and ingests external account events (funding, layoffs, M&A) from Common Room and Crossbeam. The output drives a banded intervention playbook: 90+ exec-sponsor call inside 7 days, 70-89 AE-led recovery plan, 50-69 CSM enablement push, sub-50 expansion focus. Top-quartile operators benchmarked by OpenView, Bessemer Cloud Index, and the Gainsight Pulse Benchmark Report sustain NRR ≥ 120% and GRR ≥ 92%; bottom-quartile operators run NRR < 90% and lose the public-multiple premium.
1The Five Input Categories
A renewal-risk score is only as good as the signals feeding it. Forrester, Gartner, and the Customer Success Collective converge on a five-category schema that Gainsight, Vitally, ChurnZero, and Planhat all now ship as default scorecards out of the box.
1.1 Usage Signals — 30% weight
The heaviest weight, because behavior beats opinion. Pull DAU/MAU ratio, license utilization (paid seats vs. active seats over a rolling 30 days), feature-adoption breadth (count of "sticky" features used in last 14 days), and time-to-value milestones from Pendo, Heap, Amplitude, or Mixpanel. The two most predictive sub-metrics in the Gainsight 2026 Pulse Benchmark Report are license-utilization decay (a 20-point drop in 60 days predicts churn at 3.4x baseline) and power-user departure (when the top-10 users by event volume drop below 50% of their 90-day baseline).

1.2 Engagement Signals — 25% weight
Relationship temperature rolled up from NPS (quarterly), CSAT (per-ticket), support-ticket volume + sentiment (parsed by Pylon AI or Gainsight Sidekick), executive-sponsor calls in the last 90 days, and QBR attendance rate. A sustained NPS drop of more than 20 points or zero exec-sponsor touches in 90 days each independently double renewal risk in OpenView's 2027 NRR Survey.
1.3 Commercial Signals — 20% weight
Contract economics. Track discount drift (current discount vs. cohort median), price-increase response (did they push back?), contract length (annual is riskier than multi-year), multi-year flag, co-term status, and auto-renew clause presence. A customer who fought a 7% price increase and signed a one-year deal is fundamentally riskier than the same logo on a three-year auto-renew, regardless of usage.

1.4 People Signals — 15% weight
The "human supply chain" of your deal. UserGems and Champify monitor LinkedIn and CRM for champion departures, executive-sponsor turnover, and key-user job changes. Common Room and Champify also surface internal title changes that quietly de-fund your champion. Per Champify's 2026 benchmark, accounts that lose their primary champion without a multi-threaded backup churn at 2.6x the baseline rate within two renewal cycles.
1.5 External Signals — 10% weight
Macro and corporate events. Funding rounds (positive — more budget), layoffs (negative — frozen spend), M&A activity (chaotic — often consolidates to incumbent), industry-specific regulatory shifts. Common Room, Crossbeam, and UserGems all now ingest these via Crunchbase, PitchBook, and layoffs.fyi feeds and surface them as account-level alerts.

2The Weighted Composite Model
The math is simple; the calibration is everything. Each category outputs a 0-100 sub-score, the sub-scores are weighted, and the weighted average is the composite renewal-risk score. The default weights are a starting point — calibrate quarterly against your last 8 quarters of actual churn outcomes using a logistic regression in Snowflake or directly inside Gainsight Horizon AI.
| Category | Default Weight | Primary Tools | Calibration Signal |
|---|---|---|---|
| Usage | 30% | Pendo, Heap, Amplitude, Mixpanel | License-utilization decay |
| Engagement | 25% | Gainsight, Vitally, Pylon, Gong | NPS delta, exec-sponsor touches |
| Commercial | 20% | Salesforce, HubSpot, Clari | Discount drift, contract length |
| People | 15% | UserGems, Champify, Common Room | Champion-departure events |
| External | 10% | Common Room, Crossbeam | Funding, layoffs, M&A |

2.1 The AI-Augmented Layer
In 2027 the model is no longer hand-tuned. Gainsight Sidekick, Vitally Concierge, and Pylon AI auto-derive risk scores every 24 hours from the latest data, surface the top three contributing signals per account, and recommend the next-best action. MCP (Model Context Protocol) connectors let the agent pull from Salesforce, HubSpot, Snowflake, Pendo, Gong, and Slack in one call, then write back to the CS platform without a human in the loop for sub-50 (healthy) accounts.
2.2 Outcome-Priced Calibration
A 2027 wrinkle: vendors increasingly price on outcomes (NRR delta, churn prevented) rather than seats. That changes the model — false positives (flagging healthy accounts) now cost vendor margin, so calibration tightness matters more than it did under seat pricing. Bessemer's 2027 Cloud 100 commentary called this "the end of vanity scoring."

3The Intervention Playbook By Score Band
A score without a playbook is a dashboard, not a system. ScaleVP, Tomasz Tunguz, and Pavilion all publish variants of the same banded model.
3.1 Critical (90-100)
Executive sponsor reaches out within 7 calendar days. Bring a tailored mutual-action-plan (built in Gainsight or Pylon), a credit or service concession pre-approved by finance, and a documented escalation owner. Gainsight Pulse 2026 data shows 42% of accounts in this band can be saved if the exec call happens inside 7 days; that drops to 18% at 30 days.

3.2 High (70-89)
AE-led recovery plan. Multi-threaded outreach to net-new stakeholders, a re-discovery using MEDDICC and JTBD frames, and a renewal proposal restructured around the customer's current state (not the original sale). Logged in Clari as a flagged renewal opportunity with weekly forecast review.
3.3 Watch (50-69)
CSM enablement push. Targeted in-product Pendo guides, an enablement webinar series, a check-in with the operational champion (not the exec). The goal is to re-anchor value before the score crosses 70.

3.4 Healthy (0-49)
Expansion focus. Hand to UserGems, Endgame, or Correlated for product-led-growth expansion signals and route qualified expansion leads to the AE. Bessemer's "second contract" research shows the 0-49 band is where 80% of NRR upside originates.
4Benchmarks That Anchor The Model
You cannot calibrate a score without external reference points. The 2027 canon:

- Gainsight Pulse Benchmark Report 2026 — median GRR 89%, top-quartile 94%; median NRR 108%, top-quartile 122%.
- OpenView NRR Survey 2027 — enterprise (ACV >$100K) median NRR 118%, mid-market 108%, SMB 97%; top-quartile crosses 130% across all segments.
- Bessemer Cloud 100 — public SaaS at NRR >130% trades at 15-20x forward revenue; sub-100% trades at 3-5x. The renewal-risk model is, in effect, a multiple-protection mechanism.
- ChiefMartec State of MarTech 2026 — 71% of CS teams now run an AI-augmented risk score, up from 38% in 2024.
5The 2027 Toolchain
A defensible build runs on a layered stack rather than a monolith. Snowflake as the warehouse, a CS platform as the system of action, product analytics for behavioral truth, and signal vendors for the human and macro layers.

- CS platform (system of action): Gainsight, Vitally, ChurnZero, Catalyst, Totango, Planhat
- AI risk-scoring layer: Gainsight Sidekick, Vitally Concierge, Pylon AI
- Product analytics (usage): Pendo, Heap, Amplitude, Mixpanel
- CRM + revenue: Salesforce, HubSpot, Clari, Gong
- People + external signals: UserGems, Champify, Common Room, Crossbeam, Correlated, Endgame
- Warehouse + modeling: Snowflake (calibration, logistic regression, write-back to CS)
2Data Freshness and Latency Requirements
A renewal-risk model is only as good as its data freshness. In 2027, the benchmark for signal ingestion is sub-15-minute latency for usage and engagement data, and hourly for commercial and external signals. Platforms like Snowflake and Databricks enable real-time streaming via Kafka or Kinesis, while CS tools like Gainsight and Vitally support webhook-based updates from product analytics (e.g., Pendo or Heap). Stale data—anything older than 24 hours—can misclassify a 90+ account as 70-89, leading to delayed intervention. Top-quartile teams run a data health check weekly, flagging any signal source that hasn't updated in the last 6 hours. If your model uses batch exports from Amplitude or Mixpanel, you're likely 12-24 hours behind reality—acceptable for expansion focus, but risky for at-risk accounts.

3Model Validation and Drift Monitoring
Building the model is step one; keeping it accurate is the ongoing work. In 2027, leading teams validate their scoring model quarterly against actual churn outcomes, using a holdout set of 10-20% of accounts. Metrics tracked include precision (of predicted churners who actually churn) and recall (of actual churners flagged by the model). A healthy model maintains precision above 70% and recall above 80%. Drift monitoring—checking if signal weights still reflect current churn drivers—is automated via MLflow or Weights & Biases, with alerts if the model's AUC drops below 0.75. Common drift triggers: a sudden spike in usage without engagement (e.g., AI tool adoption without executive sponsorship), or a shift in external signals (e.g., funding rounds becoming less predictive). If drift exceeds 10% between quarters, recalibrate weights using the last 90 days of data.
FAQ
What is the ideal update frequency for a renewal-risk scoring model? Most high-performing teams refresh their model every 24 hours using automated data pipelines. This cadence balances timeliness with operational overhead, though some models update intraday for critical signals like champion departures or funding events.
Which signal categories matter most for renewal risk? Usage data typically carries the heaviest weight, often around 30% of the composite score, followed by engagement at 25% and commercial signals at 20%. People changes and external events usually contribute the remaining 25%, but weights vary by business model and customer segment.
How do you validate a renewal-risk model’s accuracy? Teams compare predicted risk scores against actual churn outcomes quarterly, using historical data stored in a data warehouse like Snowflake or BigQuery. A good model achieves an AUC-ROC above 0.80, with regular recalibration to account for shifting customer behaviors.
What tools are commonly used to build these models? The model typically lives inside a customer success platform such as Gainsight or Vitally, ingesting product telemetry from Pendo or Amplitude. External signals come from tools like UserGems for champion tracking and Common Room for account events, all orchestrated by an agentic AI layer.
How do you translate risk scores into action? Scores are banded into intervention tiers—for example, scores above 90 trigger an executive sponsor call within a week, while scores between 50 and 69 prompt a CSM-led enablement push. Lower scores often shift focus to expansion opportunities rather than retention.
What benchmarks indicate a healthy renewal-risk model? Top-quartile operators typically maintain net revenue retention above 120% and gross retention above 92%. Bottom-quartile performers often see NRR below 90% and face a public-market valuation discount compared to peers.
Bottom Line
A 2027 renewal-risk score is a weighted, AI-recomputed, daily 0-100 composite of five signal categories, calibrated quarterly against actual churn, and wired directly into a banded intervention playbook that escalates exec time only on the 90+ band. Build it on Snowflake + Gainsight (or Vitally) + Pendo + UserGems + Common Room, hold yourself to GRR 92% / NRR 120% as the top-quartile bar, and treat the score as a multiple-protection mechanism — not a dashboard.
Related on PULSE
- How do you build a deal scoring model to predict close in 2027?
- How do you build a lead scoring model that sales trusts in 2027?
- How do you build a customer health scoring model in 2027?
- How do you actually build a lead scoring model that works?
- How do you build a real ICP scoring model that reps actually use to filter inbound leads instead of working everything?
- How do you rebuild a 2027 lead scoring model when buying committee members gatekeep anonymously?
Sources
- Gainsight — Customer Success Metrics: What to Track in 2026
- Gainsight — Pulse Benchmark Report 2026 (NRR, GRR, scorecard weights)
- Vitally — AI for Churn Management: A Practical Guide for CSMs
- OpenView Partners — NRR Survey 2027 and SaaS Benchmarks
- Bessemer Venture Partners — Cloud 100 and State of the Cloud 2027
- ChurnZero — Customer Health Score Framework
- Forrester — The 2026 Customer Success Wave
- Gartner — Market Guide for Customer Success Platforms 2026
- UserGems — Champion Tracking and Job-Change Signals
- Champify — Champion Departure Churn Benchmark 2026
- Common Room — Signal-Based GTM Playbook
- ChiefMartec — State of MarTech 2026
- Customer Success Collective — Renewal-Risk Scoring Standards
- Pavilion — CS Operating Model Benchmarks
People also search for: build a renewal-risk scoring model · how to build a renewal-risk scoring model · build a renewal-risk scoring model guide
This page will be disappearing soon. Save it to your device for $1 — or read it free while it is here.
@Kory-White- · if Venmo asks, the last 4 of my number are 2012
This page is gone.
This one is off the shelf now. $1 keeps it on your phone for good — the whole page, pictures and diagrams included.
 revopsHow do you build a customer journey map in 2027?
 revopsHow do you build a Champion-departure save process in 2027?
 revopsHow do you set up MEDDPICC (with Paper Process) deal inspection in 2027?
 revopsHow do you deploy AI SDRs in 2027?
 revopsWhy is net revenue retention compressing in 2027 and how do you fix it?
 revopsHow do you do effective sales call planning in 2027?
 revopsHow do you build a hybrid AE+CSM role in 2027?
 revopsHow do you set up signal-based selling in 2027?
 revopsHow do you do effective objection handling in 2027?
 revopsHow do you set up a deal-desk in 2027?