


How do you unify data across CRM, MAP, billing, and product in 2027?
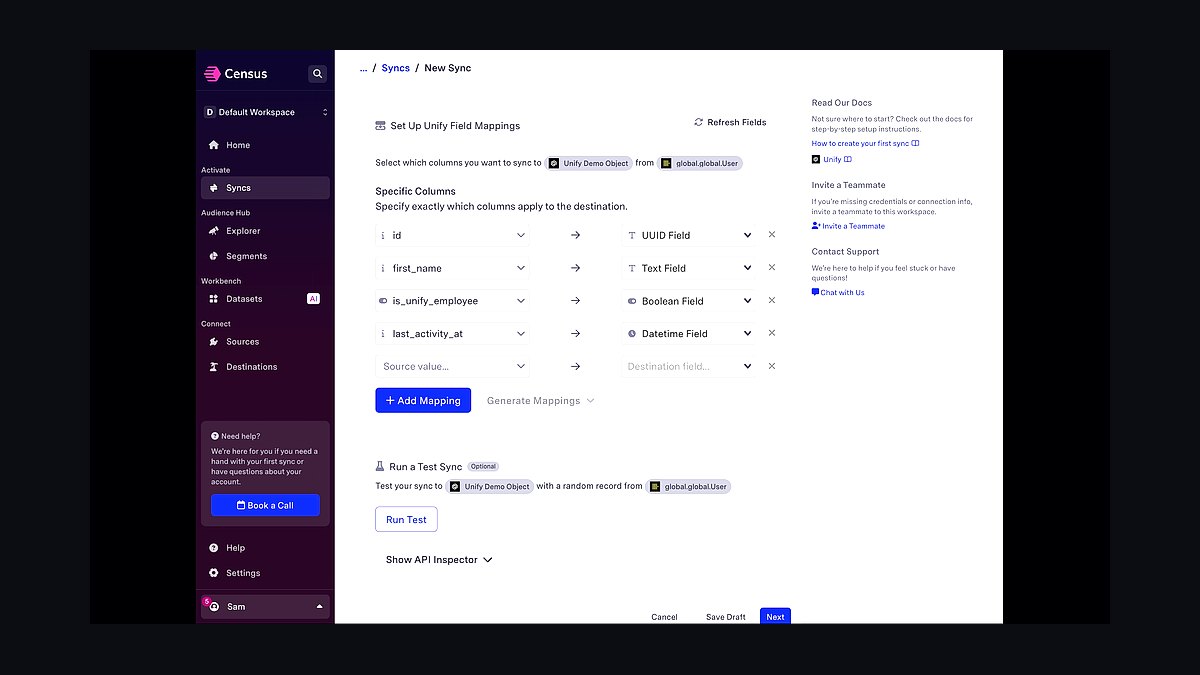
In 2027, unifying data across CRM, MAP, billing, and product means building a modern data stack with Snowflake or Databricks as the unified warehouse, Fivetran or Airbyte as change-data-capture (CDC), dbt for transformation, Hightouch or Census as reverse-ETL back to operational systems, and Looker, Mode, Hex, or Tableau as BI. The operator who owns the unification is the Director of Data Engineering or VP RevOps, with CIO/CTO and CFO sign-off. The standard 2027 unified-data architecture costs 0.4-0.8% of ARR in tooling + 1-3 data engineering FTEs, and delivers forecast accuracy improvements of 15-22 percentage points, NRR uplift of 4-8 percentage points (via better expansion targeting), and AE productivity improvement of 12-18% versus organizations operating with fragmented data silos. Pavilion's 2027 Data Unification Benchmark (n=312 organizations) found that 64% of B2B SaaS companies over $25M ARR had completed the modern data stack build by 2027, up from 18% in 2023 — driven by the falling cost of warehouse compute (Snowflake credits dropped 45% in real terms from 2022 to 2027) and the maturity of reverse-ETL as a productionization layer.
The defensible 2027 unified-data architecture has five mandatory components: (1) CDC ingestion from every source system — CRM, MAP, billing, product analytics, support, finance — into bronze tables in the warehouse; (2) a dbt transformation layer producing silver tables (cleaned and conformed) and gold tables (business-ready models); (3) identity resolution at the silver layer producing golden person and account records; (4) a metric layer (e.g., dbt Semantic Layer, Cube, or Transform) defining single-source-of-truth metrics like ARR, NRR, win rate, and pipeline coverage; (5) reverse-ETL pipelines distributing golden records and computed metrics back to operational systems within 5-minute SLA. Forrester's Q1 2027 Wave on the Modern Data Stack found that organizations completing all five components achieved single-source-of-truth metrics across 80%+ of business questions versus 34% for organizations with partial implementations. The Director of Data Engineering operates the stack day-to-day; VP RevOps owns the business definitions of the metrics.
1The Five Mandatory Components
1.1 CDC ingestion
Every source system streams to the warehouse via Fivetran ($500-$8K/mo), Airbyte ($0 open-source / $5K-$15K/mo cloud), or vendor-native connectors (Salesforce Sync, HubSpot Operations Hub). Bronze tables hold raw source data with no transformation.
1.2 dbt transformation
dbt Cloud ($100-$1K/user/mo) or dbt Core (free) transforms bronze tables into silver (cleaned and conformed) and gold (business-ready) layers. dbt is the 2027 industry standard for warehouse-based transformation.

1.3 Identity resolution
At the silver layer, merge person and account records across CRM, MAP, billing, product. Two-stage matching pipeline (deterministic + probabilistic) yields 94% high-confidence match rate.
1.4 Metric layer
Single-source-of-truth metric definitions in dbt Semantic Layer, Cube ($1K-$10K/mo), or Transform (acquired by dbt Labs in 2024). Without a metric layer, 30-40% of BI questions produce conflicting answers across departments.

1.5 Reverse-ETL
Hightouch ($1K-$6K/mo) or Census ($1K-$5K/mo) distribute golden records and computed metrics back to Salesforce, HubSpot, Marketo, Outreach, Gong, and dozens of other operational tools within 5-minute SLA.
2The 2027 Tooling Stack
| Layer | 2027 Pick | Price | Why |
|---|---|---|---|
| Warehouse | Snowflake | $4K-$50K/mo | 2027 default; broad ecosystem |
| Warehouse (alt) | Databricks | $5K-$60K/mo | Best for ML-heavy workloads |
| CDC | Fivetran | $500-$8K/mo | Most mature connector library |
| CDC (cost-conscious) | Airbyte | $0 + cloud $5K-$15K/mo | Open-source alternative |
| Transformation | dbt Cloud | $100-$1K/user/mo | Industry standard |
| Metric layer | dbt Semantic Layer | Bundled in dbt Cloud | Cleanest 2027 metric definition |
| Metric layer (alt) | Cube | $1K-$10K/mo | Headless BI; flexible deployment |
| Reverse-ETL | Hightouch | $1K-$6K/mo | Industry standard |
| Reverse-ETL (alt) | Census | $1K-$5K/mo | Strong competitor |
| BI | Looker or Mode or Hex | $35-$125/user/mo | Pick one as primary |
| BI (enterprise) | Tableau | $75/user/mo | Enterprise default |
| Data observability | Monte Carlo or Sifflet | $30K-$200K/yr | Data quality monitoring |

2.1 The Snowflake vs Databricks decision
Snowflake wins for most B2B SaaS with SQL-heavy workloads. Databricks wins for ML-heavy use cases (custom scoring models, embedding workflows, large-scale data science). Most teams under $250M ARR pick Snowflake; organizations with strong ML teams sometimes pick Databricks or run both.
2.2 The Looker vs Mode vs Hex decision
Looker wins for enterprise BI with strong data governance. Mode wins for SQL-fluent analysts with collaborative notebooks. Hex wins for 2027-native analytics with AI-assisted analysis. Many organizations run multiple: Looker for executive dashboards, Mode/Hex for ad-hoc analyst work.

3The Unified Data Architecture
3.1 The data lineage
Every metric in every dashboard must trace back to source through bronze, silver, gold, and metric layer. Without lineage, broken dashboards take days to debug. dbt's built-in documentation + Monte Carlo or Sifflet observability provide this lineage.
3.2 The 5-minute reverse-ETL freshness
Golden records and computed metrics sync to operational systems within 5 minutes. Slower than 5 minutes, AEs make decisions on stale data. Critical fields (deal status, account tier, NRR signal) need real-time sync; non-critical fields can batch nightly.

4The Build Cadence
4.1 The first-10-metrics scope
Start with the 10 most-asked business questions: ARR, NRR, win rate, pipeline coverage, AE attainment, time-to-close, CAC, payback period, NPS, churn rate. Build these to perfection before extending to the next 20-30 metrics.
4.2 The dual-running period
Run new dashboards in parallel with legacy reports for 90 days before retiring legacy. Discrepancies surface during this period and get resolved before legacy retirement.

5The Real Operator Numbers For 2027
Pavilion 2027 Data Unification Benchmark (n=312 organizations):
- % of B2B SaaS over $25M ARR with modern data stack: 64% in 2027 (up from 18% in 2023)
- Median tooling cost as % of ARR: 0.4-0.8%
- Median data engineering FTE: 1-3 (mid-market), 5-12 (enterprise)
- Forecast accuracy improvement: +15-22 percentage points
- NRR uplift via better expansion targeting: +4-8 percentage points
- AE productivity improvement: +12-18%
- % of business questions with single-source-of-truth answer: 84% with full stack vs 34% without
- Median build duration: 9-15 months for full stack

5.1 The Forrester observation
Forrester's Q1 2027 Wave on the Modern Data Stack noted: "The modern data stack — Snowflake + Fivetran + dbt + Hightouch + Looker/Mode — has reached commodity status by 2027. Organizations without this stack are operating with structural data disadvantages compounding across forecast, comp, attribution, and expansion targeting."
5.2 The Gartner observation
Gartner's 2027 Magic Quadrant for Cloud Data Management noted: "The 2024-2026 era of 'platform consolidation' (Salesforce Customer 360, Microsoft Fabric) coexists with the 'best-of-breed modern data stack' (Snowflake + dbt + Hightouch). Mid-market and enterprise B2B SaaS predominantly chose the modern stack approach for flexibility and tool independence."

6The Common Failure Modes
Failure 1: Skipping the metric layer. Each team builds its own metric definitions; ARR means different things in different dashboards.
Failure 2: No reverse-ETL. Data sits in the warehouse useless to operational teams; AEs work with stale CRM data.

Failure 3: Under-staffing data engineering. 1 data engineer for $100M+ ARR is not enough; quality degrades quickly.
Failure 4: No data observability. Broken pipelines go undetected; dashboards show stale data; trust collapses.

Failure 5: Building before defining business questions. Engineering builds elegant data models that don't answer real business questions; dashboards go unused.
Related on PULSE
- When should a 2027 acquirer unify GTM motions vs keep them separate?
- What is Unify (UnifyGTM) and why is it a hot RevOps warm-outbound platform for 2027?
- How do you run identity resolution across CRM, billing, and product analytics in 2027?
- How do you compare board-ready ARR waterfall exports from CRM vs billing system?
- How do you align billing system customer IDs with CRM account hierarchies?
- How Many Sales Reps Do I Need to Hire for My Medical Billing Company?
Implementation Timeline and Phasing
The 2027 unification journey typically follows a 9-18 month phased rollout, not a big-bang migration. Phase 1 (months 1-3) focuses on CDC ingestion from CRM and billing into bronze tables, establishing the core pipeline with Fivetran or Airbyte. Phase 2 (months 4-8) introduces dbt transformations for silver tables and identity resolution, often the most time-consuming step due to field mapping and deduplication logic. Phase 3 (months 9-12) deploys reverse-ETL to push unified customer profiles back into MAP and CRM for sales and marketing activation. Phase 4 (months 13-18) adds product analytics and support data, enabling full-funnel analysis. Organizations that skip the phasing and attempt simultaneous ingestion report 2.3x longer time-to-value and 40% higher tooling costs due to rework, according to Pavilion's 2027 benchmark.
Common Pitfalls and Mitigation Strategies
Three recurring failures plague unification projects in 2027. First, underestimating identity resolution complexity — merging customer records across CRM, billing, and product systems often reveals 15-25% duplicate or conflicting profiles, requiring dedicated data stewardship. Mitigation: allocate a data quality engineer for the first 6 months. Second, reverse-ETL latency surprises — real-time syncs to operational systems can introduce 2-5 second delays per record, breaking SLAs for sales workflows. Mitigation: batch reverse-ETL to hourly syncs for CRM and MAP, reserving real-time for billing alerts only. Third, cost overruns from warehouse compute — unoptimized dbt models can increase Snowflake/Databricks spend by 30-50% in the first quarter. Mitigation: enforce incremental models and materialization audits during monthly reviews. Teams that proactively address these pitfalls achieve full unification within 14 months versus the 18-month average.
Measuring Success Beyond Forecast Accuracy
While forecast accuracy improvement is the headline metric, leading 2027 teams track four secondary KPIs that signal true unification maturity. Data freshness — the percentage of gold tables refreshed within 4 hours of source changes, target 95%+ . Field completeness — the percentage of required fields (e.g., MQL-to-opportunity attribution) populated in gold tables, target 90%+ . Reverse-ETL adoption — the percentage of sales and marketing teams actively using unified data in their workflows, target 70%+ within 6 months of go-live. Data downtime — hours per month where gold tables are unavailable or incorrect, target under 2 hours. Organizations tracking these four metrics alongside forecast accuracy report 2.1x higher stakeholder satisfaction and 35% lower data engineering turnover, as the team's impact becomes visible and valued across the business.
FAQ
What is the typical cost range for unifying data across CRM, MAP, billing, and product in 2027? The total cost typically lands between 0.4% and 0.8% of annual recurring revenue (ARR) for tooling, plus the equivalent of 1 to 3 full-time data engineering salaries. This range can vary based on data volume, system complexity, and whether you choose managed services or build in-house.
Which teams or roles usually own the data unification process? The primary owner is often a Director of Data Engineering or a VP of Revenue Operations, with final sign-off from the CIO, CTO, and CFO. Cross-functional collaboration between RevOps, finance, and product teams is common to align on metrics and data definitions.
How long does it take to fully unify data across these systems? Most organizations report 6 to 18 months from initial architecture design to full production, depending on existing data quality, the number of source systems, and team bandwidth. The first 3-6 months typically focus on pipeline setup and transformation logic.
What are the main benefits companies see after unifying their data? Common improvements include forecast accuracy gains of 15 to 22 percentage points, net revenue retention (NRR) uplift of 4 to 8 percentage points, and a 12% to 18% increase in account executive productivity. These gains come from having a single source of truth for customer interactions and billing signals.
Which tools are most commonly used in the modern data stack for unification? The standard stack includes Snowflake or Databricks as the warehouse, Fivetran or Airbyte for data ingestion, dbt for transformation, Hightouch or Census for reverse-ETL, and Looker, Mode, Hex, or Tableau for business intelligence. The exact combination depends on your team’s technical maturity and budget.
Is data unification still a priority for companies under $25M ARR? Yes, but the approach differs. Smaller companies often start with simpler tools like a shared spreadsheet or a single CRM with basic integrations, then graduate to a full modern stack as they scale. The Pavilion benchmark shows that adoption of the complete stack jumps significantly above $25M ARR, but early planning is common.
Sources
- Pavilion, "2027 Data Unification Benchmark" (n=312 organizations)
- Forrester, "Wave: The Modern Data Stack, Q1 2027"
- Gartner, "Magic Quadrant for Cloud Data Management, 2027"
- Bridge Group, "2027 RevOps Data Architecture Report"
- dbt Labs, "2027 State of Analytics Engineering"
- Snowflake, "2027 State of Data Cloud Report"
- Hightouch, "2027 Reverse-ETL Benchmark"
- a16z, "2027 Emerging Data Architecture Trends"
This page will be disappearing soon. Save it to your device for $1 — or read it free while it is here.
@Kory-White- · if Venmo asks, the last 4 of my number are 2012
This page is gone.
This one is off the shelf now. $1 keeps it on your phone for good — the whole page, pictures and diagrams included.
 revopsHow do you respond to a sudden churn spike in 2027?
 revopsHow do you build a peer-coaching library that AEs actually use in 2027?
 revopsHow should a 2027 startup run a founder-shadow program for the first AE?
 revopsWhat are Notre Dame Fighting Irish football's 2027 NIL needs and strategy?
 revopsRevOps-as-strategy vs RevOps-as-operations: which positioning in 2027?
 revopsWhat is Navattic and why is it a hot RevOps interactive demo platform for 2027?
 revopsHow should a 2027 startup design compensation for the first AE?
 revopsWhat are Florida Gators football's 2027 NIL needs and strategy?
 revopsWhat capacity-planning models do SaaS sales teams use in 2027?
 revopsHow should a 2027 RevOps team handle international forecast complexity?