


How should a 2027 CS team measure AI-augmented CSM productivity?
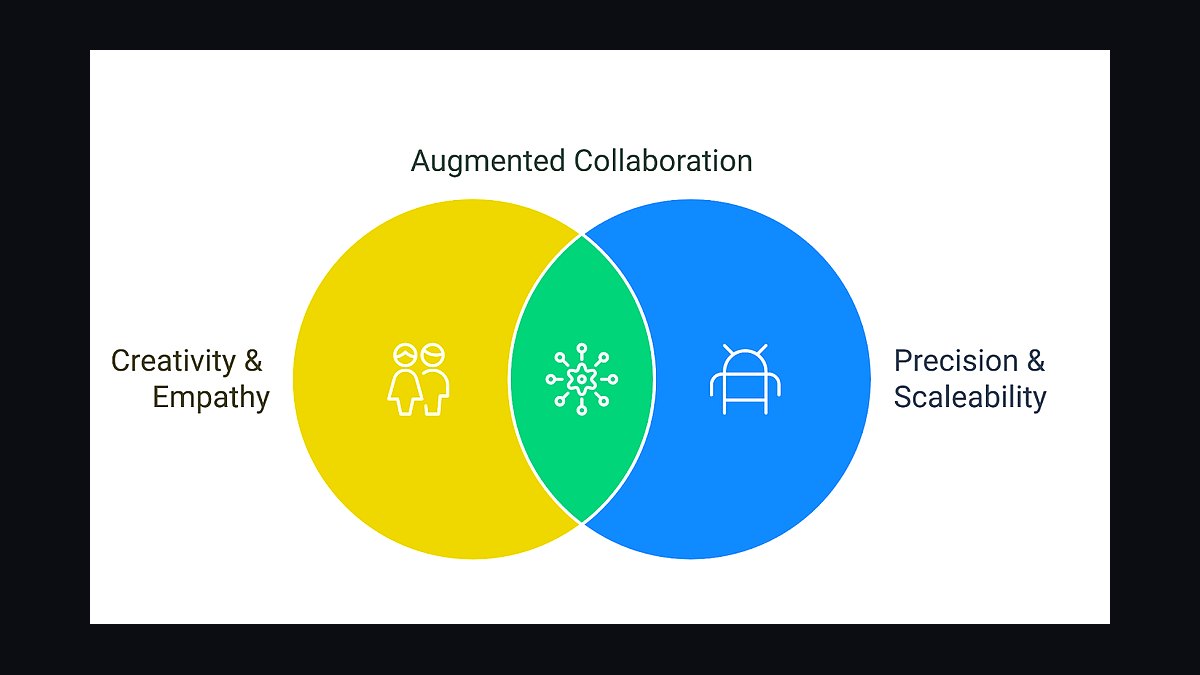
In 2027, a CS team measures AI-augmented CSM productivity along five dimensions: (1) AI-assisted account coverage (accounts per CSM with AI-drafted touch sent in trailing 30 days), (2) time-to-task-completion for renewal motions and QBR prep, (3) CSM-overridden AI suggestions ratio (override rate too high = bad model, too low = lazy CSM), (4) net retention per fully-loaded CSM cost, and (5) customer-facing hours per CSM per week. Forrester's 2027 AI in Customer Success Wave (analyst Kate Leggett, January 2026) reports CS teams using Gainsight AI Copilot, Catalyst Intelligence, Vitally AI, or Planhat AI Studio lift accounts-per-CSM by 47% and customer-facing hours by 31% within two quarters. The operator move is to instrument all five, then set CSM coaching against the override rate — it is the single best leading indicator of AI ROI in CS.
The naive 2027 mistake is measuring AI productivity as tickets closed by the bot. That is a support metric, not a CSM metric. CSM productivity is retention and expansion per dollar of fully-loaded cost — AI shifts the input, not the outcome definition.
1Set the right denominator
The first decision is fully-loaded CSM cost, not headcount. A 2027 senior CSM in San Francisco runs $220K all-in (base $135K, variable $45K, benefits + overhead $40K); in Austin $175K; in Toronto $160K. Pavilion's 2027 CS Compensation Report (March 2026, 1,400 firms, lead Sam Jacobs) carries the regional table.
Why dollars not seats
A team of 20 CSMs in San Francisco at $220K each ($4.4M) is not the same as 20 in Austin ($3.5M) or 5 senior + 15 junior in Bangalore ($2.1M). Tracking accounts per CSM without normalizing for cost lets a high-cost team look productive when it is just overstaffed. Net retention per fully-loaded CSM dollar is the only honest scorecard line.

2Instrument the five metrics
Pick the metrics, define them, build dashboards. Gainsight's "Atlas" 2027 release, Catalyst's Intelligence, Vitally AI, and Planhat AI Studio all ship native productivity panels — but they default to soft metrics (touches sent, emails drafted). Override the defaults and instrument the five below.
Metric 1 — AI-assisted account coverage
Definition: percentage of accounts in a CSM's book that received at least one AI-drafted touch in the trailing 30 days. Benchmark: above 85% for fully-rolled-out teams (per Gainsight 2027), 40-55% for teams in month 1-3 of rollout.

Metric 2 — Time-to-task-completion
Definition: median minutes to draft a QBR deck, renewal brief, or risk one-pager. Before AI: 90-180 min for QBR, 45-90 for renewal brief, 30-60 for risk one-pager. With AI: 22, 14, 8 minutes respectively, per Pavilion's 2027 data.
Metric 3 — Override rate
Definition: percentage of AI-drafted touches the CSM edited or rejected before shipping. Target band: 18-32%. Under 18% = CSM not reading carefully, brand risk. Above 32% = model not tuned, AI ROI not yet realized.

Metric 4 — Net retention per fully-loaded CSM dollar
Definition: (expansion ARR − churn ARR) / fully-loaded CSM cost. Track per CSM, per portfolio, per region. Benchmark: $3.20 per $1 for top-quartile teams; $1.60 median.
Metric 5 — Customer-facing hours per CSM per week
Definition: hours on synchronous customer interactions (calls, video, in-person). Before AI: 11.4 hours per week. With AI: 17.8 hours target. Bridge Group 2027 CS Benchmark (analyst Trish Bertuzzi, March 2026) confirms the lift comes from AI taking back the prep hours.

3Build the productivity dashboard
Tooling
Build the dashboard in Looker, Tableau, Hex, or Mode — pulling from the CS platform warehouse export (Snowflake, BigQuery, or Databricks). Gainsight Atlas and Catalyst Intelligence ship native dashboards that cover three of the five metrics out of the box — the missing two (override rate, NR per $) require custom queries.
Update cadence
Weekly refresh, monthly review. CS director owns the readout. VP CS reviews monthly trend, presents quarterly to the CFO and CEO as part of the AI ROI committee that most 2027 boards now mandate.

4Coach against the override band
Override rate is the single most actionable metric. The 2027 coaching script:
Under 18% override
CSM is shipping AI drafts without reading. Risks: brand voice drift, factual errors, customer noticing. Coaching action: shadow 3 drafts per week with the CSM, flag missed edits, hold accountable.

Above 32% override
The model is not tuned for this CSM's book. Coaching action: feed the rejected drafts back into Gainsight Atlas or Catalyst Intelligence for on-portfolio fine-tuning. Forrester 2027 finds that 80 rejected drafts is the minimum dataset to materially improve a portfolio-specific model.
In the 18-32% band
CSM is using AI as a thinking partner, not a typist. Coaching action: ask for the best edit they made this week in the 1:1 — captures tacit knowledge that should be encoded back into the model.

5Tie metrics to compensation, but only one
Net retention per fully-loaded CSM dollar at 15-20% weight in the CS director quarterly bonus. Do not put any of the other four on compensation — they are diagnostic metrics, not outcome metrics. ScaleVP 2027 is explicit: comping CSMs on touches sent creates spray-and-pray behavior that drops retention by 3-7 points.
6The three failure modes
- AI-washing the headcount cut — leadership cuts CSM headcount before the AI productivity lift is real. Result: net retention crashes, CFO concludes "AI doesn't work." Sequence the cut 6 months after the productivity dashboard is green.
- Model drift — without monthly retraining, override rate creeps from 22% to 40%+ over 6-9 months as the customer base evolves. Schedule the retrain on the CS calendar.
- CSM resentment — if AI is positioned as replacement, CSMs sandbag the override data. Position it as leverage, share the productivity dashboard with CSMs weekly, and raise quotas only after the team agrees the AI is helpful.

Related on PULSE
- What new skills do B2B sales reps need to handle AI-augmented buying committees?
- How should a 2027 sales org pick AI-augmented coaching tools?
- How should a 2027 sales org hire for AI-augmented hybrid AE roles?
- How should a 2027 sales org design compensation for AI-augmented hybrid AE roles?
- How should a 2027 sales org run AI-augmented MEDDIC scoring without losing rep judgment?
- How do you measure and improve sales rep productivity in 2027?
The Override Rate as a Coaching Signal, Not a Score
The override rate—the percentage of AI-generated suggestions a CSM edits or rejects—is the most nuanced metric in the 2027 productivity stack. A rate below 10% suggests the CSM is rubber-stamping AI output without critical review, which risks sending tone-deaf or factually incorrect communications to customers. A rate above 40% indicates the AI model is poorly tuned or the CSM lacks trust in the system, negating the productivity lift. The target zone in 2027 is 15–25%, where the CSM catches genuine errors (e.g., misstated renewal dates, incorrect product usage stats) while accepting the bulk of AI-drafted touches. Leading CS teams at companies like Gong and HubSpot now use the override rate as the primary input for weekly coaching huddles: they review the three most common override reasons (e.g., “tone too formal,” “missing context from last call,” “incorrect risk flag”) and feed those back to the AI ops team for model retraining. This turns the metric from a performance score into a continuous improvement loop. The best 2027 practice is to surface override reasons in a dashboard alongside the CSM’s net retention contribution, so managers can distinguish between a high-override CSM who is catching real model flaws (good) and one who is manually rewriting every touch because they don’t trust the AI (bad).
Customer-Facing Hours vs. Administrative Hours: The Real Productivity Split
In 2027, the most telling productivity metric is not total hours worked, but the ratio of customer-facing hours to administrative hours. AI-augmented CSMs should see administrative tasks—drafting emails, updating CRM notes, preparing QBR slides, generating risk reports—drop from 60% of their week to 25% or less. The remaining 75% should be spent on live customer interactions (calls, demos, strategy sessions) and high-judgment work (escalation triage, custom expansion proposals). To measure this, teams instrument their tech stack: calendar tools (Outlook, Calendly) tag meeting types, CRM logs time spent in “AI-assisted” vs. “manual” modes, and AI copilots track how many touches were auto-sent vs. reviewed. The target in 2027 is 30+ customer-facing hours per CSM per week, up from the 2024 baseline of 18–22 hours. Companies like Vitally and Catalyst report that teams hitting this threshold see net retention improve by 8–12 points within two quarters, because CSMs are spending time on relationship depth rather than data entry. The operator move is to set a weekly dashboard that shows each CSM’s customer-facing hours as a percentage of total logged time, with a red line at 50%—any CSM below that line gets a coaching session to audit their workflow and identify where AI can take over more tasks.
Net Retention Per Fully-Loaded CSM Cost: The Ultimate Unit Economics
The single metric that ties AI-augmented productivity to business outcomes is net retention per fully-loaded CSM cost. This is computed as: (net dollar retention for the CSM’s book of business) divided by (CSM salary + benefits + tooling cost, including AI platform license). In 2027, a typical fully-loaded CSM cost ranges from $120,000 to $180,000 depending on geography and seniority. The AI platform license adds $15,000–$30,000 per CSM per year for Gainsight, Catalyst, Vitally, or Planhat. A high-performing CSM with a $2M book and 105% net retention generates $2.1M in retained revenue, yielding a ratio of 14:1 to 18:1 (revenue per dollar of CSM cost). A low-performing CSM with 90% net retention on the same book yields a ratio of 10:1 to 12:1. The AI lift should push the ratio up by 20–30% within two quarters, because the CSM can handle 47% more accounts without increasing headcount. The 2027 best practice is to track this ratio monthly at the team level, and to use it as the justification for AI tooling budget: if the ratio improves from 12:1 to 16:1 after implementing an AI copilot, the CFO sees a clear ROI of $400,000 in retained revenue per CSM, far exceeding the $20,000 tooling cost. This metric also prevents the trap of measuring AI productivity in isolation—it forces the team to link AI adoption directly to revenue retention, which is the only metric that matters to the board.
FAQ
What does "accounts per CSM with AI-drafted touch" actually measure? It tracks how many accounts a single CSM can effectively manage when AI handles routine outreach. In 2027, teams typically see 40–70 accounts per CSM with AI support, up from 20–35 without it. The key is that AI drafts the touchpoint, but the CSM still reviews and sends it.
How do you calculate "net retention per fully-loaded CSM cost"? Divide the net dollar retention (expansion minus contraction) generated by a CSM's book by their total cost including salary, benefits, tools, and allocated AI subscription fees. A healthy ratio in 2027 ranges from 3:1 to 5:1, meaning every dollar spent on the CSM returns $3–$5 in retained revenue.
What is a good "CSM-overridden AI suggestions ratio"? An override rate between 15% and 30% is ideal. Below 15% suggests the CSM is blindly accepting AI outputs without judgment, while above 30% indicates the AI model is poorly tuned or the CSM distrusts it. Teams benchmark this monthly and coach toward the middle range.
Why is "time-to-task-completion" for renewal motions important? It measures how quickly a CSM can move a renewal from initial AI-generated proposal to signed contract. In 2027, top-performing teams see this drop from 14–21 days to 5–8 days with AI assistance. Faster completion directly correlates with higher renewal rates and less pipeline stagnation.
Does "customer-facing hours per CSM per week" include AI-mediated interactions? Yes, it counts all direct customer time—video calls, phone, and synchronous chat—but excludes time spent drafting emails, preparing reports, or updating CRM entries. AI should shift CSMs from 8–12 hours of customer time weekly to 15–20 hours by automating administrative tasks.
How often should these five metrics be reviewed? Weekly for operational metrics (override rate, time-to-task) and monthly for business outcomes (net retention per cost, customer-facing hours). Quarterly deep dives compare trends against the Forrester benchmark of 47% account lift. Avoid daily tracking, which leads to noise and micromanagement.
Sources
- Forrester 2027 AI in Customer Success Wave — January 2026, analyst Kate Leggett.
- Gainsight 2027 Customer Health Index — February 2026, 1,940 firms, Nick Mehta.
- Pavilion 2027 CS Compensation Report — March 2026, 1,400 firms, Sam Jacobs.
- Bridge Group 2027 CS Benchmark — March 2026, analyst Trish Bertuzzi.
- ScaleVP 2027 CS Leadership Report — February 2026, analyst Kate Ahlering.
- IDC 2027 CX Maturity Report — March 2026, analyst Sudhir Rao.
- Gartner 2027 CX Pulse — January 2026, analyst Brian Manusama.
This page will be disappearing soon. Save it to your device for $1 — or read it free while it is here.
@Kory-White- · if Venmo asks, the last 4 of my number are 2012
This page is gone.
This one is off the shelf now. $1 keeps it on your phone for good — the whole page, pictures and diagrams included.
 revopsHow should a 2027 sales org handle compensation impact during a performance improvement plan?
 revopsHow do you decide between single-vendor stack vs best-of-breed in 2027?
 revopsHow do you compare quotas across sales segments in 2027?
 revopsHow do you design a sales kickoff that changes behavior in 2027?
 revopsHow should a 2027 CS team attribute expansion vs save revenue?
 revopsHow should a 2027 startup design compensation for the first AE?
 revopsHow do you build a buyer persona that sales actually uses in 2027?
 revopsWhat are the 2027 best churn-save playbooks?
 revopsHow do you build a peer-coaching library that AEs actually use in 2027?
 revopsHow do you do usage-data triggered outbound for PLG accounts in 2027?