


What are opportunity-aging thresholds in B2B sales pipelines in 2027?
Quality
Certified

Opportunity-aging thresholds are pre-set time limits that flag a deal when it sits too long in a stage, too long overall, or too long without activity. Most RevOps teams tier them at roughly 1.5x median time-in-stage for a warning, 2x for manager review, and 14 days of silence for a stall alert.
The outcome you should expect
The honest promise of aging thresholds is not more revenue. It is a smaller, truer pipeline — and a forecast that stops embarrassing you in the board meeting. When you first turn thresholds on, expect the reported pipeline number to go *down*. That is the feature, not the bug. Teams that have never enforced aging typically discover that a meaningful slice of their stated coverage consists of opportunities nobody has touched in a month, where the champion left, the budget moved, or the buyer politely stopped answering and the rep never wrote it down.
The first measurable outcome is a shift in where the deal-review conversation happens. Before thresholds, a pipeline review is a rep narrating fifteen deals in whatever order they remember them, with the manager nodding and asking "so where's that one at?" After thresholds, the review opens with a filtered list: here are the eleven opportunities that crossed a line this week, here is why each one crossed, and each one leaves this meeting with a decision attached. The meeting gets shorter and the decisions get harder. Both are good.
The second outcome is forecast integrity. Aging data gives you a defensible, mechanical reason to discount a deal that the rep still calls "commit." A rep can argue about intuition. It is much harder to argue with "this has been in Negotiation for three times as long as any deal we've ever closed from Negotiation, and the last inbound email was five weeks ago." That is not a judgment call; it is arithmetic. RevOps leaders who introduce aging thresholds usually report that the gap between called number and landed number narrows within two quarters, mostly because the obviously-dead deals stop being carried.
The third outcome is behavioral, and it is the one that compounds. Reps learn that a deal parked without a next step will get surfaced. So they either book the next step or they kill it early and move the hours to something live. The best AEs already do this by instinct — thresholds make it the default for everyone else. There is a real productivity argument here that has nothing to do with hygiene: every hour spent nursing a corpse is an hour not spent on a deal that could actually close this quarter.

What you should *not* expect: a higher win rate in the first month. Win rate will look better on paper almost immediately, because you removed the denominator's worst entries, but that is accounting, not improvement. The genuine improvement — better qualification at the front, faster kills, tighter next-step discipline — takes two to three full sales cycles to show up. Set that expectation with leadership before you launch, or the first quarter's optics will get misread in both directions.
One more outcome worth naming: aging thresholds surface process problems that have nothing to do with reps. If every deal in your pipeline stalls at the same stage, at the same point, that is not fifteen lazy AEs. That is a broken step — a security review that takes six weeks, a pricing approval that requires three signatures, a legal redline queue with one lawyer. Aging data is the cheapest diagnostic you own for finding those chokepoints, because it tells you exactly where time goes to die.
What drives that outcome
Three separate clocks drive an aging system, and conflating them is the most common design error. They measure different failures and they need different responses.
Time-in-stage is the sharpest of the three. It measures how long an opportunity has sat in its current stage without advancing. This is the metric that catches the classic stall: a deal that entered Proposal, got a proposal, and then nothing. Time-in-stage is powerful because your stages already encode a hypothesis about the buying process. If Proposal normally takes two weeks and this one has taken seven, the hypothesis has been falsified. Something happened that the CRM doesn't know about.

Total opportunity age is blunter and catches a different pathology: the slow bleeder. This is the deal that never sits still long enough to trip a stage alert but has been technically "progressing" since two quarters ago. It moves from Discovery to Demo to back to Discovery, gets re-scoped, adds a stakeholder, restarts. Every individual stage looks fine. The aggregate is absurd. Total-age catches it.
Inactivity — days since the last logged, meaningful, two-way interaction — is the one most teams skip and the one that predicts best. A deal can be young in stage, young overall, and completely dead, because the buyer went dark three weeks ago. Inactivity is also the hardest to instrument honestly, because CRMs log a lot of things that are not evidence of life. An automated sequence email that bounced into a spam folder is not activity. A logged call with no connect is not activity. If your inactivity clock resets on outbound-only touches, reps will discover that within a week and reset it forever with a Tuesday email nobody reads. Define activity as *reciprocal*: a reply, a meeting held, a document opened, an inbound question.
Underneath all three clocks sits a data dependency people underestimate: your stage-entry timestamps have to be trustworthy. Salesforce, HubSpot, and Pipedrive all log stage transitions natively, but three things corrupt them. Bulk imports land with no history. Admin backfills overwrite the original entry date. And reps who skip stages — jumping Discovery straight to Proposal — produce stage-entry dates that describe a fiction. Before you build a single automation rule, sample fifty opportunities and confirm the timestamps match what actually happened. A threshold system built on bad timestamps generates noise, and noise gets ignored, and an ignored alert is worse than no alert because it teaches the team that the flags don't mean anything.
The second driver is segmentation. A $15K deal and a $400K deal do not share a physiology. Enterprise cycles involve procurement, security review, legal, and often a budget cycle the seller cannot influence; those deals will look "old" against any blended median and will trip constantly. Meanwhile SMB deals that stall for three weeks are genuinely dead but never trip a blended threshold that was dragged upward by enterprise. Run separate medians per segment — by ACV band, and if your motions differ meaningfully, by product line and by new-business versus expansion too. A renewal that has been open for ninety days before its renewal date is not stalled; it is early.
The third driver is what happens *after* the flag. This is where most aging programs quietly die. A flag with no forced decision is decoration. The mechanism that makes thresholds work is the rule that a flagged opportunity cannot survive two consecutive reviews in the same state. It advances with a dated, buyer-confirmed next step; it pushes with a written reason; or it closes. Three options, ninety seconds, next deal.
Benchmarks and realistic ranges

Treat every published benchmark as a starting hypothesis, never as your configuration. Cycle length varies enormously by deal size, buyer type, and how much of your process the buyer's procurement function controls. The right thresholds come from your own trailing data. That said, some patterns hold widely enough to be useful as sanity checks.
Multiplier ranges. Most teams land on a warn threshold somewhere between 1.3x and 1.5x the stage median, and an escalation threshold between 1.8x and 2.5x. Below 1.3x you generate false positives at a rate that trains the team to dismiss flags. Above 2.5x you are catching deals so long after death that the intervention is pointless. If you are unsure, start at 1.5x and 2.0x and tune after two quarters using actual conversion data — specifically, look at what share of deals that crossed each line eventually closed won. If more than a fifth of your red-flagged deals close, your red is too tight. If almost none of your yellow-flagged deals close, your yellow is too loose and should be the red.
Inactivity ranges. Fourteen days of no reciprocal contact is the most common first alert. Twenty-one days is a common second tier that triggers a structured re-engagement attempt — typically three differentiated touches across a week, ideally including one from someone other than the AE — before the deal closes as no-response. For very short-cycle transactional motions, both numbers should compress; seven and fourteen are more appropriate when the whole cycle is three weeks.
Pipeline health ratios. A useful diagnostic is what share of open pipeline dollars sit above your escalation threshold. In a well-run pipeline this stays in the low double digits at most; when it climbs past a quarter of open value, either your thresholds are miscalibrated or your qualification at the front is broken and you are creating opportunities that were never real. Track the trend more than the absolute number — a steady climb quarter over quarter is the signal that matters.

Lost-no-decision share. Watch the proportion of your losses that close as "no decision" versus losses to a named competitor or a specific reason. Some no-decision loss is healthy and honest; buyers genuinely stall out. But if no-decision dominates your loss reasons, one of two things is true: either you are qualifying poorly and creating opportunities out of casual interest, or your kill automation is doing the qualifying for you and reps have stopped writing real loss reasons. Both are fixable, and they need opposite fixes, so investigate before you act.
Push counts. Track how many times a close date has been moved. A single push is normal — buying committees slip. Two is a warning. Three or more is, in most pipelines, a strong negative predictor, and the useful rule is that the third push triggers a mandatory documented review rather than a silent date change. Make the push count a visible field on the opportunity so it shows up in the review without anyone having to dig through field history.
Ramp adjustment. New reps in their first two quarters deserve leniency of roughly 1.2x to 1.3x on top of standard thresholds. They are still learning to multi-thread, to ask disqualifying questions early, and to read when a buyer is being polite rather than interested. Force-killing a ramping rep's first pipeline is a fast way to make them defensive about data entry, which poisons the well permanently.
Seasonal adjustment. If your buyers have a budget cycle, your medians have a seasonal shape. Deals moving through a December approval queue take longer for reasons that have nothing to do with deal health. Either apply a modest seasonal multiplier during known-slow windows, or compute medians on a rolling trailing-twelve-months basis so the seasonality is baked in rather than fought.
Refresh cadence. Re-pull your medians quarterly from a trailing window of six to twelve months. Cycles drift as pricing changes, as you move upmarket, as procurement norms shift. Thresholds hard-coded two years ago describe a company that no longer exists. Put the refresh on a calendar with an owner's name on it, because this is exactly the maintenance task that silently stops happening.
Risks, edge cases, and failure modes

Reps gaming the clock. This is the first and most predictable failure. If time-in-stage triggers the flag, reps will bounce deals between stages to reset the counter. If inactivity triggers it, they will log a task. The countermeasures are structural, not disciplinary: track cumulative time across the whole opportunity as well as current-stage time, so a backward move doesn't erase history; require reciprocal activity rather than outbound activity to reset the inactivity clock; and enforce minimum stage durations so a same-day Discovery-to-Proposal jump is impossible. Also, watch for the reverse game — reps who avoid creating opportunities at all until late, keeping real deals off the board so nothing ages. That one destroys forecast visibility far worse than stale deals do, and it is usually caused by punishing aging too harshly.
Manager override theater. Late in a quarter, when coverage looks thin, there is enormous pressure to resurrect killed deals to fatten the number. If any manager can reopen an auto-closed opportunity, they will, and within a quarter the entire system means nothing. Put reopening at a level above the person accountable for the coverage number, require a written reason, and report reopen volume to leadership monthly. If reopens spike every quarter-end, you have found a culture problem that thresholds cannot fix.
Auto-close without a human in the loop. Fully automated closure feels clean and is usually a mistake. Buyers go quiet for legitimate reasons — parental leave, reorgs, a frozen budget that thaws in six weeks. A deal closed by a robot while the champion was out on medical leave is a real and recoverable relationship, but only if someone noticed. Require rep acknowledgment before closure, with a short window to object. The automation should make the kill the default outcome, not the instant one.
Long-cycle enterprise distortion. Deals involving heavy procurement, security questionnaires, or public-sector purchasing operate on timelines your standard thresholds will mangle. These need their own band with much wider tolerances, and often a different signal entirely: for a deal sitting in a client's security review, time-in-stage is meaningless, but "days since we last received a question from their security team" is highly informative. Where a stage is genuinely buyer-controlled, measure engagement, not elapsed time.

Product-led motions. If some of your opportunities originate from self-serve usage, their age distribution is likely bimodal — a cluster that converts fast and a long tail that never converts at all. A median computed across a bimodal distribution describes nothing real. Split those opportunities into their own dashboard with their own thresholds, or your blended numbers will be wrong in both directions simultaneously.
Partner and channel deals. When a partner owns the relationship, your activity data is structurally incomplete — real conversations are happening that never touch your CRM. Applying inactivity thresholds here produces constant false alarms. Either exclude partner-sourced opportunities from inactivity rules and rely on stage-age plus a scheduled partner check-in, or build a lightweight partner update field that resets the clock when the partner confirms movement.
Alert fatigue. The failure mode that kills more aging programs than gaming does. If a rep opens Monday to nineteen flags, they will triage none of them. Cap the review list — eight to ten deals is about the ceiling for a productive session — and rank by pipeline value so the biggest problems surface first. It is better to work five flags well than to publish forty and have them ignored.
Killing recoverable deals too fast. A meaningful fraction of closed-lost-no-decision opportunities do come back, often within two or three quarters when a budget frees up or the internal champion gets promoted. Aging thresholds should feed a nurture motion, not a shredder. Tag the closure reason, route the contact into a long-cycle nurture, and set a revisit date. When those deals return, give them a fresh clock but preserve the prior-kill history on the record so you can spot the pattern of accounts that always stall in the same place.
Tying aging to compensation. Some organizations withhold a slice of variable pay from reps whose stale-deal ratio exceeds a limit. It works, in the narrow sense that stale-deal ratios fall. It also creates a strong incentive to keep real opportunities out of the CRM until they are nearly closed. If you go this route, pair it with a countervailing measure on opportunity creation, and expect to spend real management attention policing the seam. For most teams, making aging visible in the review is sufficient and far less corrosive than putting money on it.
The measurement trap. Finally, be careful about declaring victory from the wrong evidence. Stale-deal percentage falling is not proof the system works — it could just mean reps got better at gaming. The honest validation metrics are forecast accuracy over a full cycle, the false-positive rate on red flags (deals you escalated that closed won anyway), and whether the same stage keeps producing stalls after you supposedly fixed it.
A practical rollout plan

Roll this out in phases. A big-bang launch with automated kills on day one will get reversed within a month, because the first time it closes a deal a rep cared about, you lose the room.
Phase one — audit the data, two weeks. Before anything else, verify that your stage-entry timestamps mean what you think. Sample opportunities across segments and check the history against reality. Fix or exclude records with imported or overwritten timestamps. Define, in writing, what counts as an activity that resets the inactivity clock, and confirm your CRM actually captures those events. This phase is unglamorous and it is where the whole program succeeds or fails.
Phase two — compute medians, one week. Pull twelve months of closed opportunities — won *and* lost, since a won-only median is optimistically biased — and compute median time-in-stage for each stage, split by segment. Use medians, not averages; a handful of eighteen-month monsters will wreck a mean. Publish the table so reps can see the reasoning. Transparency here converts "the system flagged my deal" into "my deal is running long, and here's the number."
Phase three — flag silently, one month. Turn on the calculations and the tagging, but tell nobody's deal to change. Watch the volume. If a third of the pipeline lights up red, your thresholds are wrong or your pipeline is worse than you thought — find out which before you go public. This shadow period is also when you catch the technical bugs, like a clock that resets on every field edit.
Phase four — surface in reviews, one quarter. Now make flags visible and build the ritual: a short weekly triage on the top flagged deals, forced decisions, documented outcomes. No automated closes yet. Let the team experience the discipline before you add the enforcement. Managers should be running this, with RevOps auditing that decisions actually get recorded rather than deferred.

Phase five — automate the tail, ongoing. Only once the ritual is habitual do you add automated tagging, escalation routing, and rep-acknowledged closure. Add the guardrails at the same time: minimum stage durations, close-date sanity limits, reopen approval at the right level, and reporting on override volume.
On tooling: you do not need to buy anything to start. Native automation in Salesforce, HubSpot, or Pipedrive covers tagging, task creation, and escalation routing, and a RevOps analyst can build the first version in an afternoon. A BI layer over a CRM export handles the reporting for a small team at effectively no incremental cost. Dedicated revenue-intelligence platforms add value once you want engagement signals pulled from email and calls rather than from manually logged activity — that is a genuinely different capability, since it removes the rep's ability to fake the inactivity clock — but buy it because you want that signal, not because you couldn't compute a median.
Finally, expect the thresholds themselves to be a living artifact. Assign an owner, calendar the quarterly refresh, and treat any stage where flags cluster as a process investigation rather than a rep problem. The aging system's real long-term value is not the deals it kills — it is the recurring, uncomfortable question it forces you to ask about why your buying process keeps stalling in the same place.
Related questions
What is the difference between time-in-stage and total opportunity age?
Time-in-stage measures how long a deal has sat in its current stage; total age measures the whole lifespan since creation. Stage-age catches sudden stalls, total-age catches slow bleeders that keep moving without progressing. Track both — each misses what the other catches.
Should aging thresholds automatically close deals?
Not without a human step. Automate the flag, the escalation, and the default outcome, but require rep acknowledgment before closure. Buyers go quiet for legitimate reasons, and a robot-closed deal with a live champion is an avoidable loss of a real relationship.
How often should thresholds be recalculated?

Quarterly, from a rolling six-to-twelve-month window of closed deals. Cycle times drift as pricing, segment mix, and buyer processes change. Hard-coded thresholds slowly describe a company you no longer are, and drift always shows up as either alert fatigue or silence.
Do aging thresholds work for renewals and expansions?
Only with different logic. A renewal open ninety days before its date is early, not stalled — measure against the renewal date rather than creation date. Expansions often track a customer's budget cycle, so anchor their clocks to that cycle instead of a generic median.
What if most of my pipeline trips the threshold immediately?
That is diagnostic information, not a configuration error to hide. Either your qualification is creating opportunities that were never real, or your stage medians were computed from won deals only. Check both before loosening thresholds — loosening to reduce noise just re-hides the problem.
FAQ
How do I stop reps from gaming the aging clock?
Make the metrics hard to fake structurally rather than policing them socially. Track cumulative time across the opportunity so moving backward doesn't reset history, require reciprocal activity — a reply, a held meeting, an inbound question — rather than outbound touches to reset the inactivity clock, and enforce minimum stage durations so a rep can't sprint a deal through three stages in an afternoon. Then watch for the opposite behavior: reps keeping real deals out of the CRM entirely. That's a sign the enforcement is too punitive.
Should aging thresholds be the same across all segments?
No, and blended thresholds are one of the most common reasons an aging program produces useless output. Enterprise deals with procurement and security review will trip any threshold calibrated on SMB velocity, while genuinely dead SMB deals sail under a threshold inflated by enterprise outliers. Compute separate medians by ACV band at minimum, and split further by product line or motion if those cycles differ materially. Cross-segment thresholds describe an average customer who doesn't exist.
What is the right number of deals to review in an aging triage?

Eight to ten is the practical ceiling for a focused session. Beyond that, attention collapses and the meeting turns into a list-reading exercise where nothing gets decided. Rank the flagged list by pipeline value and work the top of it; the smaller flagged deals will still be there next week, and if they never make the cut, that itself tells you their thresholds need tightening. A short review where every deal leaves with a dated decision beats a long one where forty deals get acknowledged.
How do I know whether the thresholds are actually improving anything?
Watch forecast accuracy across a full sales cycle, not stale-deal percentage across a month. Stale-deal counts can fall for the wrong reason — reps learned to game the clock. The more honest measures are the false-positive rate on escalated deals (how many red-flagged opportunities closed won anyway) and whether the same stage keeps generating stalls quarter after quarter. If red flags almost never close, the threshold is well-calibrated. If a fifth or more still close, tighten nothing until you understand why.
Can aging thresholds tell me something about my process, not just my reps?
Yes, and this is arguably their highest-value use. If stalls cluster at one stage across every rep and every segment, that is not a coaching problem — it is a broken step in your buying process. Common culprits are security reviews with no owner, pricing approvals requiring multiple signatures, or a legal redline queue with a single bottleneck. Aging data is the cheapest instrumentation you have for locating where time actually disappears, and fixing the chokepoint moves more revenue than any amount of individual deal-nagging.
Do I need a dedicated platform to run this?
Not to start. Native workflow tools in mainstream CRMs handle tagging, task creation, and escalation routing, and a BI dashboard over a CRM export covers the reporting. A RevOps analyst can stand up a working version in a day. Dedicated revenue-intelligence platforms become worth it when you want engagement signals derived automatically from email and calendar activity rather than from manually logged tasks — that genuinely removes a rep's ability to fake the inactivity clock. Buy for that capability, not for the ability to compute a median.
Sources
- Salesforce — Opportunity stage and sales process documentation: https://help.salesforce.com/s/articleView?id=sf.customize_oppstage.htm
- Salesforce Flow Builder documentation: https://help.salesforce.com/s/articleView?id=sf.flow_builder.htm
- HubSpot — Deal stages and pipeline management: https://knowledge.hubspot.com/deals/set-up-and-customize-your-deal-pipelines-and-deal-stages
- HubSpot — Workflow automation: https://knowledge.hubspot.com/workflows/create-workflows
- Pipedrive — Sales pipeline management resources: https://www.pipedrive.com/en/features/sales-pipeline
- Harvard Business Review — Sales pipeline and forecasting research: https://hbr.org/topic/subject/sales
- McKinsey & Company — B2B sales growth insights: https://www.mckinsey.com/capabilities/growth-marketing-and-sales/our-insights
- Gartner — Sales practice research and insights: https://www.gartner.com/en/sales
- Microsoft Dynamics 365 — Sales pipeline and forecasting documentation: https://learn.microsoft.com/en-us/dynamics365/sales/
Related on PULSE
- How should a 2027 deal desk set term-deviation thresholds?
- Can consolidated tech stacks actually shorten B2B sales cycles in 2027?
- How do we fix comp when we've created a monster—reps gaming deals, inflating pipelines, and sandbagging?
- What specific vendor consolidation triggers are causing RevOps to rebuild data pipelines mid-quarter?
- How does AI impact the cost-per-lead in enterprise B2B sales this year?
- What new skills do B2B sales reps need to handle AI-augmented buying committees?
This page will be disappearing soon. Save it to your device for $1 — or read it free while it is here.
@Kory-White- · if Venmo asks, the last 4 of my number are 2012
This page is gone.
This one is off the shelf now. $1 keeps it on your phone for good — the whole page, pictures and diagrams included.
 revopsHow do you do usage-data triggered outbound for PLG accounts in 2027?
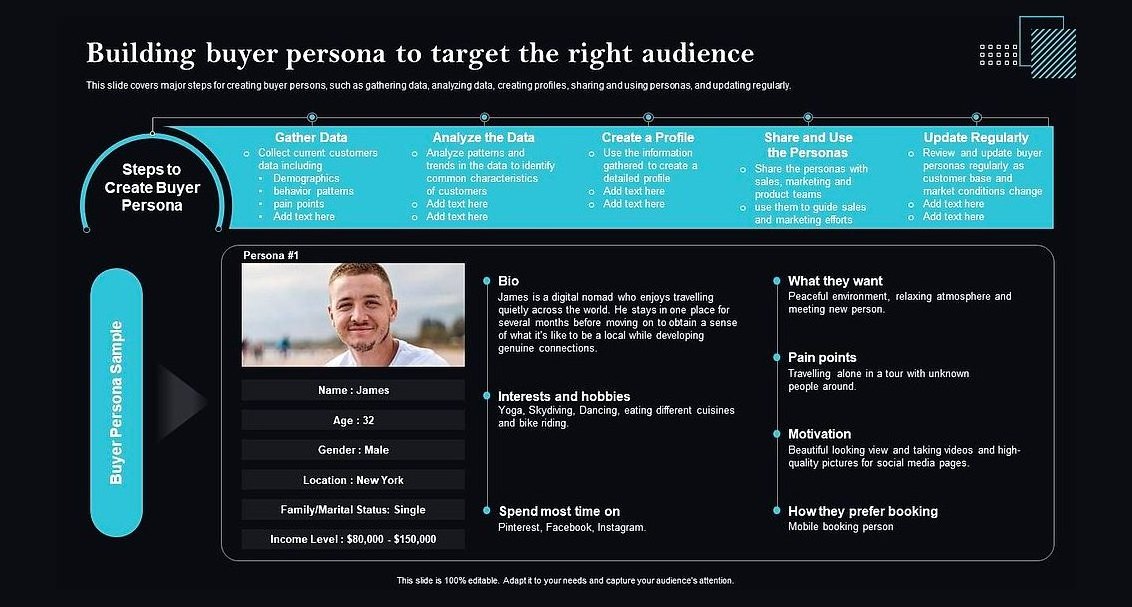 revopsHow do you build a buyer persona that sales actually uses in 2027?
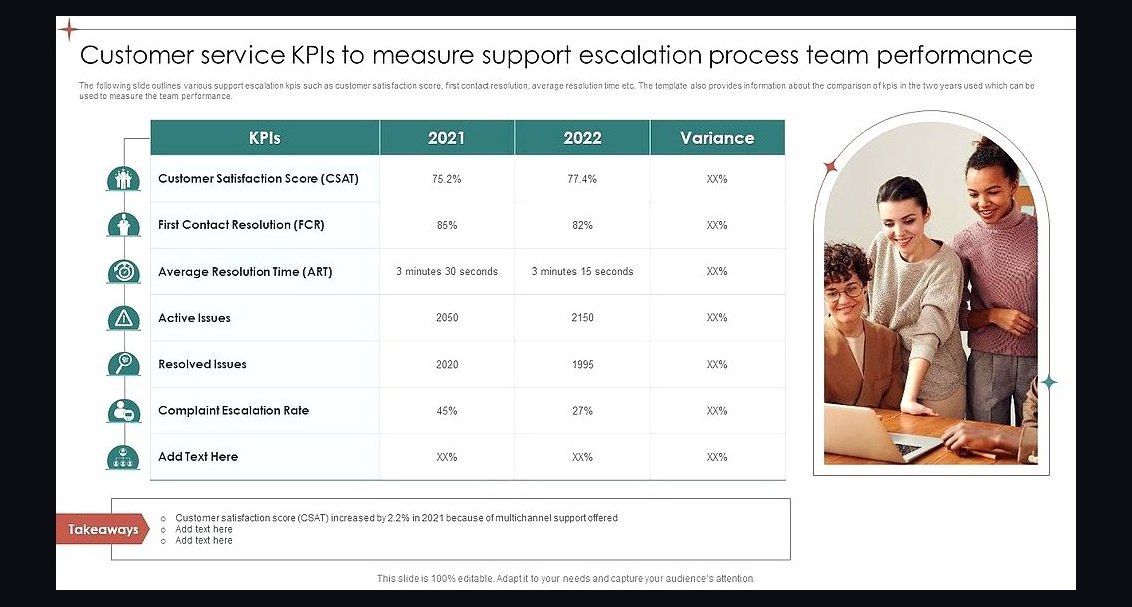 revopsHow should you handle mid-year comp plan resets without destroying trust in 2027?
 revopsHow do you operate sales during a system outage during end-of-quarter in 2027?
 revopsWhat are the basic qualifying criteria for a sales deal in 2027?
 revopsHow should a 2027 CRO and CEO align before a board meeting?
 revopsHow do you design a sales kickoff that changes behavior in 2027?
 revopsHow should a 2027 CS team attribute expansion vs save revenue?
 revopsWhat are Tennessee Volunteers men's basketball's 2027 NIL needs and strategy?
 revopsHow should a 2027 CS team respond to a coordinated customer revolt?