


What is pipeline coverage ratio and what is a healthy number in 2027?
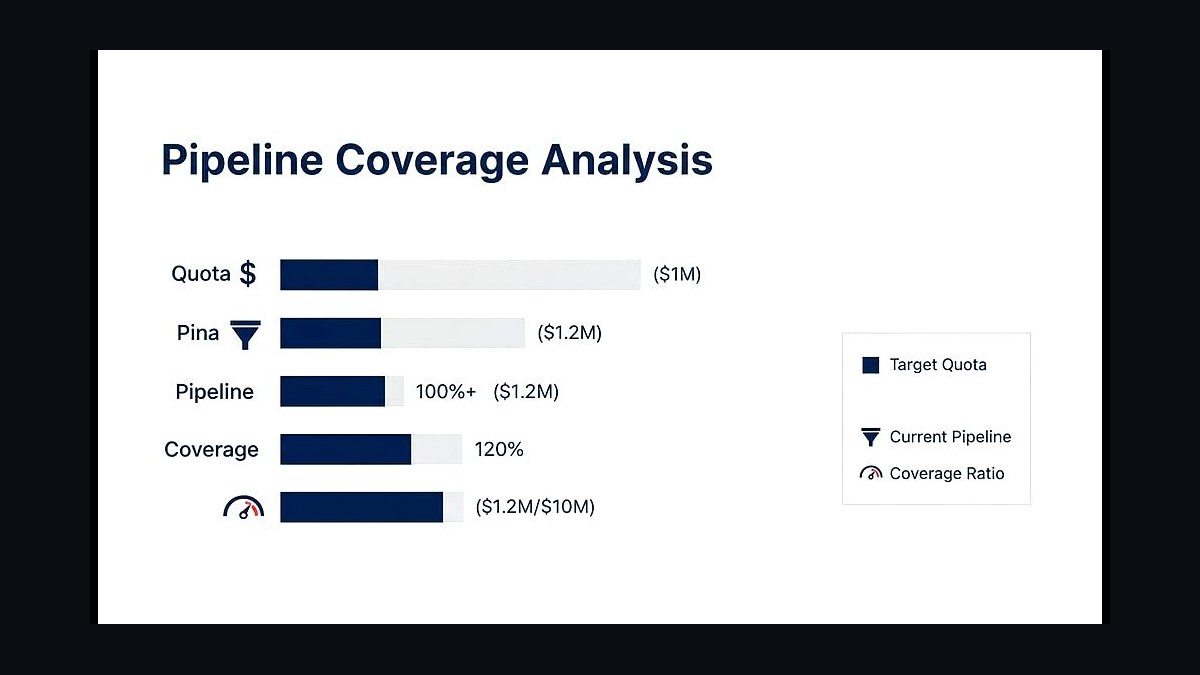
Pipeline coverage ratio is the dollar value of open pipeline divided by the quota you still need to close — and in 2027 the healthy number is not 3x. The current operator benchmark is 1 ÷ stage-weighted win rate, which usually lands at 3.0x for SMB, 3.5-4x for mid-market, and 5-6x for enterprise, measured at quarter start against the in-quarter gap-to-goal.
1The Definition Most Teams Get Wrong
1.1 The textbook formula
The textbook definition is Open Pipeline ÷ Quota Gap. If your team needs $4M of new ACV this quarter and has $14M of open opportunities with a close date in the quarter, coverage is 3.5x. That number alone tells you almost nothing — the denominator and the stage filter decide whether it's signal or fiction.
1.2 What "open pipeline" actually means in 2027
Per the Pavilion GTM Benchmarks 2026 and Clari's 2026 forecasting data, leading RevOps teams only count opportunities that have cleared Stage 2 qualification (typically MEDDPICC's Metrics + Economic Buyer identified) and have a close date inside the current quarter. Everything else — pipeline that slipped from last quarter, opportunities with no next-step date, deals owned by reps who are below 50% attainment — should be inspected separately or excluded.

1.3 The denominator decision
Most teams divide by full quota, which inflates coverage by counting closed-won deals against open pipeline. The correct denominator at any point in the quarter is gap-to-goal: quota minus closed-won minus committed-and-verbal. A team at week 6 of 13 with $1.4M closed against a $4M quota has a $2.6M gap, not a $4M target.
2The Real 2027 Benchmark Table
2.1 The win-rate-driven floor
The clean math is Required Coverage = 1 ÷ Stage-2+ Win Rate. Bridge Group's 2026 SaaS AE Report puts stage-2 win rates at 31% for SMB, 26% for mid-market, and 19% for enterprise — which produces the floors below.

2.2 Coverage by segment, 2027
- SMB / Velocity (sub-$25K ACV): 2.5-3.0x floor, target 3.0x at quarter start. Sales cycles 14-45 days, win rates 28-35%.
- Mid-Market ($25K-$150K ACV): 3.5-4.0x. Sales cycles 60-120 days, win rates 22-28% per RevOps Squared 2026.
- Enterprise ($150K-$750K ACV): 4.5-5.5x. Sales cycles 120-240 days, win rates 17-22%.
- Strategic / 7-figure: 6.0-8.0x. Sales cycles 240-540 days, win rates 10-15%.
- PLG-assist motions: 2.0-2.5x because product-qualified pipeline converts at 40-55% per OpenView 2026 PLG Index.
2.3 Why "3x is fine" is the most expensive myth in SaaS
Ebsta + Pavilion's 2026 B2B Sales Benchmark Report showed 87% of enterprise teams missed quarterly target in 2025, and the median team carrying 3.0x coverage at quarter start finished at 64% attainment. The reason is structural: enterprise win rates dropped 5.3 points between 2023 and 2026 (Gong Labs 2026), so a 3x ratio that worked in the Aaron Ross Predictable Revenue era is now 40% short of breakeven.

3The Five Coverage Variants Every CRO Should Track
3.1 Raw coverage
Total open pipeline ÷ gap-to-goal. Best for early-quarter pipeline-build conversations with marketing and SDR leadership.
3.2 Weighted coverage
Each opportunity multiplied by stage win probability (Stage 3 = 25%, Stage 4 = 50%, Stage 5 = 75% are common defaults). Weighted coverage of 1.0x means the math says you hit. Clari, Gong Forecast, and BoostUp all default to weighted coverage on the CRO dashboard.

3.3 Created-in-quarter coverage
Only opportunities created in the current quarter, divided by gap. This is the velocity-segment number; it separates net-new pipeline generation from carryover and tells you if marketing + SDR are pulling their weight.
3.4 Carryover coverage
Pipeline that rolled from a prior quarter. Force Management flags this as the single most over-counted bucket: a deal that has slipped twice has a real win rate of 6-9% per Gong Labs 2026, not the stage default of 50%.

3.5 Commit + Best Case coverage
Sum of all opportunities the rep has called Commit or Best Case ÷ gap. This is the forecast-call coverage number that goes on the board deck. Below 1.2x is a red flag.
4How to Build the Coverage Diagnostic
4.1 What the diagnostic surfaces
If raw coverage is healthy but weighted coverage is below 1.0x, the team has stage-stuffing — opportunities sitting in early stages that should be disqualified. If weighted coverage is healthy but commit coverage is below 1.2x, reps are under-calling and you have hidden upside. If both are short, you have a pipeline generation crisis and the lever is net-new opps, not deal acceleration.
5Real Operator Playbooks
5.1 The Datadog model (per Alexandre Pham, former VP RevOps)
Datadog measured 6x coverage at quarter start for enterprise and 3.5x for commercial. They tied SDR comp to stage-2-accepted opportunities, not meetings booked, which raised stage-2 win rates from 18% to 24% in four quarters.

5.2 The Snowflake / Frank Slootman discipline
In Amp It Up, Slootman describes inspecting every Stage 4+ deal weekly and demoting any opportunity without a verified Economic Buyer meeting in the last 14 days. Snowflake ran enterprise coverage at 5.0x but reported weighted coverage to the board — the harder number.
5.3 The Gong internal benchmark
Per Linda Lin (Gong Senior Director of Customer Success Strategy), Gong's own sellers carry 4.2x average coverage and the team has documented a 0.91 correlation between weighted coverage above 1.1x at week 4 and quarterly attainment above 100%.

5.4 The MongoDB enterprise approach
MongoDB enterprise runs 4.5-5.0x with a hard rule: any opp where MEDDPICC scoring is below 6/10 is removed from the coverage calculation regardless of stage. CRO Cedric Pech has discussed this on Pavilion CRO Roundtables.
6The Four Levers When Coverage Is Short
6.1 Pick one lever, not four
Per Pavilion CRO School curriculum, the most common mistake is pulling all four levers simultaneously. The right move is to diagnose the single biggest gap (usually volume in the first 30 days of a coverage crisis, then win rate after that) and invest 80% of the response there.

6.2 The 2-week measurement rule
Coverage moves slowly. Re-measure 14 days after any intervention. Any decision made on coverage data younger than 2 weeks is noise.
7The 2027 Macro Context
7.1 Why coverage requirements went up
Three forces pushed required coverage higher between 2024 and 2027: (1) enterprise sales cycles lengthened from a median 96 days to 134 days per Ebsta 2026, (2) average buying committee size grew from 6.8 to 11.2 per Gartner 2026 B2B Buying Survey, and (3) AI-driven SDR outbound saturated inboxes, dropping cold reply rates from 2.1% to 0.7% per Apollo's 2026 Outbound Report.

7.2 The AI forecasting overlay
Clari, Gong Forecast, BoostUp, Aviso, and Salesloft Forecast all now ship AI-weighted coverage that re-scores each opportunity using engagement signals (email reply velocity, multi-thread count, executive attendance). Operators report the AI-weighted number is typically 15-25% lower than the rep-called weighted number, and matches actual close rates within ±4% per Forrester Wave Q2 2026.
Why the 3x Rule Breaks in 2027
The old 3x pipeline coverage rule assumed linear, predictable sales cycles. By 2027, buyer behavior has shifted dramatically — deals stall more often, procurement cycles stretch, and multi-stakeholder approvals are the norm. A 3x ratio that worked in 2020 now leaves you exposed: if your win rate drops from 33% to 25% (common in enterprise), 3x coverage becomes a 0.75x effective ratio. Healthy coverage now accounts for deal slippage, not just win probability. Operators who still target 3x without adjusting for stage-weighted probability often find themselves 30-40% short of quota at quarter-end.

How to Calculate Your True Coverage Number
Stop using simple pipeline-to-quota ratios. Instead, multiply each deal’s value by its stage probability (e.g., 10% at prospecting, 40% at demo, 70% at negotiation). Sum these weighted values, then divide by your remaining quota. In 2027, a healthy weighted ratio is 1.5-2.0x for most B2B orgs. For example, if you need $500K and your weighted pipeline is $850K, you’re at 1.7x — solid for mid-market. Track this weekly, not monthly, because pipeline decays fast in the current buying environment.
Common Pitfalls That Inflate Coverage
Many teams overestimate healthy coverage by including stale deals (60+ days with no activity), unqualified leads, or opportunities with no champion. In 2027, the average deal decay rate is 15-20% per month. A pipeline that looks like 4x on paper might be 2x after removing dead weight. Also watch for “pipeline padding” — reps adding low-quality deals to hit coverage targets. Audit your pipeline monthly: remove any deal without a clear next step or budget confirmation. Healthy coverage is honest coverage.
FAQ
What exactly is pipeline coverage ratio? Pipeline coverage ratio is the total dollar value of your open sales pipeline divided by the remaining quota you need to close. It shows whether you have enough potential deals to hit your target, measured at the start of a quarter against the gap between what you’ve already closed and your full goal.
Why isn’t 3x the healthy number in 2027? A flat 3x rule ignores that different deal sizes and sales cycles have different win rates. The operator benchmark now uses 1 divided by your stage-weighted win rate, which naturally gives higher coverage for longer, more complex enterprise deals and lower coverage for faster SMB sales.
What are the healthy ranges for SMB, mid-market, and enterprise in 2027? For SMB, a healthy ratio is around 3.0x; for mid-market, it’s 3.5x to 4x; and for enterprise, it’s 5x to 6x. These ranges account for typical win rate differences—SMB deals close faster and more often, while enterprise deals need more pipeline to compensate for lower conversion.
How do I calculate my stage-weighted win rate? Multiply the dollar value of deals in each pipeline stage by the historical win percentage for that stage, then sum those values and divide by your total pipeline. This gives a more accurate coverage number than a simple overall win rate, because it reflects where deals actually are in the process.
Should I measure coverage at the start or end of the quarter? Always measure at quarter start against the in-quarter gap-to-goal. Checking coverage later in the quarter can be misleading, as deals may have already advanced or stalled. Early measurement gives you time to adjust activities if the pipeline is too thin.
Can a high pipeline coverage ratio ever be a bad sign? Yes, an excessively high ratio—like 10x or more—might indicate that your pipeline is full of low-quality, unlikely-to-close deals. It can also signal that your sales team is spending too much time on early-stage prospecting rather than advancing qualified opportunities. A healthy ratio balances quantity with realistic conversion expectations.
Bottom Line
Pipeline coverage ratio is the single most predictive metric for whether you hit the number this quarter — but only if you compute it correctly. Use gap-to-goal as the denominator, stage-2-qualified opportunities with in-quarter close dates as the numerator, and benchmark against 1 ÷ your segment's actual win rate rather than a generic 3x. In 2027 that means 3x for SMB, 4x for mid-market, 5x for enterprise, with a weighted commit floor of 1.2x going into any forecast call.
Related on PULSE
- What is pipeline coverage — and what's a healthy ratio?
- What does a healthy pipeline-to-quota ratio reveal about forecast reliability?
- What are healthy stage-to-stage conversion rates for SaaS sales in 2027?
- What is a healthy win rate by segment (SMB / Mid-Market / Enterprise) in 2027?
- What is CAC payback period and what is a healthy benchmark in 2027?
- What is NRR (Net Revenue Retention) and what is a healthy benchmark in 2027?
Sources
- Pavilion GTM Benchmarks 2026 — joinpavilion.com
- Bridge Group SaaS AE Compensation Report 2026
- Ebsta + Pavilion B2B Sales Benchmark Report 2026
- Clari 2026 Revenue Forecasting Trends Report
- Gong Labs 2026 Win Rate and Forecast Accuracy Studies
- OpenView 2026 PLG Index
- RevOps Squared 2026 Sales Velocity Benchmarks
- Force Management — Command of the Message methodology
- Gartner 2026 B2B Buying Behavior Survey
- Frank Slootman, "Amp It Up" (Snowflake operating playbook)
- Aaron Ross, "Predictable Revenue" (foundational SDR/pipeline framework)
- Forrester Wave: Revenue Operations and Intelligence, Q2 2026
This page will be disappearing soon. Save it to your device for $1 — or read it free while it is here.
@Kory-White- · if Venmo asks, the last 4 of my number are 2012
This page is gone.
This one is off the shelf now. $1 keeps it on your phone for good — the whole page, pictures and diagrams included.
 revopsHow should a 2027 sales and marketing team run joint forecasting?
 revopsHow should a 2027 RevOps team build an ICP scoring rubric?
 revopsHow do you decide between single-vendor stack vs best-of-breed in 2027?
 revopsHow do you compare quotas across sales segments in 2027?
 revopsHow should a 2027 RevOps team handle international forecast complexity?
 revopsWhat are Kansas Jayhawks men's basketball's 2027 NIL needs and strategy?
 revopsHow should a 2027 startup design compensation for the first AE?
 revopsHow do you design the PLG-to-sales handoff in 2027?
 revopsHow do you build a buyer persona that sales actually uses in 2027?
 revopsShould 2027 RevOps report to finance or to the CRO?