
How Do I Set Attach Rates for My Service Fees?
 Curated byKory White · Fractional CRO · Maryland
 PULSEKNOWLEDGE LIBRARY
Quality
Certified
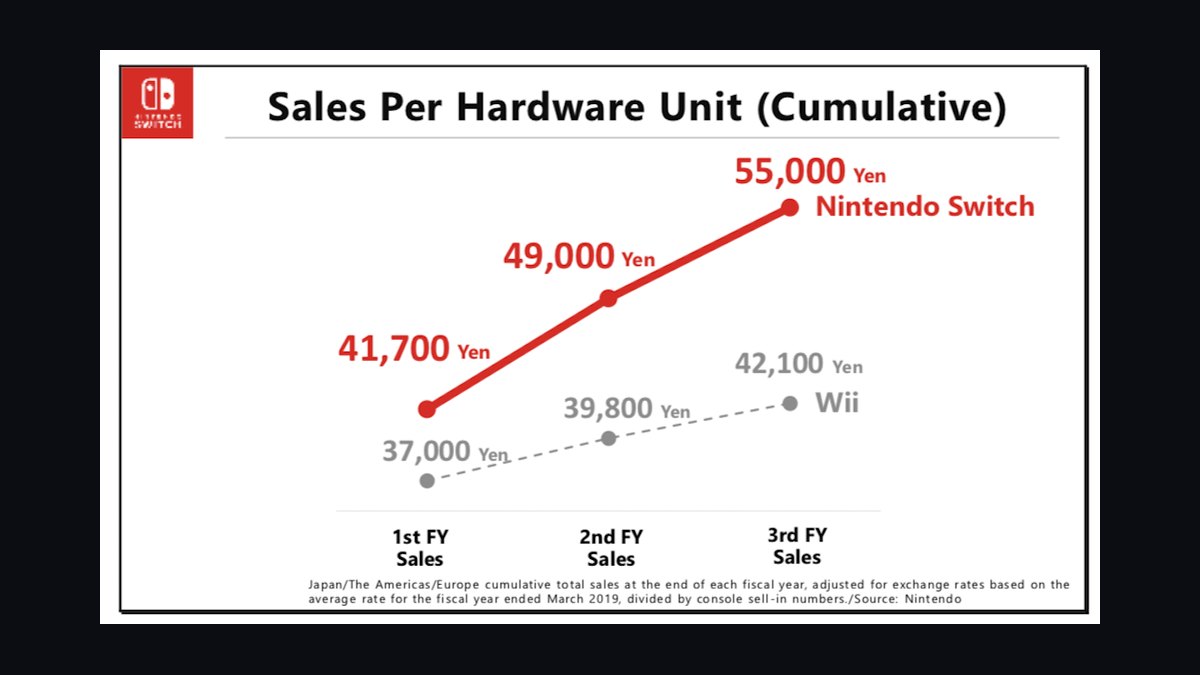
Set a target attach rate for your Service Fees as a dollar figure, then design the fee so it defaults on and carries tangible value. Attach Rate = orders with the fee ÷ total orders. Model revenue as fee amount × attach rate × monthly units. Opt-in fees typically attach at 25–45%; value-backed defaults reach 65–85%.
The outcome you should expect
When you set an Attach Rate deliberately rather than letting it drift, the payoff shows up in three places at once: fee revenue, contribution margin, and average ticket. The math is unforgiving in a useful way. A fee that attaches at 30% versus 70% is not a 40-point difference in effort — it is roughly a 2.3x difference in revenue from the same configuration, the same checkout, and the same customer base. That is why Attach Rates deserve to be a managed number in your RevOps dashboard, not a set-and-forget toggle buried in a billing admin panel.
Start with a concrete illustration. Suppose you run 2,000 orders a month at a $60 average ticket and you introduce a $4 "protection plus priority support" Service fee — about 6.7% of ticket, which sits inside the band where customers still perceive tangible value. At a soft 40% opt-in Attach Rate, that produces $4 × 0.40 × 2,000 = $3,200 per month. Move the same fee to a 75% Attach Rate by making it a pre-checked default tied to a real guarantee, and revenue becomes $4 × 0.75 × 2,000 = $6,000 per month. That is a $2,800 monthly gain from the Attach Rate alone, with no new products sold and no additional marketing spend.
Now layer in margin. Service Fees carry a low incremental cost to deliver because the infrastructure — support staff, replacement processing, priority routing — is largely already funded. If cost-to-deliver runs about 30% of fee revenue, then roughly $4,200 of that $6,000 flows to contribution margin each month. Annualized, that is over $50,000 of margin from a single configuration decision. For a business running thin retail or service margins, that is often the difference between funding a back-office hire or not.

The second-order outcomes matter too. A healthy Attach Rate lifts average ticket without discounting, which improves unit economics on every downstream calculation — customer acquisition payback, lifetime value, and channel profitability all shift. It also creates a natural upsell conversation at the point of sale, because the fee is attached to something the customer can name. And it gives your RevOps team a clean KPI that connects checkout design to the P&L, which is exactly the kind of bridge that makes operational changes fundable.
What you should not expect is a permanent number. Attach Rates decay. A fee that hits 75% in month one can slide to 55% by month six if the value story goes stale, if new staff stop explaining it, or if a competitor starts advertising "no hidden fees." Treat the Attach Rate as a living metric with an owner, a target, and a monthly review — the same discipline you would apply to conversion rate or churn.
What drives that outcome
The Attach Rate is not one lever; it is the product of four forces that compound or cancel each other. Understanding them separately is what lets you move the number on purpose.
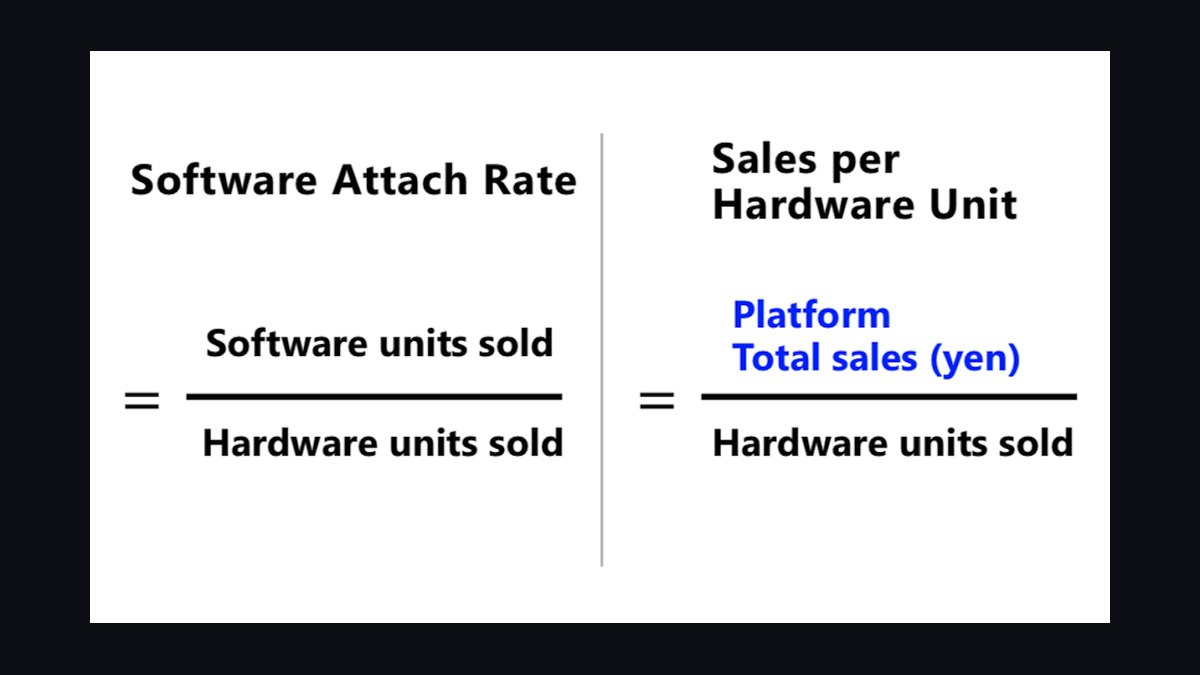
Default versus opt-in presentation. This is the single largest driver. An opt-in checkbox that starts unchecked signals "this is optional and probably not for you." A pre-checked default with a one-line explanation signals "this is part of the standard package." The behavioral gap is enormous — typically 25–45% attach for opt-in versus 65–85% for a value-backed default. The mechanism is not trickery; it is that defaults communicate a recommended configuration, and most customers accept the recommendation unless they have a reason to decline.
Tangibility of the deliverable. A fee named "service charge" attaches poorly because it describes nothing the customer receives. A fee named "protection plan — free replacement if it breaks" attaches well because it names a specific outcome. The rule that protects the number: the fee must be tangible and add real value. A default surcharge with no deliverable spikes refunds and chargebacks, and the Attach Rate collapses on the next billing cycle once customers learn to uncheck it.
Fee size relative to ticket. Attach Rates are relatively insensitive to fee size below about 5% of the average ticket, then fall off a cliff above roughly 10%. A $4 fee on a $60 order (6.7%) sits in the workable middle. The same $4 on a $20 order (20%) will struggle. Normalize by fee-to-ticket percentage whenever you compare Attach Rates across product lines or locations.
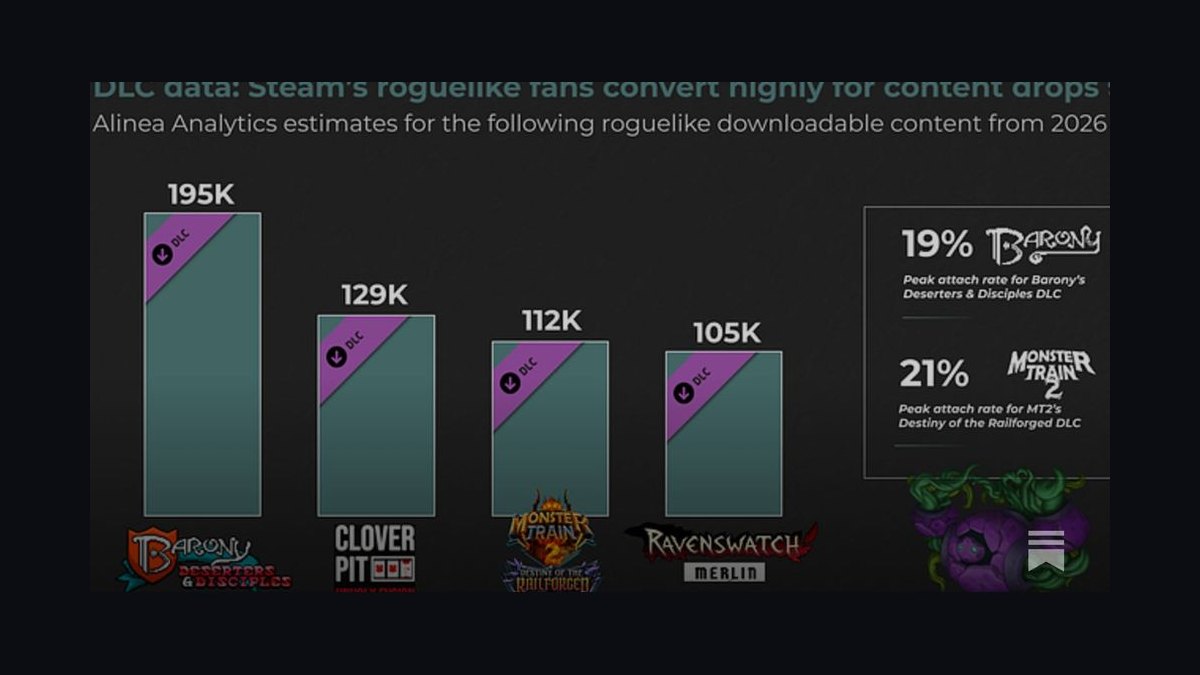
Friction in the checkout flow. Every additional click, scroll, or page between the customer and the fee reduces acceptance. A fee presented on the main checkout screen with a clear label outperforms the identical fee buried on a separate add-ons page by 15–30 percentage points in most tests. Placement is free to change and often the fastest lever available.
Notice the loop on the left side of that diagram. Most teams set a fee, measure once, and move on. The teams that hit 75%+ Attach Rates run the loop continuously — they treat a missed target as a signal to change framing or value, not as a reason to abandon the fee. The refund-and-chargeback check on the right is the guardrail: a rising Attach Rate paired with rising disputes means the fee is reading as junk, and the correct response is to strengthen the value or pull back the default, not to celebrate the number.
Benchmarks and realistic ranges
Benchmarks are useful only if you know which category you are in. The following ranges reflect common patterns across retail, restaurant, subscription, and field-service contexts. Treat them as starting expectations, not guarantees, and validate against your own first 90 days of data.

Opt-in fees: 25–45% attach. This is the natural range when the customer must actively choose the fee. If you are below 25%, the problem is usually visibility or value framing, not customer resistance. If you are above 45% with a true opt-in, you likely have a highly engaged customer base or a fee that is effectively mandatory in practice.
Value-backed default fees: 65–85% attach. This is the target band for a pre-checked fee with a named deliverable. Below 65% suggests the value story is weak or the checkout placement is poor. Above 85% is achievable but warrants a transparency check — if customers do not realize the fee is optional, you are borrowing revenue against future trust.
Warranty and protection plans: 30–50% attach. Protection products are a distinct category because the customer is buying a contingent benefit, not an immediate one. Consumer retail protection plans commonly attach in the 30–50% range when offered at the point of sale with a clear explanation of coverage. Pushing beyond that usually requires bundling the protection into a broader service package.
.jpg)
Restaurant auto-service-charges on defined segments: near 100%. When a service charge is auto-applied to a defined order type — large parties, delivery, catering — the Attach Rate is effectively 100% by design. This is not a benchmark to chase; it is a policy decision that should be disclosed clearly on the menu and the receipt.
Subscription add-on fees: 20–40% at launch, 40–60% after optimization. Recurring-revenue businesses often start lower because the add-on competes with the base plan for wallet share, then improve as packaging and messaging mature.
Fee-to-ticket sensitivity. For fees under 5% of the average ticket, Attach Rates often stay above 70%. Above 10% of ticket, Attach Rates can drop below 30%. Testing price points in the 3% to 8% range usually finds the best revenue balance — the point where fee revenue is maximized before acceptance falls faster than the price rises.
Time to stabilization. Expect the Attach Rate to move for the first 60–90 days after launch as staff learn the pitch and customers adjust. Review monthly for the first three months, then quarterly once it stabilizes. If you change the fee amount, the checkout flow, or the value description, check weekly for two weeks to see the impact.
.jpg)
Risks, edge cases, and failure modes
The failure modes for Service Fees are predictable, and most of them are self-inflicted. Knowing them in advance is cheaper than discovering them in a chargeback report.
The invisible-value failure. A fee that delivers nothing the customer can name will attach well for one or two cycles, then collapse as refunds and complaints accumulate. This is the most common and most expensive mistake. The fix is upstream: never launch a fee without a deliverable you can describe in one sentence.
The buried-option failure. A well-designed fee placed on a separate page or behind a collapsed accordion will underperform its potential by 15–30 points. Teams often conclude "customers don't want this" when the real problem is that customers never saw it. A/B test placement before concluding the fee is unpopular.
.jpg)
The over-attach failure. An Attach Rate above 90% on a nominally optional fee usually means one of two things: the fee is so small customers ignore it, or it is effectively mandatory without being disclosed as such. The second case is a regulatory and reputational risk. If a fee is mandatory, call it mandatory and disclose it clearly; do not present it as optional and default it on.
The comparison trap. Comparing Attach Rates across fees of different sizes produces false conclusions. A $5 fee on a $50 order and a $5 fee on a $500 order are not comparable products. Normalize by fee-to-ticket percentage before drawing any cross-business conclusion.
The seasonality blind spot. Seasonal businesses see Attach Rates move with mix. A fee that attaches at 70% in peak season may attach at 55% in the off-season because the customer mix shifts. Do not over-correct on a seasonal dip; compare like periods.
.jpg)
The staff-adherence failure. In point-of-sale environments, the Attach Rate is partly a function of whether staff explain the fee. New hires who were never trained on the pitch will drag the number down. Track Attach Rate by rep or by location to catch this early — it is one of the most actionable RevOps views you can build.
The refund-lag failure. Refund and chargeback data lags the sale by weeks. A fee that looks healthy in month one can show its true cost in month two. Always pair the Attach Rate with a refund rate and a dispute rate before declaring success.
A practical rollout plan
Rolling out a Service fee with a deliberate Attach Rate target is a four-phase process. Each phase has a clear exit criterion, which prevents the common mistake of launching broadly before the economics are proven.
.jpg)
Phase 1 — Model the target (week 1). Use a fee calculator or a simple spreadsheet to convert your Attach Rate goal into a dollar figure. Input monthly units, average ticket, fee amount, and target Attach Rate. Confirm the fee sits between 3% and 8% of the average ticket. Exit criterion: you can state the monthly fee revenue and contribution margin at your target Attach Rate, and you know what each percentage point of Attach Rate is worth.
Phase 2 — Design the offer (week 2). Name the deliverable in one sentence a customer would understand. Decide default versus opt-in. Write the one-line explanation that appears next to the checkbox. Choose the placement in the checkout or POS flow. Exit criterion: a colleague can read the offer and state what the customer gets.
Phase 3 — Instrument and pilot (weeks 3–6). Configure the fee in your billing or POS platform with Attach Rate reporting enabled. Run the pilot on a single segment, location, or product line. Measure Attach Rate weekly. Exit criterion: you have at least four weeks of Attach Rate data and a refund rate that is flat or falling.
.jpg)
Phase 4 — Scale and govern (week 7 onward). Roll out to the full base. Assign an owner for the Attach Rate KPI. Review monthly for three months, then quarterly. Re-test framing or placement whenever the rate drifts more than 10 points from target. Exit criterion: the Attach Rate is stable within your target band for two consecutive review periods.
Two details in that plan are easy to skip and expensive to omit. First, the pilot segment should be representative — if you pilot on your most loyal customers, you will overestimate the Attach Rate you can achieve broadly. Second, the KPI owner matters more than the dashboard. An unowned metric drifts; an owned metric gets reviewed, questioned, and improved. In most organizations the natural owner is a RevOps analyst or a finance partner who can connect the Attach Rate to the revenue plan.
One more broadening note: the same discipline applies beyond the checkout. If you sell through channel partners or distributors, the Attach Rate concept extends to how often partners include your Service Fees in their quotes. If you run a subscription business, it extends to add-on attach across renewal cohorts. The mechanics differ, but the core loop — set a target, make the fee tangible, default it where appropriate, measure acceptance, and watch refunds — holds across all of them.
Related questions
What is a realistic Attach Rate for a new Service fee?
A reasonable starting Attach Rate for a new opt-in fee is typically 20–40%. If the fee is presented as a pre-checked default with clear value, 60–80% within a few months is common. The exact number depends on how well you communicate the benefit and how seamlessly it fits the checkout flow.
How do I know if my Attach Rate is too low or too high?
Below 20% usually means customers do not see the fee's value or it is buried as an optional add-on. Above 90% on a nominally optional fee can mean the fee is effectively mandatory without disclosure, which is a trust risk. The healthy band is often 50–80%.
Does the Attach Rate change if I raise or lower the fee amount?
Yes, but not linearly. Fees under 5% of the average ticket often hold Attach Rates above 70%. Above 10% of ticket, Attach Rates can fall below 30%. Testing price points in the 3–8% range usually finds the best revenue balance.
How often should I review and adjust my Attach Rate?
Review monthly for the first three months after launch, then quarterly once it stabilizes. If you change the fee amount, checkout flow, or value description, check weekly for two weeks. Seasonal businesses may need to adjust more frequently during peak periods.
Can I compare Attach Rates across different Service Fees?
Only if the fees are similar in size relative to order value and the customer segments are comparable. Normalize by fee-to-ticket percentage — a 5% fee and a 1% fee will behave differently even at the same dollar amount.
FAQ
What is the fastest way to improve a low Attach Rate without changing the fee amount? Make the fee a pre-checked default at checkout, bundle it with a clear guarantee such as free replacement or priority support, and explain the benefit in one sentence next to the checkbox. A/B test the wording and placement — moving it from a separate page to the main checkout screen can lift Attach Rates by 15 to 30 percentage points within weeks.
Should Service Fees always be defaulted on? No. Defaulting works when the fee carries a tangible deliverable and the customer can still decline. If the fee is genuinely mandatory, disclose it as mandatory rather than presenting it as an optional default. Defaulting a low-value fee on without disclosure produces refunds, chargebacks, and reputational damage that outweigh the short-term revenue.
How do I attribute Attach Rate performance to specific reps or locations? Configure your POS or billing platform to record the fee at the transaction level with a rep or location identifier. Then report Attach Rate by that dimension weekly. This is one of the highest-value RevOps views for service businesses because it separates a pricing problem from a training problem.
What role does RevOps play in managing Attach Rates? RevOps owns the instrumentation and the KPI. That means ensuring the fee is configured correctly in the billing or POS system, that Attach Rate is reported natively rather than back-calculated, that the metric has an owner and a review cadence, and that changes to checkout design or pricing are tested rather than assumed.
Do Attach Rates apply to B2B service contracts? Yes, though the mechanics differ. In B2B, the equivalent is how often a service line item is included in a quote or contract. The same principles apply: make the service tangible, present it as part of the standard package where appropriate, and measure inclusion rate by rep, segment, and deal size.
What is the biggest mistake teams make when setting Attach Rate targets? Setting the target as a percentage without converting it to a dollar figure. A 70% Attach Rate means nothing until you know it represents $6,000 a month versus $3,200. Convert the target to revenue and margin before you commit to it, and you will make better trade-offs about fee size and presentation.
Sources
- Stripe — Billing pricing and revenue-based plan documentation, https://stripe.com/billing/pricing
- Shopify — plan pricing and checkout extensibility documentation, https://www.shopify.com/pricing
- Square — POS pricing and service-charge configuration guides, https://squareup.com/us/en/payments
- Toast — restaurant POS pricing and auto-service-charge documentation, https://pos.toasttab.com
- Recurly — subscription billing and add-on reporting documentation, https://recurly.com
- Chargebee — subscription management and pricing experimentation documentation, https://www.chargebee.com
- Maxio — billing and revenue analytics product documentation, https://www.maxio.com
- Housecall Pro — field-service pricing and membership-plan documentation, https://www.housecallpro.com
- Clover — service fee and app marketplace documentation, https://www.clover.com
Related on PULSE
- [How Do I Get My Convenience Store Staff to Attach Food Service?](/knowledge/q15858)
- [How Do I Track Service-Fee Attach Rate by Rep?](/knowledge/q16164)
- [How Do I Get My Reps to Attach Services to Product Deals?](/knowledge/q16054)
- [How Do I Get My QSR Crew to Upsize and Attach Items?](/knowledge/q15853)
- [How Do I Get My Shoe Store Staff to Attach Socks and Care Kits?](/knowledge/q15848)
- [How Do I Get My Cell Phone Store Reps to Attach Accessories?](/knowledge/q15829)
This page will be disappearing soon. Save it to your device for $1 — or read it free while it is here.
@Kory-White- · if Venmo asks, the last 4 of my number are 2012
This page is gone.
This one is off the shelf now. $1 keeps it on your phone for good — the whole page, pictures and diagrams included.
 pulse-qShould I Hire a Fractional CRO If I Have No RevOps Function Yet?
 pulse-qHow Do I Score My CSMs on Retention and Expansion?
 pulse-qShould I Hire a Fractional CRO If I Am Replacing a CRO Who Failed?
 pulse-qShould I Hire a Fractional CRO If I Am Losing Deals to a Cheaper Competitor?
 pulse-qHow Many Sales Reps Do I Need to Hire for My Equipment Rental Company?
 pulse-qHow Do I Get My Distributors to Push the Full Catalog?
 pulse-qHow Many Sales Reps Do I Need to Hire for My Behavioral Health Company?
 pulse-qShould I Repair or Replace My Delivery Fleet Vehicles as My Landscaping Business Scales in 2027?
 pulse-qHow Many Employees Should I Schedule Each Shift at My Roller Rink?
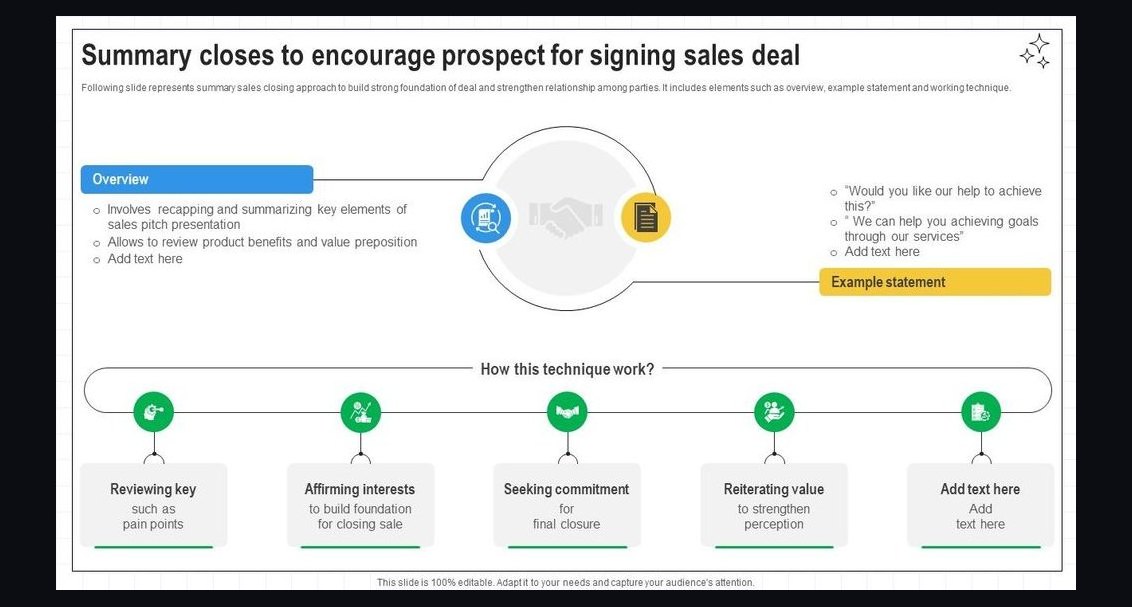 pulse-qTop 10 Closing Coaching Techniques for Mid-Market Reps in 2027