


What is the most reliable leading indicator that a B2B pipeline is about to weaken in 2027?
Quality
Certified

The most reliable leading indicator that a B2B pipeline is about to weaken in 2027 is deal-stage velocity decay — a sustained slowdown in how fast qualified opportunities move between stages, especially in the middle of the funnel. It predicts revenue softness earlier than pipeline coverage or win rate because it captures buyer hesitation while deals are still technically "open." When velocity slips two or three quarters before bookings fall, you still have time to act.
Coverage ratios and forecast dollars tell you what the pipeline looks like today; velocity tells you what it will look like next quarter. In a 2027 buying environment shaped by larger buying committees, tighter budget scrutiny, and AI-assisted vendor research, the earliest crack is almost never a missing deal — it is a deal that stops progressing. This essay explains why velocity decay outperforms the usual metrics, how to instrument it, and which secondary signals confirm or contradict it.
Why is deal-stage velocity the earliest signal of pipeline weakness?
A pipeline weakens from the inside out. By the time coverage ratio drops or win rate falls, the damage is already booked — those metrics are lagging confirmations of a problem that started weeks or months earlier. Velocity decay, by contrast, shows up while opportunities are still open and still counted as healthy pipeline. That gap between "looks fine on the board" and "actually stalling" is exactly the early-warning window operators want.
The mechanism is behavioral. When macro conditions tighten or a competitor shifts the market, buyers do not immediately say no. They slow down: they add a stakeholder, request another review, push a decision to the next budget cycle, or go quiet between stages. Each of those behaviors extends stage duration before it ever touches your win/loss record. Aggregate that across a cohort of deals and you get a measurable deceleration — a leading indicator that predicts the coverage and bookings decline that follows. RevOps teams that track pipeline velocity as a system-level metric consistently catch softness a full quarter ahead of teams that watch coverage alone.

Velocity also has a signal-to-noise advantage. A single slipped deal is anecdote; a shift in median time-in-stage across dozens of active opportunities is signal. Because velocity is computed continuously over open deals rather than at close, it updates weekly instead of quarterly, giving you a far denser stream of evidence than any close-based metric can.
How do you measure velocity decay without fooling yourself?
Velocity is deceptively easy to define and easy to compute badly. The core formula multiplies the number of qualified opportunities by average deal value and win rate, then divides by average sales-cycle length. But for early warning you should not watch the blended output — you should watch its components separately, and you should watch time-in-stage per stage, not just total cycle length. A blended number can stay flat while a specific stage rots underneath it.
The most common self-deception is survivorship bias. If you only measure cycle length on deals that closed-won, you systematically exclude the slow deals that stalled out or died, which makes velocity look artificially healthy right up until bookings collapse. The fix is to measure stage duration across *all* open opportunities in a cohort, including the ones sitting untouched — the stalled deals are the signal, not noise to be filtered out. Teams that instrument this correctly track a cohort-based sales-cycle analysis rather than a single rolling average.

Three instrumentation rules keep the metric honest. First, segment before you aggregate — new-business, expansion, and channel deals decay at different rates, and blending them masks the segment that is actually failing. Second, use the median, not the mean, because a few mega-deals with long cycles will drag a mean around and hide the middle of your funnel. Third, anchor every stage change to a timestamped, exit-criteria-based definition so "moved to proposal" means the same thing in Q1 and Q4; drifting stage definitions produce phantom velocity swings that have nothing to do with buyer behavior.
What secondary signals confirm that velocity decay is real?
No single metric should trigger a pipeline alarm on its own. Velocity decay is the earliest signal, but it needs corroboration to separate a genuine market shift from a seasonal lull or a one-quarter data artifact. The strongest confirming indicator is a change in buyer engagement intensity — meeting acceptance rates, multithreading depth (how many stakeholders are active on a deal), and response latency to your team's outreach. When velocity slows *and* engagement thins at the same time, the weakening is almost certainly real.
Stage-conversion rates are the second confirmation. If deals are both moving slower and converting at a lower rate from one specific stage to the next, you have located the exact point of friction — often the transition into procurement or into a formal business-case review, where 2027 budget scrutiny concentrates. A drop in middle-of-funnel conversion that coincides with lengthening time-in-stage is a much higher-confidence warning than either metric alone.

The third confirming layer is qualitative but structured: loss-reason and no-decision coding. A rising share of "no decision / budget frozen / revisit next cycle" outcomes — as opposed to competitive losses — tells you the weakness is demand-side, not execution-side. Competitive losses point at your positioning; no-decisions point at the market, and the market is what a leading indicator is supposed to forecast. When all three secondary signals move together with velocity, treat it as a confirmed downturn and escalate to intervention rather than continued observation.
Which metrics are commonly mistaken for the best leading indicator?
Several popular metrics feel like early warnings but actually lag or mislead. Pipeline coverage ratio — total open pipeline divided by quota — is the most over-trusted. It looks forward, but it is trivially inflated by stale deals, optimistic close dates, and low-quality opportunities that will never convert. A 4x coverage ratio stuffed with decaying deals is more dangerous than a 3x ratio moving briskly, because coverage rewards volume and ignores motion. Coverage is a useful sanity check, not a leading indicator.
Win rate is a genuine performance metric but a poor early-warning tool, because it is only known at close. By the time win rate declines, the deals that softened months earlier have already resolved. It confirms a downturn; it cannot forecast one. Similarly, total bookings or revenue is the ultimate lagging indicator — it is the thing every leading indicator is trying to predict, so watching it for early warning is circular.

Top-of-funnel volume (leads, MQLs, demo requests) is worth monitoring, but it forecasts weakness one to two quarters further out than velocity and with far more noise. A dip in lead volume may or may not reach revenue depending on conversion, whereas velocity decay is measured on deals that are already qualified and already in the pipeline — much closer to the money and therefore a tighter predictor. The practical hierarchy: top-of-funnel gives you the longest lead time but the weakest signal, velocity gives you the best balance of timeliness and reliability, and win rate plus bookings confirm what already happened.
How should teams operationalize velocity as an early-warning system in 2027?
Turning velocity from a report into an alarm requires three things: a baseline, a threshold, and an owner. The baseline is a trailing multi-quarter median of time-in-stage per segment — you cannot detect decay without knowing what normal looks like. The threshold is a defined deviation (for example, a sustained rise in median stage duration across two consecutive measurement periods) that automatically flags a segment for review rather than waiting for a human to notice. Without a pre-committed threshold, velocity decay gets rationalized away in the moment as "just a slow month."
The owner matters because velocity sits between marketing, sales, and finance, and orphaned metrics get ignored. In 2027, RevOps is the natural home: the team already owns the CRM stage definitions, the data hygiene, and the cross-functional forecast. Assigning velocity monitoring to RevOps — with a standing weekly review and a documented escalation path — is what converts a nice chart into a decision that changes rep behavior, reallocates marketing spend, or resets forecast expectations before the board hears about it.
Finally, instrument the *response*, not just the detection. When velocity decay is confirmed, the highest-leverage moves are usually re-qualifying stalled deals honestly (pulling dead pipeline out inflates nothing and clarifies the real picture), concentrating rep effort on multithreaded deals with live engagement, and feeding the demand-side signal back to marketing so top-of-funnel targeting shifts before the next cohort inherits the same problem. A leading indicator is only valuable if it triggers action early enough to matter — and velocity's whole advantage is the quarter of runway it buys you.
Related questions

Is pipeline coverage ratio a leading or lagging indicator?
It is a weak forward-looking metric, not a true leading indicator. Coverage inflates easily with stale and low-quality deals, so it can look healthy while the pipeline is quietly decaying. Use it as a sanity check alongside velocity, never alone.
How far ahead can velocity decay predict a downturn?
Typically one to two quarters of lead time, because it is measured on open deals that are still moving. That is earlier than win rate or bookings and closer to revenue than top-of-funnel lead volume, giving the best balance of timeliness and reliability.
Does AI-assisted buyer research change pipeline signals in 2027?
Yes. Buyers arrive later and more informed, compressing early stages but extending evaluation and procurement. That shifts where decay shows up — watch middle-of-funnel time-in-stage rather than discovery, since that is where 2027 hesitation concentrates.
What's the difference between velocity decay and seasonality?
Seasonality is predictable and repeats on a calendar; velocity decay persists across periods and appears alongside thinning engagement and rising no-decision losses. Comparing against a same-period prior-year baseline separates a normal lull from a genuine structural weakening.
Should velocity be tracked per rep or per segment?

Per segment first, then per rep for diagnosis. Segment-level decay tells you the market is shifting; rep-level decay usually points at execution or coaching. Confusing the two leads to fixing people when the problem is demand, or vice versa.
FAQ
What exactly is pipeline velocity? Pipeline velocity measures how quickly value moves through your funnel, typically as the number of qualified opportunities times average deal value times win rate, divided by average sales-cycle length. For early warning, watch the components — especially time-in-stage — separately rather than the blended output, which can stay flat while one stage rots.
Why is velocity better than win rate for early warning? Win rate is only known when a deal closes, so it confirms a downturn after it has already happened. Velocity is computed continuously across open deals, updating weekly instead of quarterly, which surfaces buyer hesitation while there is still time to intervene.
How much velocity change should trigger an alarm? There is no universal number — set a threshold relative to your own trailing multi-quarter baseline, segmented by deal type. A sustained rise in median time-in-stage across two consecutive measurement periods is a reasonable default trigger. The key is committing to the threshold in advance so decay is not rationalized away in the moment.
Can velocity decay give false positives?

Yes, which is why it needs corroboration. Seasonal lulls, a large deal skewing a mean, or a stage-definition change can all mimic decay. Use medians, segment before aggregating, and require confirming signals — thinning engagement, falling stage conversion, rising no-decision losses — before escalating.
Does deal quality affect velocity readings? Significantly. Low-quality opportunities that will never convert inflate pipeline and distort cycle-length averages. Rigorous, exit-criteria-based qualification keeps velocity honest; a pipeline padded with dead deals will show misleading velocity right up until bookings fall.
Which teams should own velocity monitoring? RevOps is the natural owner because it controls CRM stage definitions, data hygiene, and the cross-functional forecast. A standing weekly review with a documented escalation path turns the metric from a passive chart into a decision that changes rep focus, marketing targeting, or forecast expectations.
How does 2027's buying environment change the picture? Larger buying committees, tighter budget scrutiny, and AI-assisted vendor research push hesitation into the middle and late funnel — evaluation and procurement — rather than discovery. That makes middle-of-funnel time-in-stage the most informative place to watch for decay in 2027.
What actions follow a confirmed velocity decline? Re-qualify and honestly clear stalled deals, concentrate rep effort on multithreaded opportunities with live engagement, and feed the demand-side signal back to marketing so the next cohort does not inherit the same weakness. Detection only pays off if it triggers action within the lead-time window it buys you.
Sources
- Harvard Business Review — The B2B Elements of Value
- Gartner — The New B2B Buying Journey
- McKinsey & Company — The Future of B2B Sales
- Forrester — B2B Buyer and Revenue Research
- MIT Sloan Management Review — Sales and Revenue Analytics
- CSO Insights / Korn Ferry — Sales Performance Research
- Harvard Business Review — Kraljic and Purchasing Portfolio Analysis
- Salesforce Research — State of Sales
Related on PULSE
- What's a good leading indicator that pipeline is about to weaken?
- How should RevOps teams think about governance philosophy as a leading indicator of go-to-market maturity and expansion readiness, separate from operational compliance requirements?
- Why do most vendors get pricing exception chaos wrong for event-sourced pipeline RevOps teams using HubSpot ?
- What product-usage signals most reliably predict 6-month churn in B2B SaaS?
- What's the most underrated discovery question in B2B SaaS?
- What's the most reliable way to predict end-of-quarter shortfall?
This page will be disappearing soon. Save it to your device for $1 — or read it free while it is here.
@Kory-White- · if Venmo asks, the last 4 of my number are 2012
This page is gone.
This one is off the shelf now. $1 keeps it on your phone for good — the whole page, pictures and diagrams included.
 revopsWhy are 2027 sales cycles for enterprise deals averaging 9 months despite AI-powered pipeline acceleration?
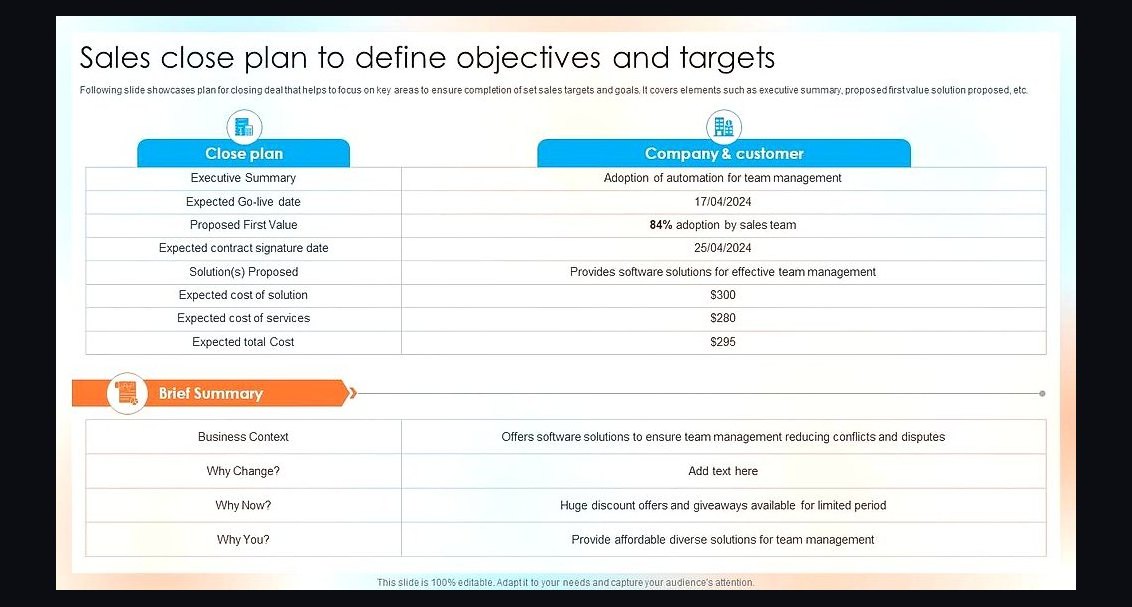 revopsWhat is the most effective 2027 close plan for a deal stalled by a committee’s AI risk simulator?
 revopsWhat specific metrics prove that AI-driven lead scoring reduces sales cycles by 40% in 2027?
 revopsHow Do I Deploy AI SDRs and Autonomous Outbound Agents Safely in 2027?
 revopsHow do prediction markets like Kalshi and Polymarket work in 2027?
 revopsHow do you measure speed-to-lead and why does it still decide win rate in 2027?
 revopsHow is AI Redefining Lead Scoring Accuracy for B2B Buying Committees in 2027?
 revopsWhat are the top three AI-driven signals that a buying committee in 2027 is actually ready to close versus just researching?
 revopsWhat new revenue leakages emerge when vendor consolidation forces sales teams to retrain on unified platforms mid-cycle in 2027?
 revopsHow Do I Rationalize and Consolidate My RevOps Tech Stack in 2027?