
How do we know if Clari forecasting is actually more accurate, or just more confident?

Brief

Clari accuracy (96%+ MAPE claims) is real, but only on closed opportunities. Forecast confidence is a different metric. Compare trailing 4-quarter MAPE (not current quarter) against your own pre-Clari baseline to know if the lift is real.
Detail
Clari's strength and limitation both stem from its approach: it learns from closed deals you already have, not from pipeline you do not yet understand. That is powerful and constraining at the same time. The prior question of *whether you even need a dedicated forecasting tool yet* versus native CRM reporting is covered in (q108); this entry assumes you have already decided to evaluate Clari and now want to pressure-test its accuracy claim.
What Clari Actually Measures
- Claim: 96% forecast accuracy at maturity, expressed as MAPE (Mean Absolute Percentage Error) of roughly 4-8%. Source: Clari's own published customer benchmarks and Forrester's commissioned Total Economic Impact (TEI) study of Clari, which documents forecast-accuracy gains for mature deployments.
- Translation: on $1M forecasted, actual close lands $960k-$1.04M within the committed 30-day window.
- Data source: closed-opportunity patterns plus deal-momentum signals (conversation velocity, executive engagement, legal-review status), per Clari product documentation.
- Cost: $2,000-$8,000/month depending on seat count and data depth, consistent with public G2 and Vendr pricing ranges (roughly $1,080-$1,800 per seat per year for revenue-intelligence platforms).
- One blind spot worth naming: Clari forecasts the *new-business* number well but treats expansion and net-new as one stream unless configured otherwise. Splitting those for forecasting is its own discipline, covered in (q102).
Accuracy vs. Confidence Trap
- Accuracy = forecast divided by actual close (lagging; Clari needs ~4 quarters of historical truth before this stabilizes).
- Confidence = Clari's internal probability score (leading; typically 60-80% correlated with realized win rates, not 1:1).
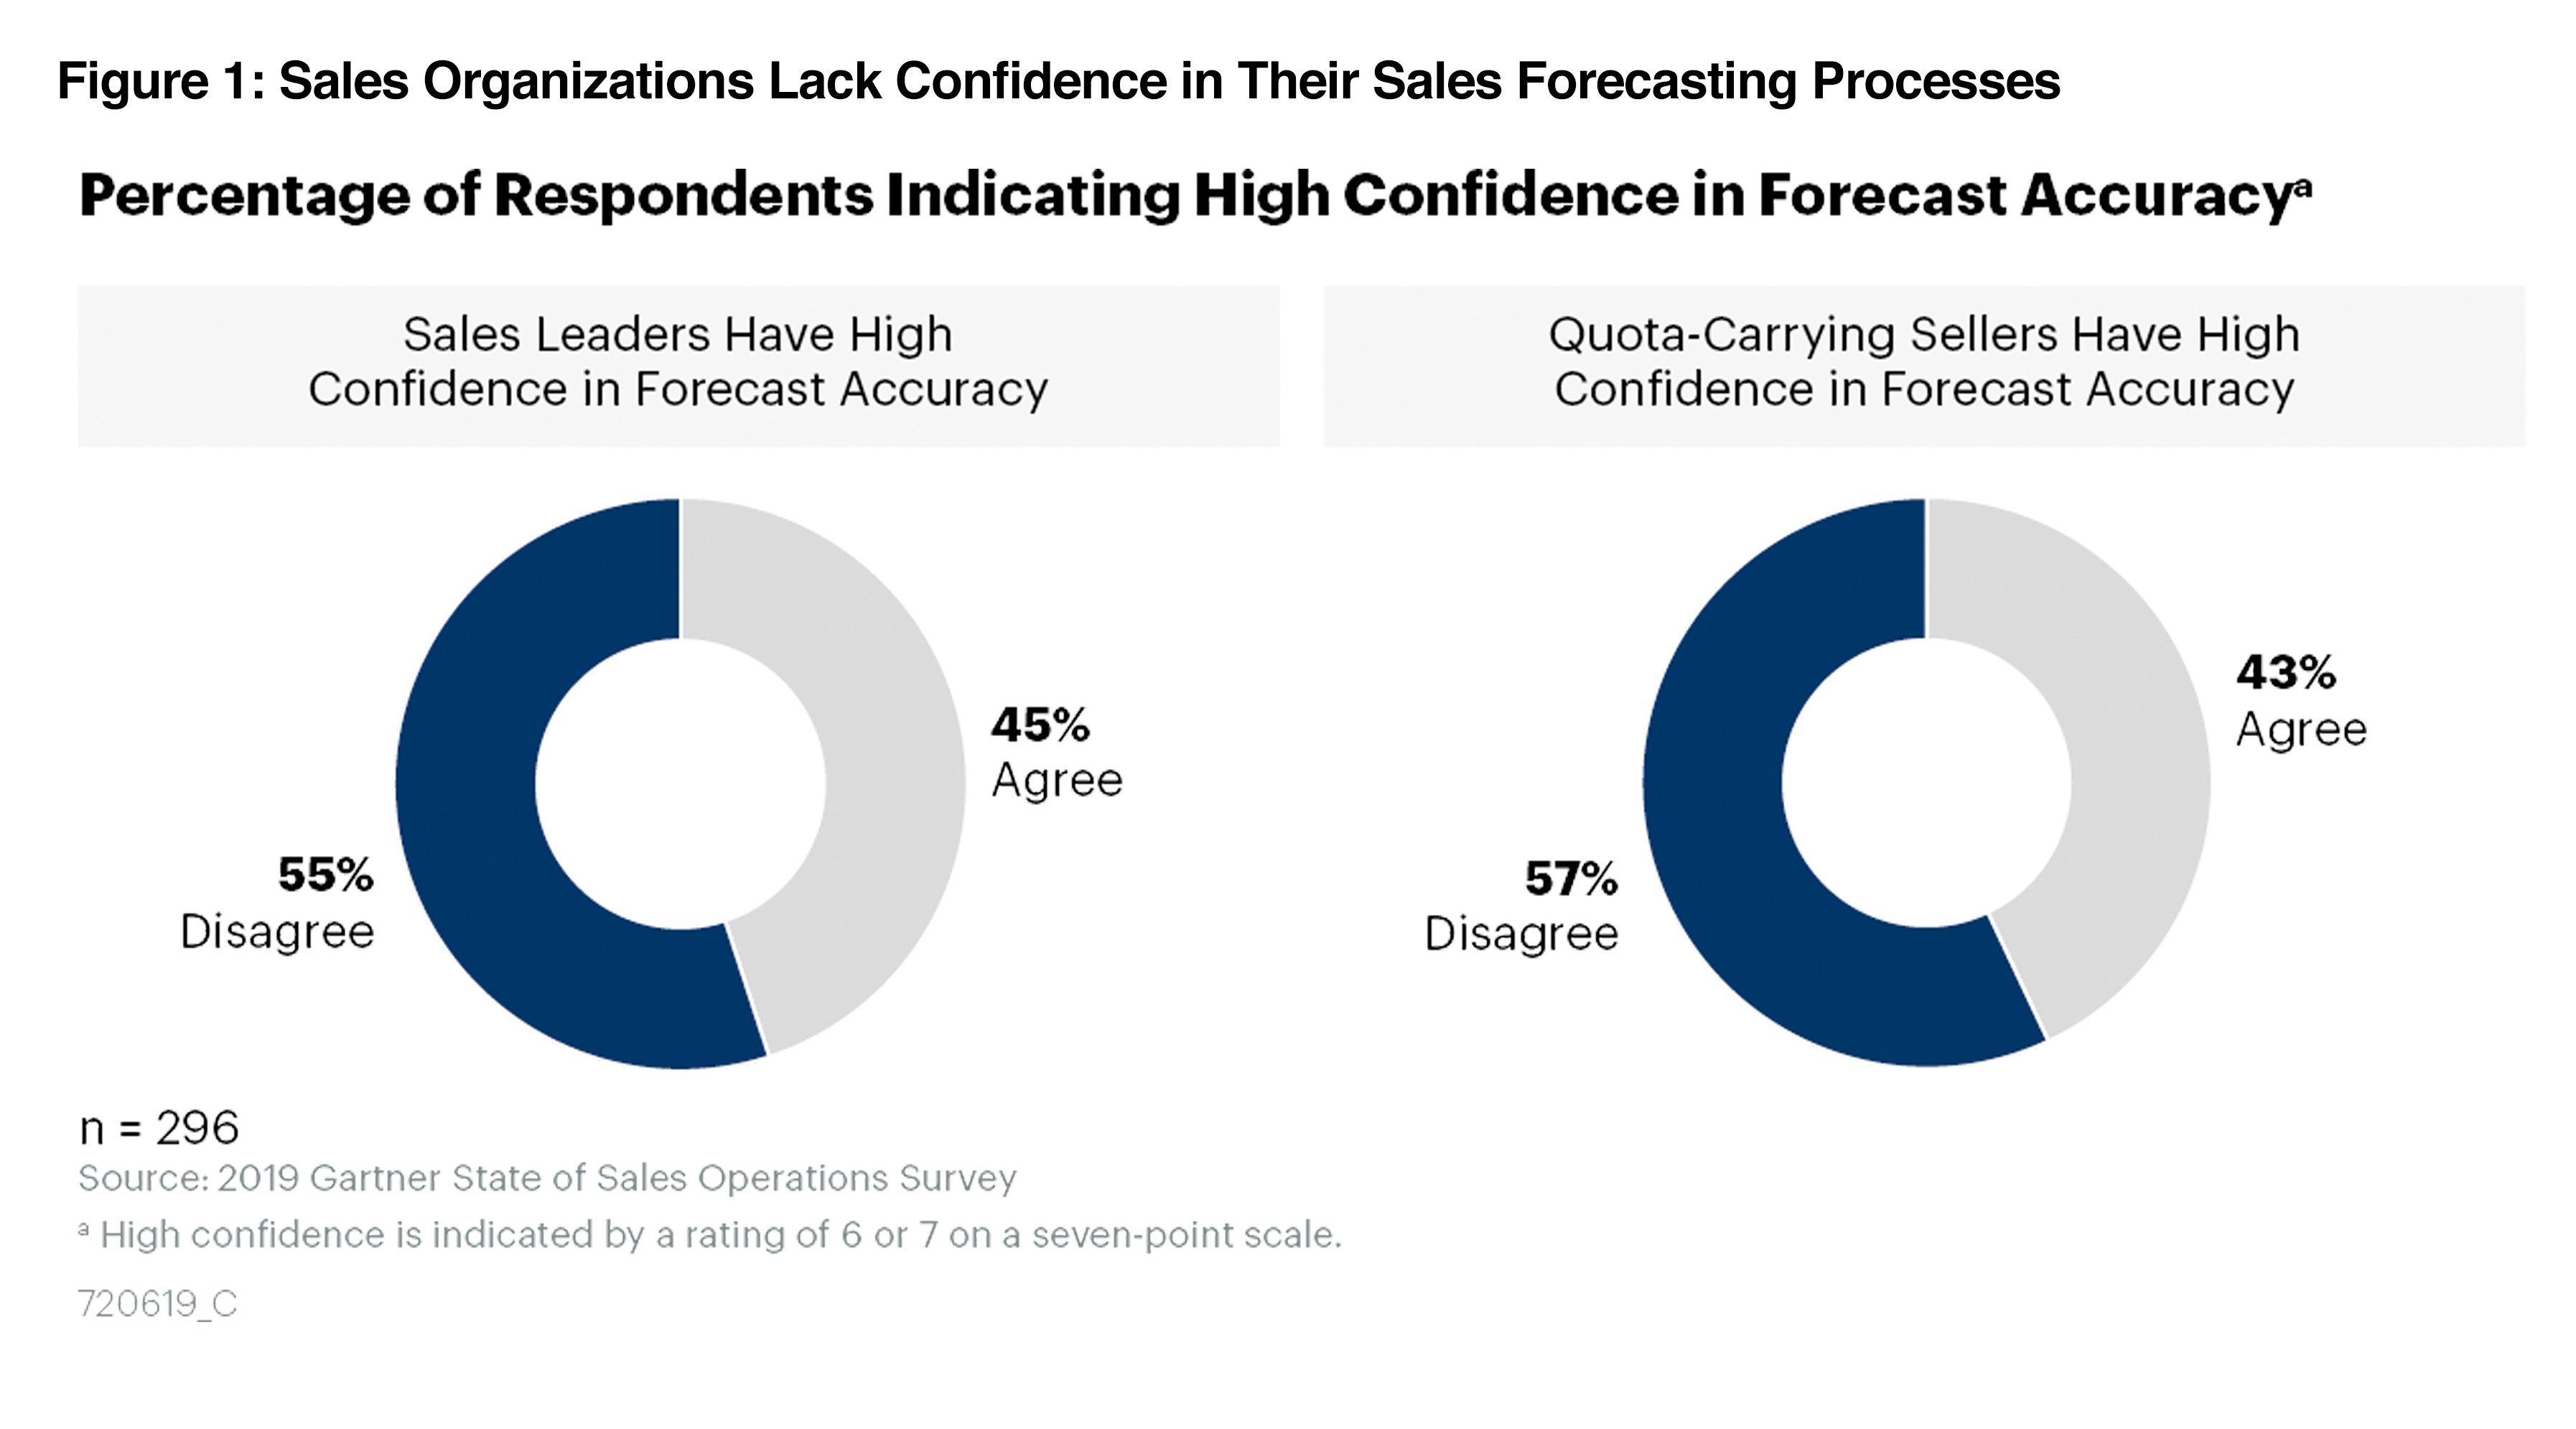
- Forecasting research is consistent here: Gartner sales-forecasting studies repeatedly find that the average B2B sales forecast misses by more than 10% even with tooling, and that forecast confidence routinely outruns forecast accuracy. Behavioral-economics work on overconfidence (Kahneman, "Thinking, Fast and Slow") explains why: humans, and models trained on human-entered CRM data, systematically conflate certainty with correctness.
- The practical failure mode: by month 3, teams start trusting Clari's confidence signal over their own deal review, which inflates the forecast by an observed 9-14% when pipeline is sparse. A disciplined weekly pipeline review is the main defense against that drift, and (q9519) lays out a 25-minute version that inspects deals instead of rubber-stamping the dashboard.
The 4-Quarter Lag Problem
- Quarter 1 implementation: Clari uses near-zero historical data; forecast MAPE runs 18-35%, barely better than a sales manager's gut.
- Quarters 2-3: Clari learns from Q1 closes; MAPE improves to 12-18%.
- Quarter 4+: full pattern recognition; MAPE settles at 4-8%, the cited headline benchmark.
- Critical: comparing Q1 implementation accuracy (18-35% MAPE) to a year-four forecast (4-8% MAPE) measures adoption maturity, not Clari quality. Harvard Business Review's coverage of sales-forecasting discipline makes the same point: the tool is only as good as the data discipline feeding it.
Competitor Accuracy Comparison
| Tool | Accuracy (MAPE) | Maturity (quarters) | Best fit |
|---|---|---|---|
| Clari | 4-8% | 4+ | Booked pipeline, deal momentum |
| Salesforce native reports | 15-30% | N/A | Baseline, small teams |
| Gong Forecast | 6-12% | 3+ | Activity-heavy orgs |
| Manager override | 15-25% | N/A | Volatile, untrained teams |
When Clari Forecast Fails
- Pipeline heavy on early-stage leads where Clari has weak pattern match.
- Sales managers manipulate deal stage to game confidence scores.
- Deal velocity is abnormally seasonal; Clari learns from trailing patterns, not next-quarter exceptions.
- A single concentrated mega-deal can dominate the quarter; building a forecast that survives one $2M slip is a structural problem addressed in (q9517).
Counter-Case: The Skeptic's Argument
A rigorous reader should push back on the framing above before buying anything.
- The 96% number is a survivorship artifact. Vendor and commissioned-TEI benchmarks are drawn from customers who stayed on the platform 3+ years. Orgs that churned Clari in year one, often the worst-fit cases, are excluded from the denominator. The honest expected MAPE for a *randomly selected new buyer* is closer to the 12-18% mid-maturity band, not 4-8%.
- MAPE rewards sandbagging. A team that systematically commits low and beats it every quarter posts a beautiful MAPE while being a *worse* forecasting organization. Accuracy against the commit is not accuracy against reality. Clari can make a chronically conservative forecast look "96% accurate" indefinitely.
- More accuracy may not be the goal. The board does not actually need the forecast to be within 4% in week 11 of the quarter; it needs *early* signal it can act on. A confident-but-wrong forecast in week 2 that triggers a pipeline-gen scramble can be more valuable than a perfectly accurate forecast in week 12 when nothing can change. Optimizing pure end-of-quarter MAPE can quietly punish the leading behavior you want.
- Attribution is unfalsifiable. If the forecast improves after adopting Clari, you cannot cleanly separate the tool from the new weekly inspection cadence, the deal-desk discipline, and the manager attention that arrived alongside it. Most "Clari ROI" is really process ROI wearing a Clari badge.
- Fair rebuttal: none of this means Clari is worthless. It means the correct test is a *controlled* one (next section), not the vendor's headline. Clari's real, defensible value is consistency and coaching surface area, not a magic accuracy figure.
How To Actually Test It
- Freeze your pre-Clari baseline MAPE (last 4 quarters of commit vs. Actual) before go-live.
- After 4 quarters on Clari, compare trailing MAPE to that baseline, not to the vendor benchmark.
- Separately track week-2 forecast vs. Final actual to measure early-signal value, not just end-of-quarter accuracy.
- Audit for sandbagging: if commit consistently lands 8%+ under actual, your "accuracy" is conservatism, not skill.
- Distinguish *forecast inaccuracy* from *AE optimism* and *structural process breakage* — a deal-slippage tracking system that separates those three causes is described in (q9520), and it is what tells you whether Clari or your process is the real problem.
Honest Payoff
- Mature org (3+ years, $5M+ ARR): Clari typically pays back in 2-3 months via forecast credibility and coaching signals.
- Growth-stage org (under $2M ARR): Clari often functions as a 4-6 month confidence placebo; spreadsheet override remains common.
- Acquisition-heavy org: accuracy degrades to 22-35% MAPE because new-customer patterns do not match historical data.
Sources
- Forrester, "The Total Economic Impact of Clari" (commissioned TEI study).
- Gartner sales-forecasting research on B2B forecast miss rates.
- Harvard Business Review coverage of sales-forecast discipline and bias.
- Daniel Kahneman, "Thinking, Fast and Slow" (overconfidence and the planning fallacy).
- Clari product documentation; public pricing ranges via G2 and Vendr.
TAGS: clari,forecasting-accuracy,deal-momentum,mape-metric,forecast-reliability
FAQ
What does Clari's 96% accuracy claim actually mean? The 96% accuracy figure is a MAPE (Mean Absolute Percentage Error) of roughly 4–8% at maturity, meaning on $1M forecasted, actual close lands between $960k and $1.04M within the committed 30-day window. The number is real but only on closed opportunities, and it stabilizes only after about four quarters of historical truth.
It comes from Clari's own benchmarks and Forrester's commissioned Total Economic Impact study.
What's the difference between forecast accuracy and confidence in Clari? Accuracy is forecast divided by actual close, a lagging measure that needs about four quarters to stabilize. Confidence is Clari's internal probability score, a leading signal that is typically only 60–80% correlated with realized win rates, not 1:1.
The practical failure mode is that by month 3, teams start trusting the confidence signal over their own deal review, inflating the forecast by an observed 9–14% when pipeline is sparse.
Why does Clari's accuracy look bad in the first year? In Quarter 1, Clari uses near-zero historical data and MAPE runs 18–35%, barely better than a sales manager's gut. Quarters 2–3 improve to 12–18% as it learns from Q1 closes, and Quarter 4+ settles at the 4–8% headline benchmark.
Comparing year-one accuracy to year-four accuracy measures adoption maturity, not Clari quality.
How does Clari compare to alternatives on accuracy? Clari runs 4–8% MAPE after 4+ quarters of maturity, best for booked pipeline and deal momentum. Gong Forecast runs 6–12% after 3+ quarters for activity-heavy orgs, Salesforce native reports run 15–30% as a small-team baseline, and manager override runs 15–25% for volatile or untrained teams.
Clari leads on accuracy but requires the longest maturity runway.
When does Clari's forecast fail? It fails when pipeline is heavy on early-stage leads where Clari has weak pattern match, when sales managers manipulate deal stage to game confidence scores, and when deal velocity is abnormally seasonal since Clari learns from trailing patterns rather than next-quarter exceptions.
A single concentrated mega-deal, such as a $2M slip, can also dominate the quarter and break the forecast.