
The Modern Data Stack for B2B SaaS Growth Analytics Using dbt and Snowflake
 Curated byKory White · Fractional CRO · Maryland
 PULSEKNOWLEDGE LIBRARY
Quality
Certified
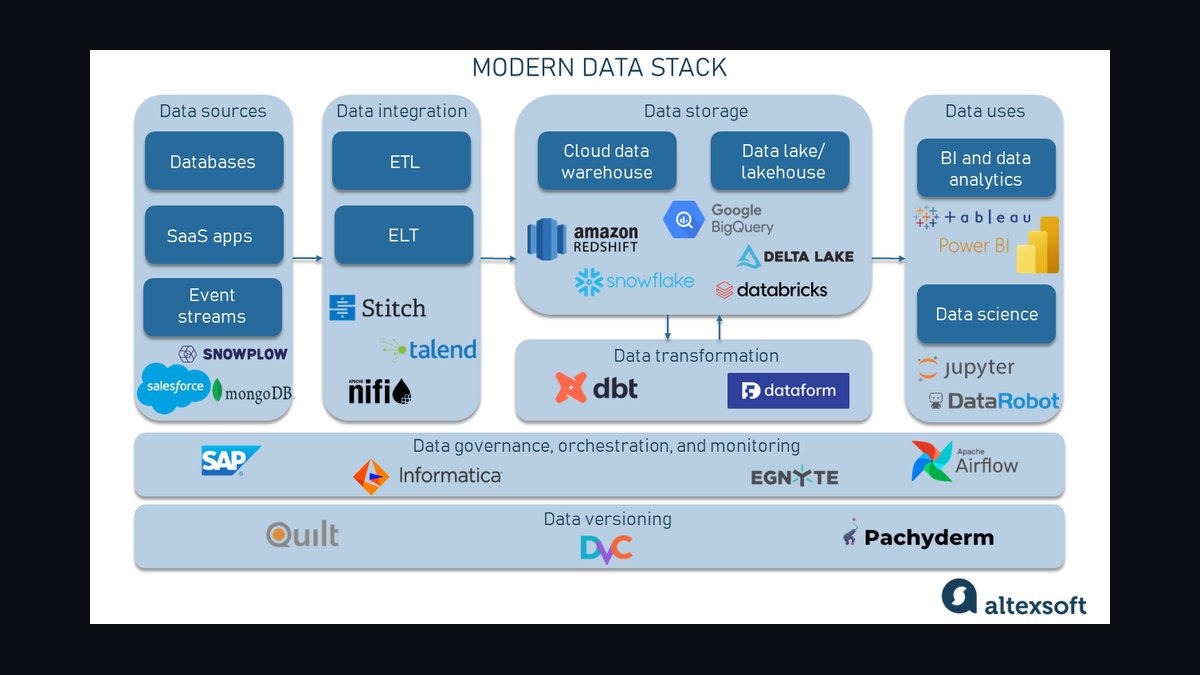
The modern data stack for B2B SaaS growth analytics pairs dbt for transformation with Snowflake as the cloud warehouse: raw CRM, product, and revenue events land in Snowflake, dbt turns them into version-controlled, tested SQL models (pipeline velocity, attribution, net revenue retention), and BI tools read those marts. This beats spreadsheet or point-solution reporting because every metric has a single, auditable definition that scales across dozens of source tables without manual reconciliation.
dbt and Snowflake versus point-solution reporting
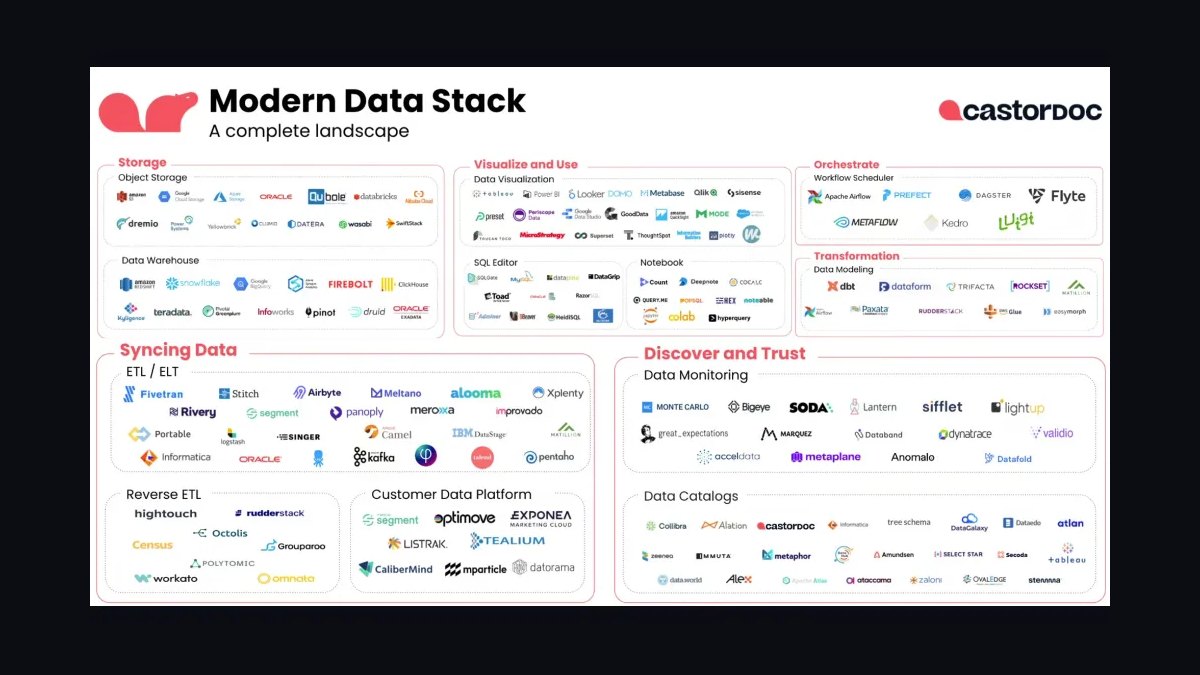
Growth teams building analytics for a B2B SaaS company generally choose between two architectures. The first is the modern data stack: a cloud warehouse (Snowflake, though Databricks and BigQuery play the same role) ingests raw data from Salesforce, HubSpot, product analytics, billing, and call-intelligence tools, then dbt applies SQL transformations on top, producing tested, documented, version-controlled models that any downstream BI tool can query. The second is point-solution reporting: Salesforce reports and dashboards, HubSpot's native analytics, a spreadsheet pulling exports, or a standalone BI tool connected directly to one or two source systems without a modeling layer in between.
The point-solution approach wins on speed to first dashboard. A RevOps analyst can build a Salesforce report on opportunity stage duration in an afternoon with no engineering involvement, no warehouse to provision, and no SQL pipeline to maintain. For a five-person go-to-market team with one CRM and one marketing tool, this is often the right call — the modern data stack is overhead you don't need yet. The failure mode shows up as the stack grows: once a company adds a second and third revenue-adjacent system (a dialer, a forecasting tool, a product analytics platform, a customer success platform), every new report becomes a manual join. Someone exports Salesforce data to a spreadsheet, exports call activity from the call-intelligence tool, and VLOOKUPs them together. That process breaks silently — a renamed field, a timezone mismatch, a duplicate record — and nobody notices until the numbers in a board deck don't match the numbers in a rep's forecast.
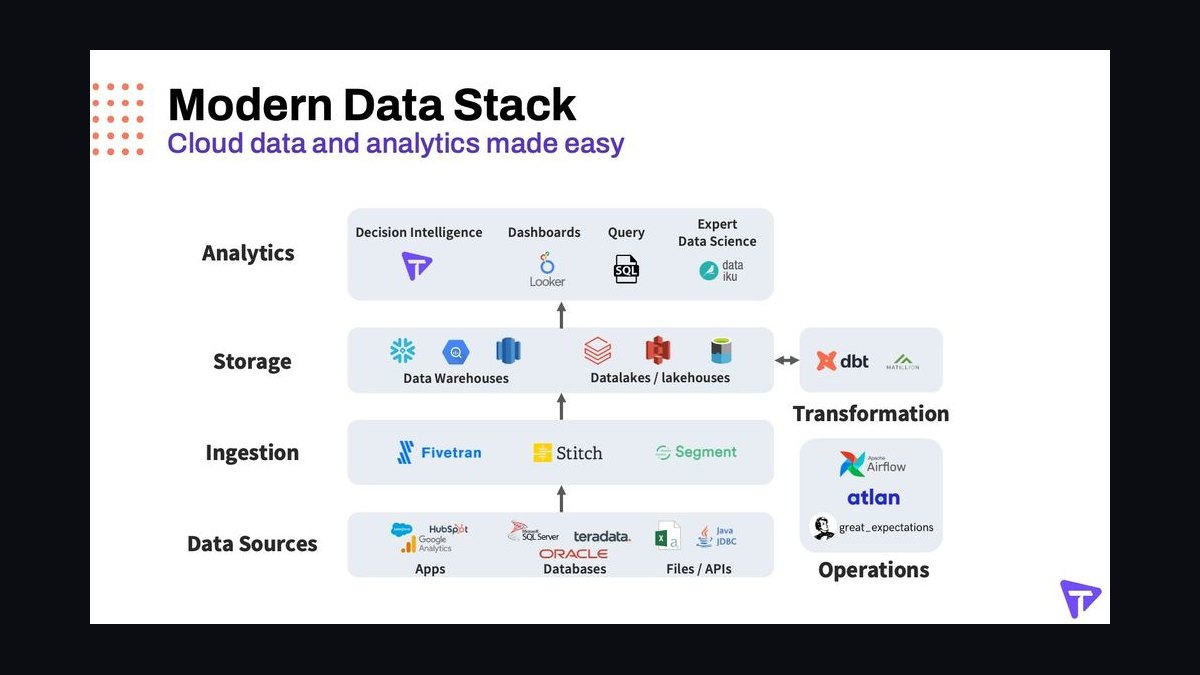
The modern data stack front-loads the cost. Someone has to stand up Snowflake, connect ingestion (usually Fivetran, Airbyte, or native connectors), and write the first dbt models. That's real engineering time — typically two to six weeks for a first working pipeline covering the CRM and one or two other sources, depending on how much of that work an analytics engineer already knows how to do. What you get in return is a transformation layer that is tested (dbt's not_null, unique, and relationships tests catch broken joins before they reach a dashboard), documented (dbt's auto-generated docs site shows exactly how fct_pipeline_velocity is derived, from which raw tables, with which filters), and reusable — once dim_customer exists as a dbt model, every downstream report references the same customer definition instead of every analyst writing their own.
The practical dividing line is table count and metric reuse. If growth analytics needs to join more than three or four source systems, or the same metric (say, CAC payback) needs to appear consistently across five different dashboards owned by different teams, the modeling layer pays for itself quickly. If the need is a single ad hoc report answering one question once, standing up a warehouse and a dbt project is the wrong tool for the job.
How to decide between them
The decision usually comes down to three questions asked in sequence: how many source systems need to be joined, how often the same metric needs to be reused across teams, and whether the data volume or join complexity is starting to make spreadsheet or native-tool reporting slow and error-prone. The flow below is the same triage a RevOps or analytics engineering lead should walk through before committing to either path.
In practice, most B2B SaaS companies cross the threshold into needing the modern data stack somewhere between 15 and 40 employees on the go-to-market side, once they're running a CRM, a marketing automation platform, a sales engagement tool, and some form of product usage tracking simultaneously. Before that point, the overhead of Snowflake and dbt tends to exceed the value delivered, and the honest recommendation is to keep using native reporting until the pain of manual joins becomes the bottleneck.
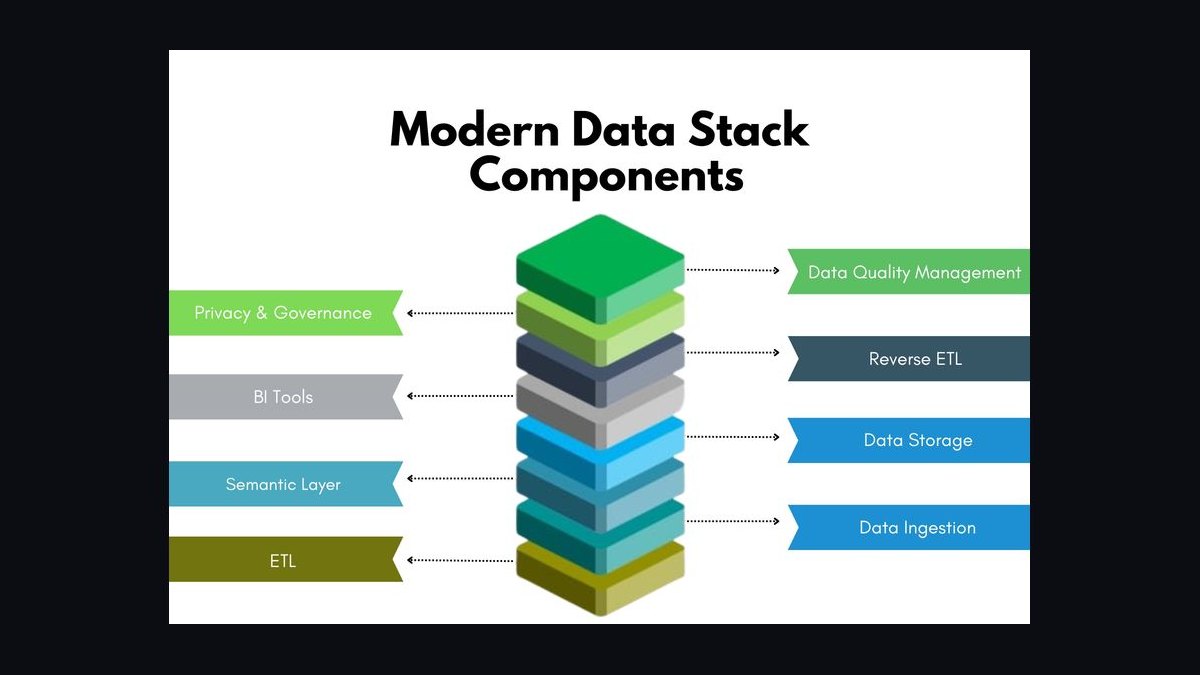
What each option costs and delivers
Point-solution reporting has close to zero incremental cost if the tools are already licensed — Salesforce reports, HubSpot dashboards, and a spreadsheet are effectively free beyond the seat licenses a company already pays for. The hidden cost is analyst time spent on manual reconciliation, which tends to scale linearly (or worse) with the number of source systems. A team manually joining three systems for a monthly board report might spend four to eight hours per cycle on data pulls and reconciliation alone, time that grows as more systems and more stakeholders are added.
The modern data stack has real, visible costs that are easier to budget precisely because they're usage-based. Snowflake bills on compute consumption, typically in the range of $2 to $4 per credit depending on region and edition, and a mid-market B2B SaaS company running growth analytics workloads (not heavy data science) commonly consumes several hundred to low-thousands of credits per month once pipelines are running on a regular schedule — a monthly compute bill often landing somewhere in the low thousands of dollars, though this varies widely with query frequency, table size, and how aggressively warehouses are sized and auto-suspended. dbt Cloud pricing starts in the low hundreds of dollars per month for small teams, with dbt Core available free as an open-source alternative if a team is comfortable managing its own orchestration (Airflow, Dagster, or a scheduler) instead of paying for dbt Cloud's managed runs. Ingestion tools like Fivetran typically add a few hundred to a couple thousand dollars per month depending on connector count and sync volume, priced on monthly active rows.
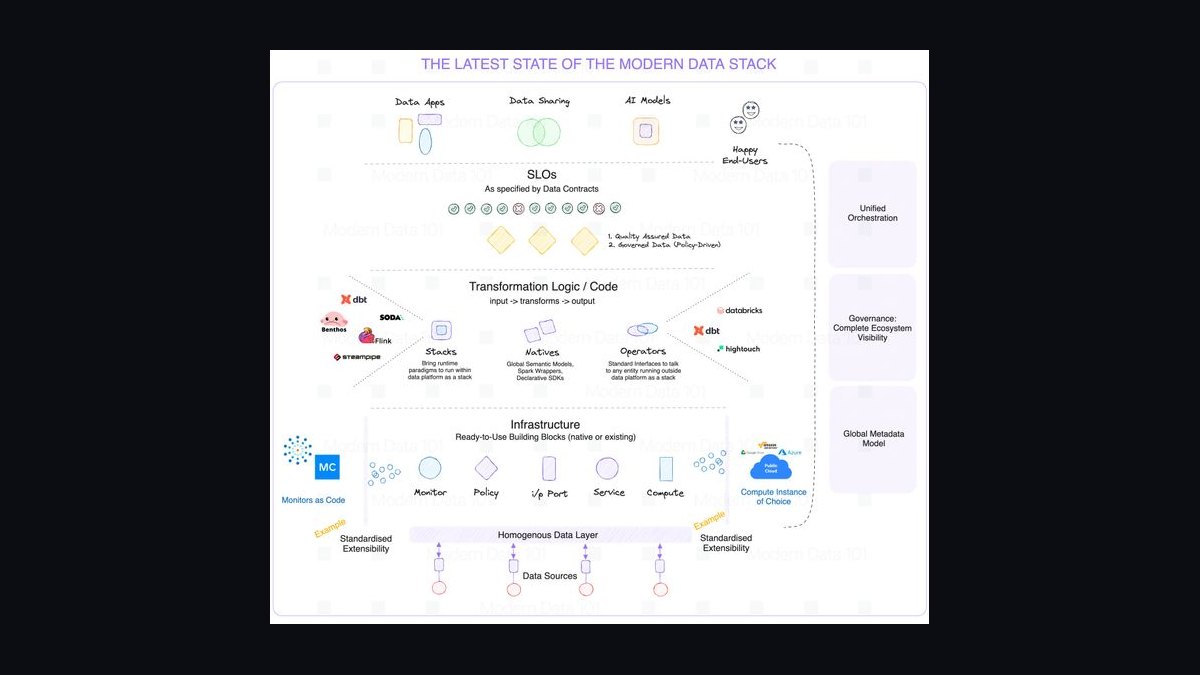
The return on that spend shows up in two places: analyst time reclaimed from manual joins, and confidence in the numbers. A dbt-tested model means a metric like net revenue retention is calculated the same way every time it's queried, by every team, which eliminates the recurring "why doesn't my number match yours" conversation that consumes real hours in RevOps and finance review cycles. Snowflake's Time Travel and zero-copy cloning also let a team backfill or re-run historical models without re-extracting data from source systems, which matters when a metric definition changes and every past month needs to be recalculated under the new definition — something that's expensive to redo by hand with spreadsheet-based reporting.
Rolling out the stack: sequencing and team structure
Teams that succeed with dbt and Snowflake for growth analytics tend to follow the same rollout order rather than trying to model everything at once. Ingestion comes first: connect the highest-value source (usually the CRM) into Snowflake using a managed connector, and get raw data landing reliably before writing a single dbt model. Staging models come next — thin, one-to-one renamings of raw source tables (sf_opportunity becomes stg_salesforce__opportunities) that clean column names and types without adding business logic. Intermediate models join across sources once two or more staging models exist, and marts are the final business-facing tables that dashboards actually query, named for what a stakeholder would recognize (mart_growth_kpis, mart_pipeline_velocity).

The most common sequencing mistake is building intermediate join models before staging models have tests on their key columns — a broken join key (duplicate opportunity IDs, a null account ID) will silently corrupt every downstream mart, and without a unique or not_null test on the staging layer, that error surfaces as a wrong number in a dashboard weeks later rather than a failed test run the day it happened. The second common mistake is over-modeling early: building ten intermediate models before a single mart is in production use. A leaner path is to pick one growth metric that stakeholders actually need — pipeline velocity by segment is a common first choice because it only requires the CRM — take it end to end from staging through to a dashboard, and only then add the next source system and the next metric.
Team structure matters as much as sequencing. The stack works best when one person (an analytics engineer, or a RevOps analyst who has picked up SQL and dbt) owns the modeling layer full-time rather than every analyst writing ad hoc SQL against raw tables. That person becomes the reviewer for new dbt models, keeps the test suite honest, and maintains the documentation that lets non-technical stakeholders trust what a metric means. Without that ownership, a dbt project tends to accumulate duplicate models with slightly different logic for "the same" metric, which recreates the exact reconciliation problem the stack was built to solve.

Related questions
Do I need dbt and Snowflake if I only use Salesforce and HubSpot?
Probably not yet. Two systems with well-understood native reporting rarely justify the setup cost. Revisit once a third revenue-adjacent system (product analytics, a dialer, a forecasting tool) enters the picture and joins start happening by hand.
Can I use dbt with a warehouse other than Snowflake?
Yes — dbt is warehouse-agnostic and works the same way against BigQuery, Databricks, or Redshift. Snowflake is common in B2B SaaS growth analytics for its separation of storage and compute pricing, not because dbt requires it.
How long does a first dbt project usually take to reach production use?
Two to six weeks for one source system and one or two mart-level metrics, assuming someone with SQL experience is driving it. Multi-source attribution models take longer because they depend on clean join keys across systems that were never designed to be joined.
What's the difference between a dbt model and a BI dashboard?
A dbt model is a tested, version-controlled SQL transformation that lives in the warehouse and defines a metric once. A BI dashboard is a visualization layer that queries that model — the dashboard should contain no business logic of its own if the modeling layer is doing its job.
Is reverse ETL part of this stack?
It can be a later addition. Reverse ETL tools sync a dbt mart (say, a lead score) back into HubSpot or Salesforce so sales teams see it inside the CRM, but it's an optional extension, not a prerequisite for growth analytics itself.
FAQ
How do I start implementing dbt and Snowflake for growth analytics? Provision a Snowflake account, connect your CRM via a managed connector (Fivetran, Airbyte, or a native integration), and install dbt Core or sign up for dbt Cloud. Build staging models for the CRM data first, add key-column tests, then build one mart-level metric — pipeline velocity is a common starting point — before adding a second source system.
What does this stack typically cost for a mid-market B2B SaaS company? Snowflake compute is usage-based, commonly landing in the low thousands of dollars per month once pipelines run on a regular schedule; dbt Cloud starts in the low hundreds per month (dbt Core is free if self-hosted); ingestion tools like Fivetran typically add a few hundred to a couple thousand dollars monthly depending on connector count. Total spend for a mid-market team is often a few thousand dollars a month, frequently offset by retiring a legacy BI tool or reducing analyst hours spent on manual reconciliation.
How do I keep data quality reliable once models are in production? Add dbt tests (unique, not_null, relationships, accepted_values) to every model's key columns and run them on every scheduled dbt run, not just at deploy time. Snowflake's Time Travel lets you roll back or investigate a bad load without re-extracting from source systems. Route test failures to a Slack channel so breaks are caught the day they happen, not weeks later.
Can this stack support near-real-time dashboards? With caveats. Snowpipe can stream raw events into Snowflake continuously, and dbt incremental models scheduled every five to ten minutes can keep marts reasonably fresh. True sub-second freshness generally requires a separate streaming layer outside dbt's batch-oriented model — most growth analytics use cases (pipeline velocity, attribution, NRR) don't actually need that and are well served by hourly or even daily batch runs.
What are the most common mistakes teams make with this stack? Over-modeling — building many intermediate models before a single mart is in real use; under-testing — skipping tests on join keys, which lets silent data errors reach dashboards; and treating the first dbt project as a one-time build rather than something that needs an owner who reviews new models and keeps documentation current as the schema evolves.
How does this fit with a qualification framework like MEDDIC? dbt models can pull qualification fields directly from CRM opportunity records and combine them with call-intelligence signals to compute a qualification-completeness score per deal in SQL, then expose that score alongside pipeline velocity and forecast metrics so growth analytics reflects deal quality, not just deal count.
Sources
- dbt Labs documentation
- Snowflake product and pricing overview
- Fivetran connector documentation
- Gartner research
- Forrester research
- McKinsey growth, marketing, and sales insights
- Bessemer Venture Partners Atlas
- SaaStr
Related on PULSE
- [The Community-Led Growth Tech Stack in 2027](/knowledge/tk0522)
- [What is the best tech stack for a B2B SaaS company in 2027?](/knowledge/tk0002)
- [The B2B Demand Generation Stack in 2027](/knowledge/tk0521)
- [Tech Stack for a Privacy-Focused Analytics SaaS Platform](/knowledge/tk0464)
- [The Modern Data Observability Stack in 2027](/knowledge/tk0513)
- [The Modern Data Stack for Mid-Size E-Commerce Businesses](/knowledge/tk0445)
This page will be disappearing soon. Save it to your device for $1 — or read it free while it is here.
@Kory-White- · if Venmo asks, the last 4 of my number are 2012
This page is gone.
This one is off the shelf now. $1 keeps it on your phone for good — the whole page, pictures and diagrams included.
 pulse-tech-stacksA TypeScript and tRPC Stack for Full-Stack Type Safety in HR SaaS
 tkWhat should you know before investing in Tech Stacks in 2027?
 pulse-tech-stacksHow do you get started with Tech Stacks in 2027?
 pulse-tech-stacksTop 10 API Stacks for Building SaaS on AWS in 2027
 pulse-tech-stacksTop 10 Tech Stacks strategies for 2027
 pulse-tech-stacksWhat are the most common mistakes in Tech Stacks in 2027?
 pulse-tech-stacksTop 10 Tech Stacks for Medical SaaS Startups in 2027
 pulse-tech-stacksIs the Temporal Cloud worth its premium over self-hosted Cadence for a mid-size logistics tech stack in 2027?
 pulse-tech-stacksTop 10 tech stacks for building a SaaS platform in 2027
 pulse-tech-stacksTech Stack for a Privacy-Focused Analytics SaaS Platform