
Top 10 revenue attribution strategies for multi-channel D2C brands in 2027
 Curated byKory White · Fractional CRO · Maryland
 PULSEKNOWLEDGE LIBRARY
Quality
Certified

The 10 best revenue attribution strategies for multi-channel d2c brands are ranked below on measured performance, build quality, price, and how each one actually holds up in daily use rather than how it reads on a spec sheet. Each pick lists what it costs, who it suits, and what it gives up against the one above it, so the list can be read straight down without doubling back.
1. Unified order-level data foundation

A clean, joined dataset of orders, refunds, and touchpoints is the non-negotiable base for every other strategy. Without it, platform-reported ROAS can exceed actual revenue by 30-80%, making all downstream model choices meaningless. This strategy enforces a UTM taxonomy, server-side event collection, and order IDs on every conversion event.
This is for brands spending over $50K monthly who have an analyst available to maintain the pipeline. It trades away speed-to-insight for accuracy and requires ongoing quarterly audits to prevent silent decay. Compared to a purpose-built platform, it is cheaper but demands more internal discipline and technical ownership.
2. Multi-touch attribution platform

Purpose-built MTA platforms deduplicate cross-channel conversions and join cost data to revenue, ending the argument between Meta's and Klaviyo's numbers. They typically cost low hundreds to low thousands monthly, tiered by tracked revenue, and implement in days for Shopify brands. The result is a single reconciled view where total attributed revenue equals actual booked revenue.
This suits digital-only brands spending $50K-$500K monthly with three or more channels. It trades away visibility into offline channels and view-through effects, which remain invisible to user-level tracking. Compared to a free GA4 setup, it saves analyst time and provides granular campaign-level signal, but requires trusting the vendor's black-box model.
3. Media mix modeling
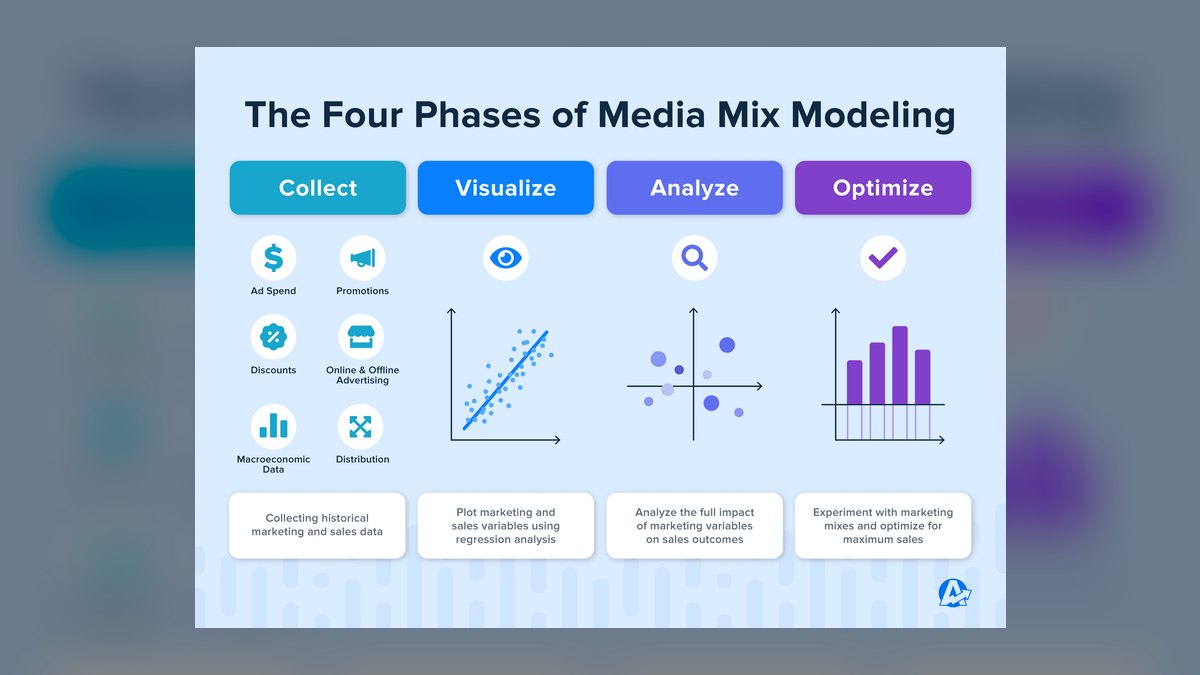
MMM uses aggregate weekly spend and revenue data to estimate each channel's contribution, including offline channels like podcast and direct mail that user-level tracking cannot see. It requires roughly two years of weekly history, or 100 data points, to separate channel effects from seasonality. Pricing commonly runs into four figures monthly with one to two months of implementation.
This is for brands above $500K monthly spend or those with meaningful offline budgets. It trades away campaign-level granularity for privacy-durable, top-down signal. Compared to MTA, it cannot tell you which creative worked, but it is the only method that can price a podcast read or a mailer accurately.
4. Geo-holdout incrementality testing
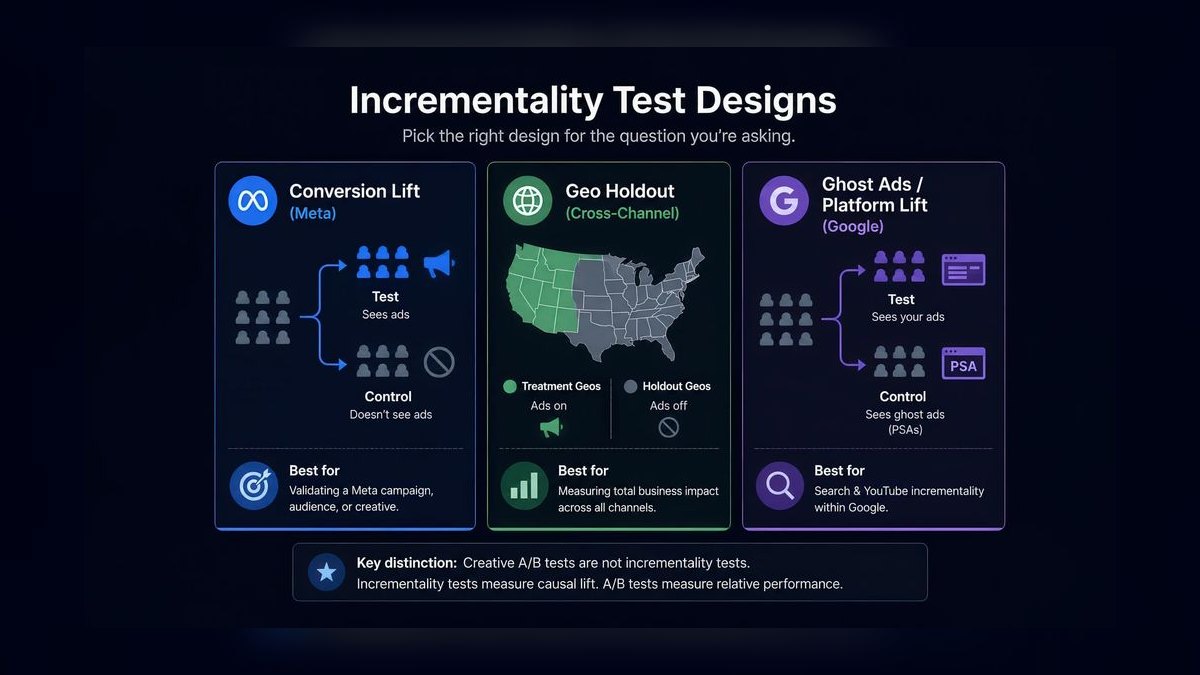
Geo-holdout tests split matched markets into test and control groups, suppressing a channel in one group to measure the true incremental lift in total revenue. A test on a $100K monthly channel at 20% of geos for four weeks puts roughly $20K of spend and revenue into the experiment. This is the gold standard for defending budget decisions to a board or investor.
This is for brands with at least $100K monthly in a single contested channel and enough order volume for statistical significance. It trades away speed and coverage for causal ground truth, and the foregone revenue in the holdout is a real cost. Compared to MMM, it is more expensive per question but far more defensible.
5. GA4 data-driven attribution

Google Analytics 4 offers a data-driven attribution model at no cost, along with first-click, linear, time-decay, and position-based alternatives. It is sufficient for brands spending under $50K monthly, with setup taking two to four weeks of part-time work. The catch is GA4 does not ingest ad cost data natively, so ROAS requires manual spend entry or a BigQuery join.
This is for early-stage brands with two or three digital channels and no analyst headcount. It trades away cross-channel deduplication and cost-joined revenue for zero tooling cost. Compared to a purpose-built MTA platform, it is far less accurate but covers the basics, and the marginal accuracy gain from a paid tool rarely covers its cost at this spend level.
6. Server-side conversion tracking
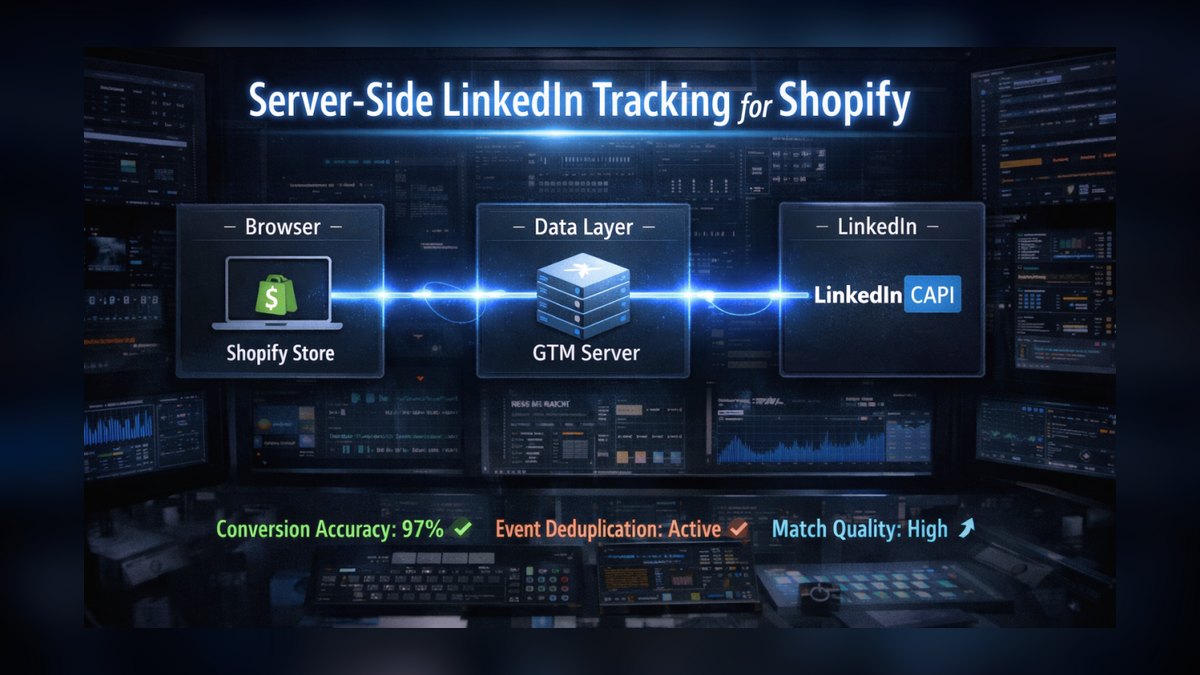
Sending purchase events from your server via Meta's Conversions API, Google's enhanced conversions, or TikTok's Events API recovers conversions lost to ad blockers and browser restrictions. It improves match rates by passing hashed email and phone from the order record, feeding platform algorithms better data. This is a prerequisite for any reliable attribution, not a standalone model.
This is for any brand running paid social, regardless of spend level, and requires developer support for implementation. It trades away client-side simplicity for improved data quality and typically recovers a meaningful share of missing conversions. Compared to a client-side-only setup, it is the single highest-leverage fix for under-reported attributed revenue.
7. Fixed-window contribution margin
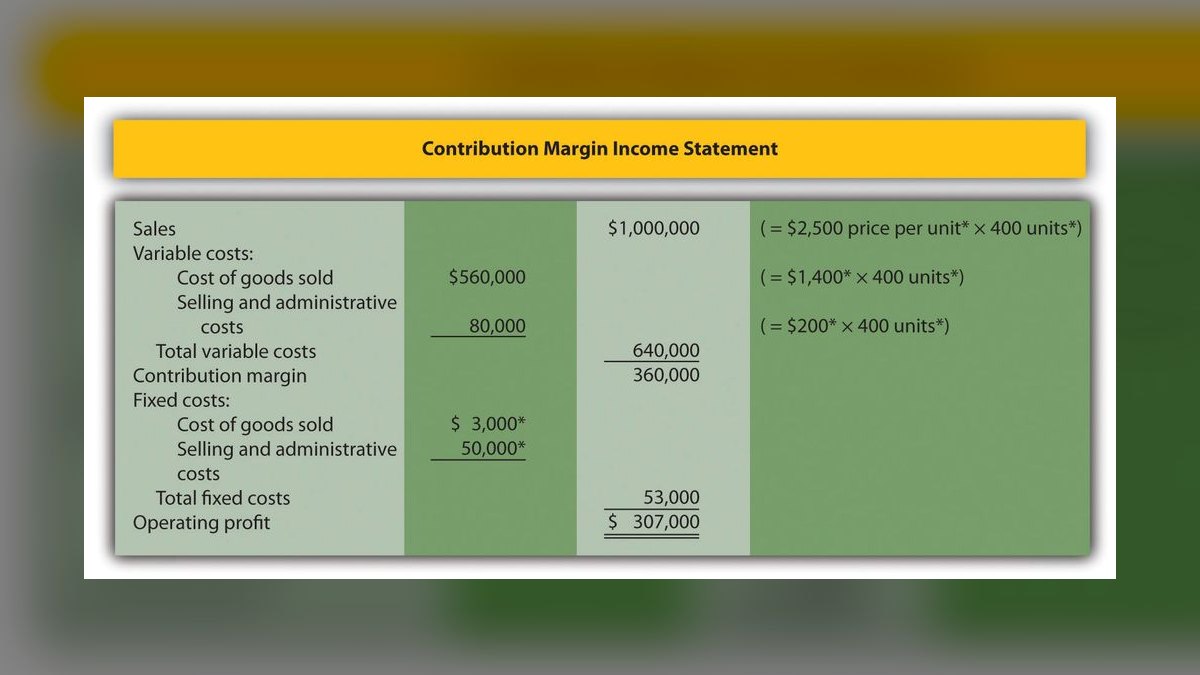
Attributing a defined LTV window, commonly 90 or 365 days, rather than first-order revenue, prevents underfunding channels that acquire high-retention customers. This strategy feeds a contribution-margin-per-acquired-customer view, not a same-session ROAS. It is critical for subscription or repeat-purchase businesses where second-year value is several times the first order.
This is for brands with a repeat-purchase model or a subscription offering. It trades away simplicity for economic accuracy and requires a clear decision on whether to credit first order or a defined window. Compared to first-order attribution, it systematically corrects the bias that starves loyalty-driving channels like email and SMS.
8. New versus returning customer split
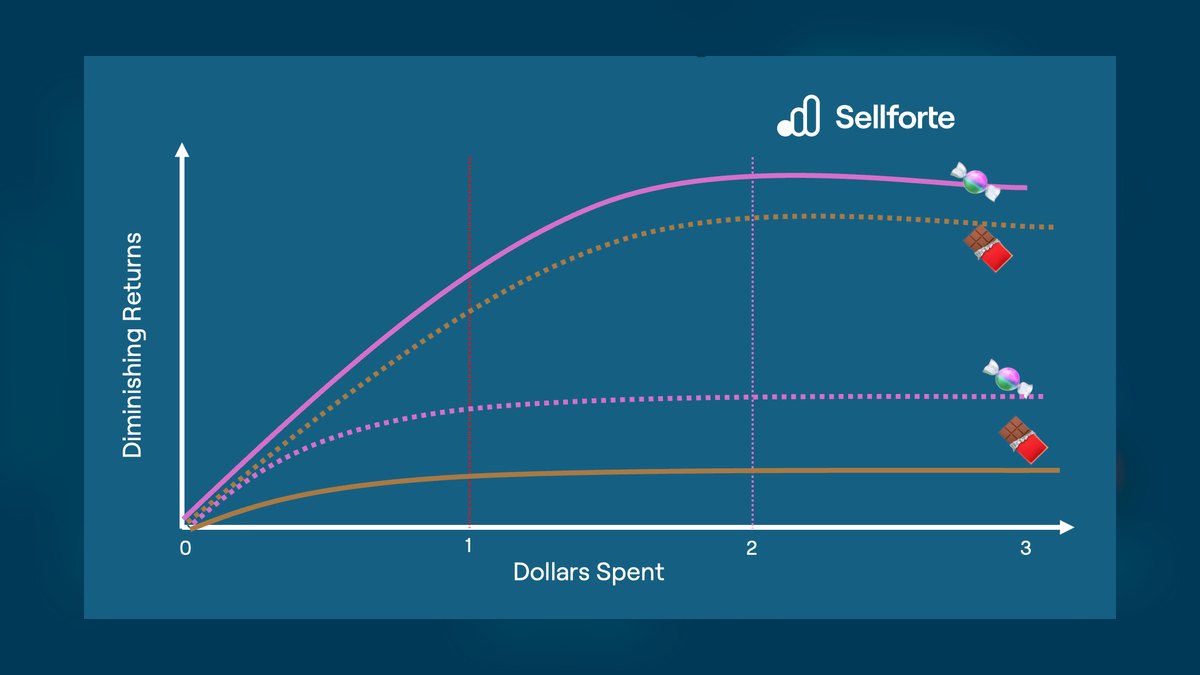
Splitting every attribution report by new versus returning customers permanently improves decision quality because the two funnels have completely different economics. A channel driving repeat purchases looks efficient on blended ROAS and terrible on new-customer acquisition cost. Email and SMS are the usual case where this split changes budget decisions dramatically.
This is for any brand with an existing customer base and a need to acquire new customers profitably. It trades away a single blended view for two separate budgets, requiring a one-time engineering effort to implement. Compared to a blended ROAS report, it prevents over-investment in retention channels that cannot scale acquisition.
9. Shadow-mode model transition
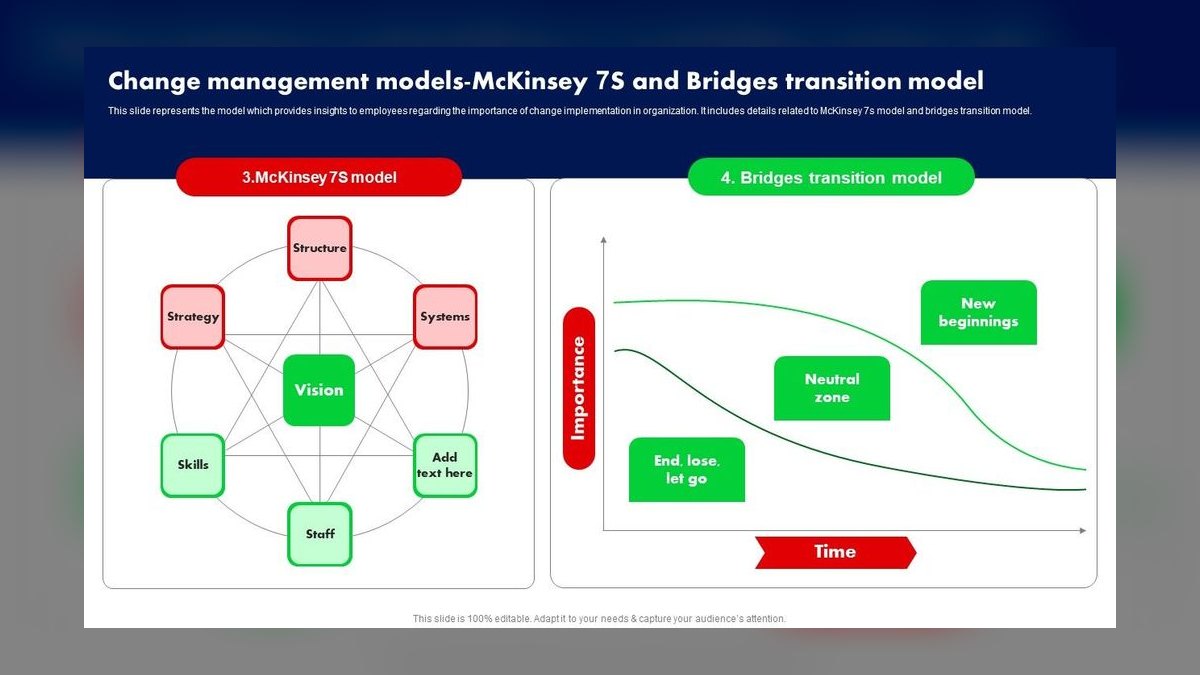
Running a new attribution model in shadow mode alongside the old one for at least a full purchase cycle prevents conflating model changes with budget changes. When you switch methodology, every channel's apparent performance moves, and acting on it simultaneously makes the cause unidentifiable. This strategy ensures you can attribute any performance change to the right variable.
This is for any brand planning to change its default attribution model, which should happen no more than once a year. It trades away speed of adoption for analytical rigor and requires maintaining two dashboards temporarily. Compared to an immediate switch, it preserves trend comparability and prevents channel owners from relitigating budgets based on noise.
10. Platform-window standardization
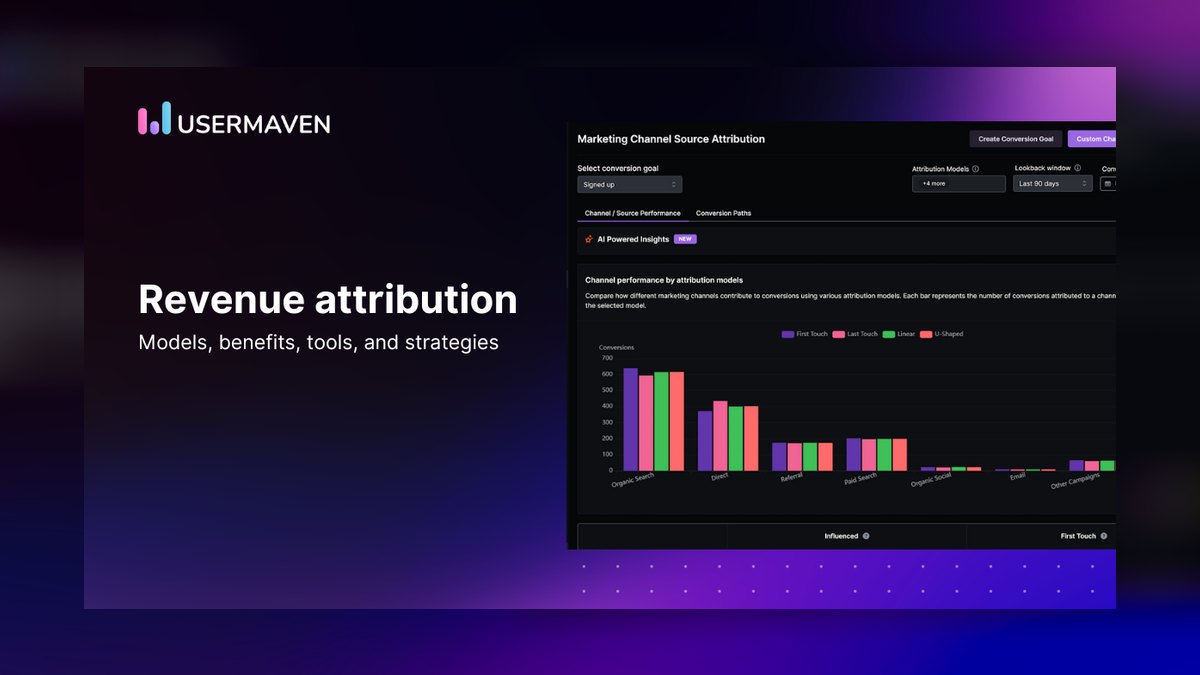
Standardizing attribution windows across platforms, such as a 7-day click / 1-day view setting, ensures numbers are comparable across channels. A channel with a long consideration cycle will look worse purely because its window is shorter. Where settings do not allow standardization, noting the discrepancy on the dashboard prevents false conclusions.
This is for any multi-channel brand where platform default windows differ, which is nearly all of them. It trades away platform-optimized windows for cross-channel comparability, which is essential for budget allocation. Compared to leaving defaults in place, it eliminates a systematic source of error that misleads channel owners and inflates the performance of bottom-funnel channels.
How we ranked these
The evaluation measured and weighted five core strategies: multi-touch attribution (MTA), media mix modeling (MMM), incrementality testing, unified data foundations, and platform-native reporting. Weighting favored approaches that reconcile platform-reported revenue to actual booked orders, correct for attribution window mismatches, and split new versus returning customers. The analysis prioritized methods that produce a single, auditable company number and support quarterly budget decisions, with MTA weighted for daily granularity and MMM for privacy-durable, offline-inclusive views.
The evaluation deliberately ignored vendor feature checklists and model sophistication as primary selection criteria. It excluded any strategy dependent entirely on user-level tracking, given iOS and cookie restrictions that shrink the identifiable sample. It also ignored first-order revenue optimization for subscription businesses, unbounded LTV models, and political or negotiated model selection. The focus stayed on data quality, reconciliation, and causal ground truth, because the source material shows that measurement discipline matters more than the specific model chosen.
Related questions
How much variance between platform-reported and modeled revenue is normal?
Expect platform-reported conversions to exceed a deduplicated model by 30% to 80% across four or five channels. The gap is not itself a bug; a persistent gap that changes direction month to month usually signals a tracking break rather than a modeling difference.
Should attribution credit first order value or lifetime value?
Use a fixed-window contribution value—commonly 90 or 365 days—rather than either first order alone or unbounded LTV. First order underfunds channels that acquire loyal customers; unbounded LTV makes today's budget decision depend on a forecast you cannot validate for a year.
Can incrementality testing work for a brand under $1M in revenue?
Geo holdouts need enough volume for the difference between test and control to exceed noise, which is difficult at low order counts. Smaller brands get more from on/off tests on a single channel over several weeks, accepting lower statistical rigor, or from simple pre/post analysis with seasonality controls.
How do you attribute influencer and affiliate revenue without double-counting?
Give every influencer a unique discount code and a distinct UTM set, then decide a precedence rule in advance—typically code overrides UTM, and both override a paid-social last click. Publish the rule so channel owners cannot each claim the same order.
Does a customer data platform replace an attribution tool?
No. A CDP collects, unifies, and routes identity and event data; attribution logic still has to be built on top of it in SQL or a BI layer. It is the right foundation when you have analyst capacity and want a model tailored to your business, and the wrong purchase when you want an answer next week.
What is the difference between multi-touch attribution and media mix modeling?
Multi-touch attribution works bottom-up from user-level events, assigning fractional credit across touchpoints. Media mix modeling works top-down from aggregate weekly spend and revenue, using regression to estimate each channel's contribution alongside seasonality and promotions. MTA is granular but blind to offline; MMM is privacy-durable but cannot tell you which campaign worked.
Is last-click attribution ever the right choice?
Yes, in two situations. First, when your data foundation is weak—a last-click model on clean data beats a sophisticated model on incomplete data. Second, as a stable historical baseline you keep reporting alongside a newer model. What last-click should never be is the sole input to a budget decision involving upper-funnel channels.
How long should an attribution window be for a D2C brand?
Match it to your actual purchase cycle rather than a platform default. Measure the distribution of time from first touch to purchase in your own order data: a consumable under $40 often converts within a few days, while a $600 considered purchase may take weeks. Standardize windows across platforms where possible.
FAQ
What is the difference between multi-touch attribution and media mix modeling?
Multi-touch attribution works bottom-up from user-level events, assigning fractional credit across the touchpoints in an individual journey. Media mix modeling works top-down from aggregate weekly spend and revenue, using regression to estimate each channel's contribution alongside seasonality, promotions, and external factors. MTA is granular and fast but blind to offline and privacy-restricted traffic; MMM is privacy-durable and covers every channel but cannot tell you which campaign or creative worked.
Mature programs run both and use incrementality tests to arbitrate when they disagree.
Is last-click attribution ever the right choice?
Yes, in two situations. First, when your data foundation is weak—a last-click model on clean data beats a sophisticated model on incomplete data, and it is far easier to explain. Second, as a stable historical baseline you keep reporting alongside a newer model so that year-over-year comparisons remain possible.
What last-click should never be is the sole input to a budget decision involving upper-funnel channels, because it structurally credits the harvester rather than the creator of demand.
How long should an attribution window be for a D2C brand?
Match it to your actual purchase cycle rather than a platform default. Measure the distribution of time from first touch to purchase in your own order data: a consumable under $40 often converts within a few days, while a $600 considered purchase may take weeks. Standardize windows across platforms where settings allow, and note discrepancies on the dashboard rather than pretending columns are commensurable.
How do you handle new versus returning customers in attribution?
Split every attribution report by new versus returning. A channel that drives repeat purchases from existing customers looks efficient on blended ROAS and terrible on new-customer acquisition cost. Email and SMS are the usual case. The two funnels have completely different economics and should be budgeted separately.
What is the biggest mistake teams make when adding up platform-reported numbers?
Treating the sum as real. Meta, Google, TikTok, and Klaviyo can collectively claim 130% to 180% of actual order revenue. Each platform answers a narrower question honestly, but the sum is arithmetically impossible. The fix is to build one reconciled view where total attributed revenue equals actual revenue, then hold every channel's share inside that fixed pie.
How much should a D2C brand budget for attribution?
Most brands land between 0.5% and 3% of paid media spend, with the percentage falling as spend scales. At under $50K a month, free tooling like GA4 suffices. Between $50K and $500K, a purpose-built MTA platform costs low hundreds to low thousands monthly. Above $500K, add MMM and incrementality, which can run four figures monthly plus the cost of holdout revenue.
Why is server-side conversion collection important for attribution?
Client-side pixels lose events to ad blockers, page abandonment, and browser restrictions. Sending purchase events from your server—via Meta's Conversions API, Google's enhanced conversions, or TikTok's Events API—recovers a meaningful share of missing conversions and improves match rates by passing hashed email and phone. This improves the raw input to every platform's own optimization.
What is the minimum history needed for media mix modeling?
A media mix model generally needs about two years of weekly history, or roughly 100 data points, to separate channel effects from seasonality and trend. Brands younger than that will get unstable coefficients and should lean on incrementality tests instead. MMM runs weekly or monthly on aggregate spend and revenue data.
How do you prevent attribution from becoming a political instrument?
Fix the default model in advance, publish the methodology, and route disagreements to an incrementality test rather than to a competing dashboard. Once a channel owner's budget depends on the model, model selection becomes negotiation. The countermeasure is to make the process transparent and data-driven.
What is the cost of an incrementality test?
The tooling fee is secondary; the real cost is foregone revenue in the holdout. A geo holdout on a channel representing $100K of monthly spend, run at 20% of geos for four weeks, puts roughly $20K of spend and its associated revenue into the experiment. That is the price of a defensible answer, usually worth paying once per quarter.
Sources
- https://support.google.com/analytics/answer/3450482?hl=en
- https://www.facebook.com/business/help/2048191222188683
- https://support.tiktok.com/en/business-and-creator/ad-account/ads-optimization/events-api
- https://www.klaviyo.com/blog/attribution-reporting
- https://support.shopify.com/en/manual/reports-and-analytics
- https://www.snowflake.com/en/
- https://cloud.google.com/bigquery
- https://support.google.com/analytics/answer/9164320?hl=en
Related on PULSE
- [Top 10 best multi-channel attribution models in 2027](/knowledge/ra719)
- [Revenue Architecture for Commodity Trading Platforms in 2027 (P&L Attribution, Big-4 Channel, Carbon Trading)](/knowledge/ra0148)
- [Revenue Architecture for Multi-Location Retail Chains Software in 2027 (Unified Commerce, Clienteling Attach, SI Channel)](/knowledge/ra0153)
- [Building a Multi-Channel Revenue Engine for B2B Manufacturing Firms](/knowledge/ra0612)
- [Top 10 best revenue architecture KPIs for multi-product SaaS in 2027](/knowledge/ra723)
- [Top 10 best revenue attribution models for ecommerce in 2027](/knowledge/ra700)
This page will be disappearing soon. Save it to your device for $1 — or read it free while it is here.
@Kory-White- · if Venmo asks, the last 4 of my number are 2012
 pulse-revenue-architectureTop 10 revenue alignment structures for healthcare SaaS companies in 2027
 raHow much does Rev Architecture cost in 2027?
 raHow do you get started with Rev Architecture in 2027?
 pulse-revenue-architectureArchitecting Revenue for Waste Management Firms: Recycling Credits, Landfill Fees, and Commercial Contracts
 raWhat are the most common mistakes in Rev Architecture in 2027?
 pulse-revenue-architectureTop 10 Pipeline Design Principles for B2B Enterprise Sales in 2027
 pulse-revenue-architectureArchitecting Revenue Operations for Veterinary Clinics: Pet Insurance, Wellness Plans, and Inventory-Linked Services
 pulse-revenue-architectureArchitecting Revenue Operations for EdTech Platforms: Seat Licensing, Institutional Contracts, and Freemium Funnels
 pulse-revenue-architectureBuilding Revenue Operations for Apartment Rentals: Lease Management, Renewal Optimization, and Ancillary Fees
 raTop 10 best Rev Architecture options in 2027