


Lean Analytics by Croll and Yoskovitz — Cliff Notes Summary
Quality
Certified
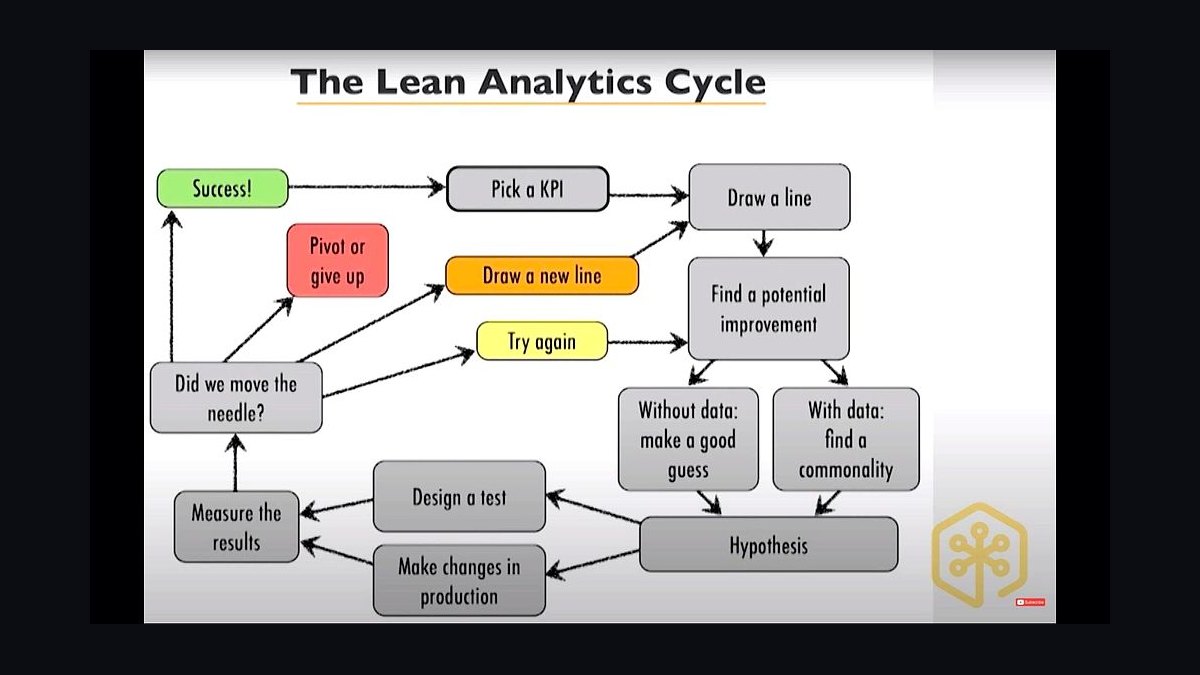
*Lean Analytics* (Croll and Yoskovitz, O'Reilly, 2013) argues that the right startup metric depends on two things: your business model and your stage. Its core discipline is the One Metric That Matters — pick one number, rally the team, ignore the rest — filtered through a vanity-versus-actionable test and gated by stage-specific benchmarks called Lines in the Sand.
What the book is and why it still matters
Alistair Croll and Benjamin Yoskovitz wrote *Lean Analytics* as the instrumentation layer that Eric Ries's *The Lean Startup* (2011) gestured at but never specified. Ries gave the world "innovation accounting" as a concept. Ash Maurya's *Running Lean* gave it a process for validating a business model canvas. Neither told you which number to put on the wall Monday morning. Croll — a partner at Year One Labs and co-founder of the Strata data conference — and Yoskovitz — a partner at Highline Beta and formerly VP Product at GoInstant — filled that gap with something closer to a field manual than a manifesto.
The central claim is deceptively plain: most startups track the wrong metrics, and they do it because the wrong metrics feel good. Total registered users only goes up. Cumulative downloads only goes up. Page views, in aggregate, only go up. A founder can watch those numbers climb for eighteen months while the actual business quietly fails to retain anyone. The book's job is to interrupt that story with a number the founder cannot argue with.
Three structural ideas carry the whole thing. First, the One Metric That Matters (OMTM) — at any given moment there is one number that answers your riskiest open question, and a team focused on one number ships while a team focused on five does not. Second, the five-stage progression — Empathy, Stickiness, Virality, Revenue, Scale — where the OMTM changes as you advance and you don't advance until the current stage clears its bar. Third, the six business model frameworks — e-commerce, SaaS, free mobile app, media, user-generated content, and two-sided marketplace — each with a distinct metric stack, because retention means something different for a marketplace than for a game.
The reason a Summary of this book is still worth reading in 2026 rather than treating it as a period piece is that its vocabulary won. Every company running a "North Star Metric" process is running OMTM under a rebrand. Every product analytics tool — Amplitude, Mixpanel, Pendo, Heap — ships default dashboards built around cohort retention and funnel conversion rather than cumulative counts, which is the vanity-versus-actionable distinction encoded in software. The benchmark tables in Lines in the Sand seeded a genre; a16z, OpenView, and Bessemer benchmark reports are the direct descendants, even where the specific numbers have moved.

What the book is *not* is a statistics text. There is no experimental design chapter worth the name, no discussion of sequential testing or power calculations, and the sample sizes in its case studies are anecdotal. It is a book about strategy and organizational focus that happens to be denominated in metrics. Read it that way and it holds up; read it as a measurement methodology and you'll find it thin.
For RevOps specifically, the transfer is direct even though the book barely says "sales." The stage-gate logic maps onto pipeline maturity: don't build a comp plan around expansion before you've proven logo retention, don't hire SDRs against a channel you haven't shown converts, don't scale a segment whose CAC payback you haven't measured. The failure mode Croll and Yoskovitz call premature scaling is the same one that produces a bloated sales org attached to a leaky product.
Running the framework step by step
The book's operating loop is more specific than most summaries admit, and it's worth walking in order because skipping steps is where teams lose the thread.
Step one: name your business model honestly. This sounds trivial and isn't. A SaaS company with a self-serve motion and a SaaS company with a six-month enterprise cycle share a revenue label and almost nothing else operationally. A marketplace that takes a 15% cut behaves differently from one taking 3%. Companies with hybrid models — a media property with a subscription tier, a SaaS product with a transactional add-on — should pick the model that carries the majority of the risk right now, not the majority of the revenue.

Step two: locate your actual stage. Founders systematically place themselves one stage ahead of reality. The test is empirical, not aspirational: have you cleared the prior stage's line? If you cannot produce a retention curve that flattens, you are in Stickiness regardless of what your deck says about Scale.
Step three: pick the OMTM. Not derive, not discover — pick. Leadership chooses it deliberately based on the riskiest assumption at the current stage. Yoskovitz's own company Localmind used "questions answered within five minutes," which was really a liquidity measure for a Q&A marketplace: push-notification timing, onboarding copy, and moderator recruiting were all justified against that single number.
Step four: run it through the bullshit-metric filter. A good metric is comparative (better or worse than what?), understandable (the team can recite it), a ratio or rate rather than an absolute (ratios survive growth; totals hide decay), and behavior-changing (looking at it makes someone do something different tomorrow). Fail any of the four and it's noise.
Step five: draw the Line in the Sand before you measure. Commit to the threshold in advance. Post-hoc goalposts are how teams talk themselves into advancing on a number that didn't move.
Step six: instrument, review weekly, experiment, and gate. The recommended artifact is a one-page weekly review: OMTM at the top, the next three supporting metrics beneath, and a written note on what changed and why. The written commentary is the part teams drop first and the part that does the actual work — it forces someone to have a causal opinion rather than pointing at a chart.
The loop is deliberately circular. Advancing a stage does not end the process; it resets it with a new riskiest assumption. Teams that treat the framework as a one-time exercise get one good quarter out of it and then drift back to the fifty-metric dashboard.
Benchmarks, timelines, and what "good enough" costs

The Lines in the Sand chapters are the most photocopied pages in the book and also the ones that require the most care in 2026, because benchmarks age faster than frameworks.
What the book published. Croll and Yoskovitz put rough thresholds on the page: SaaS monthly churn under roughly 2%, e-commerce conversion in the low single digits with a meaningful share of repeat purchases, mobile 30-day retention that clears the mid-teens, marketplace take rates in the 5–20% band, ad-supported media CPMs in the low single-digit dollars with fill and viewability rates that make programmatic viable. LTV to CAC at 3:1 or better, with CAC payback inside about a year for subscription and considerably faster for transactional commerce. These weren't presented as laws — they were presented as the boundary between "keep iterating" and "you may proceed."
How they've drifted. Elite SaaS net revenue retention targets have climbed; where the book's era treated 110% as strong, current benchmark reports put the top decile meaningfully higher and treat 100% as merely not-bleeding. Mobile free-to-play economics shifted hard after platform-level attribution changes made paid install measurement far messier, and subscription monetization ate share from in-app purchase. Programmatic media CPMs compressed in most categories, which is a large part of why subscription and creator-direct models grew. Marketplace take rates held up better than almost anything else in the book.
Timelines to expect. The book compresses its own advice into roughly a hundred-day plan: first month, establish the OMTM and the lines; second month, instrument properly and get the weekly review running; third month, run experiments against the number; final stretch, hold a genuine stage-gate review. That cadence is realistic for the process work. It is *not* realistic for the outcomes — moving a retention curve is a multi-quarter effort, and any team that expects to fix stickiness in ninety days is going to mistake noise for progress.

The real cost line. Instrumentation is cheaper than it was in 2013 but not free. Product analytics tooling scales with event volume and monthly tracked users, so the bill grows precisely as you succeed; teams routinely get surprised when a growth spike doubles the analytics invoice. Budget analyst or data-engineer time as the larger cost — an unmaintained event taxonomy decays within two or three quarters as engineers ship new features without instrumenting them, and the dashboard silently stops describing the product. The recurring hidden expense in every metrics program is taxonomy maintenance, not software.
The opportunity cost nobody prices. Picking one metric means explicitly under-investing in everything else for a period. That is the point, and it is also genuinely expensive. If your OMTM is activation and a large enterprise deal needs a feature that does nothing for activation, the framework says the feature waits. Sometimes the framework is wrong about that. Croll and Yoskovitz's own hedge — the distinction between data-driven (the number decides) and data-informed (the number sharpens a judgment humans still own) — exists precisely to give you permission to override the metric when the situation warrants. They recommend data-informed. Teams that read the book as license for mechanical decision-making get worse outcomes than teams that never read it.
Where teams get it wrong
Picking a vanity metric and calling it an OMTM. The most common failure. Cumulative signups, total accounts created, followers, aggregate GMV — all of them go up whether or not the business works, all of them hide churn inside the denominator. The tell is that no one can name an action the number would trigger if it moved 10% either direction.
Skipping Empathy because qualitative work feels unrigorous. The first stage is deliberately not quantitative. Its outputs are interviews conducted, problems validated, and a defensible read on whether anyone actually has the pain you think they have. Founders with an engineering bias try to A/B test their way through this and end up optimizing a funnel into a product nobody wanted. You cannot instrument your way to problem-solution fit.

Turning on virality before stickiness holds. The book's leaky-bucket line is the most quoted sentence in it for good reason. Referral programs, invite loops, and paid acquisition all pour water into whatever container you've built. If the container leaks, spend accelerates the loss. The sequencing is not stylistic preference — it is arithmetic. A viral coefficient above 1 on a product with a collapsing retention curve produces a spike and then a cliff.
Confusing correlation with causation on the OMTM. Teams optimize the metric directly rather than the behavior it proxies for. If activation is defined as "completed onboarding step four," you will eventually find yourself removing steps one through three to move the number. The metric was a proxy for a user reaching value; the optimization destroyed the proxy relationship. Re-validate periodically that the OMTM still correlates with the outcome you care about.
Changing the OMTM too often — or never. Re-picking monthly means it was never a rallying point. Never re-picking means you're still optimizing activation eighteen months after activation stopped being the constraint. The stage gate is what sets the cadence: you change the number when you clear a line, not when you get bored.
Letting the weekly review become a status report. The one-page format degrades into a screenshot dump within about six weeks unless someone owns the written "what changed and why" section. That commentary is the mechanism; the chart is just evidence.
Applying startup benchmarks to a business that isn't one. An established company with a mature customer base and a services attach cannot use consumer-app retention thresholds. The Lines in the Sand were drawn for venture-scale startups seeking product-market fit. The book's own later chapters on applying this inside larger organizations reframe the metrics as proof-of-concept thresholds that unlock the next budget cycle — a different and more political game, where the OMTM has to be legible to a finance committee, not just a product team.

Instrumenting everything before deciding anything. The inverse failure of the fifty-metric dashboard: teams spend a quarter building a perfect event taxonomy and never get to the decision the data was supposed to inform. Pick the number first, instrument the minimum required to see it, expand later.
Choosing your model, stage, and metric
The practical question every reader arrives with is: what do I actually put on the wall tomorrow? The answer runs through model, then stage, then risk.
E-commerce splits into loyalty-oriented (customers return frequently, and repeat purchase rate within a defined window is the number) and acquisition-oriented (customers buy rarely, so conversion rate and contribution margin per order carry the weight). Getting this wrong is expensive — a business built on infrequent high-consideration purchases that chases repeat rate will invest in loyalty mechanics that its category cannot support.
SaaS runs activation first, then monthly retention, then net revenue retention and CAC payback. Activation — the share of signups who reach the moment where the product's value becomes obvious — is the highest-leverage and most commonly under-instrumented number in the entire category. Most SaaS companies can name their churn rate and cannot name their activation rate.
Free mobile lives on the DAU-to-MAU ratio and the D1/D7/D30 retention triple, then shifts to revenue per user and per paying user, with the paying share typically a small single-digit percentage of the base. This chapter aged the most; attribution changes at the platform level broke the paid-install math the book assumed.
Media runs engagement depth and return-visit rate, then monetization per session. The book's assumption of healthy programmatic economics is the part to discount hardest.

User-generated content works through the contribution funnel — visit, read, comment, contribute, moderate — with the 90-9-1 distribution as the planning assumption: the overwhelming majority lurk, a small slice contributes occasionally, a tiny fraction does the heavy lifting. Community health at scale is a moderation-capacity problem long before it's a growth problem.
Two-sided marketplaces are the sharpest chapter. The OMTM at stickiness is liquidity — the probability that a buyer's search finds a match in a reasonable window — not user count on either side. This framing anticipated a decade of marketplace investing orthodoxy, and it remains the fastest way to diagnose a marketplace that looks healthy on registrations and is dead on transactions.
The stage overlay then narrows further. In Empathy, your number is qualitative evidence gathered. In Stickiness, it's the shape of the retention curve — specifically whether it flattens at all, since a curve that flattens at a low level is a viable niche business while one that asymptotes to zero is not a business. In Virality, it's invite acceptance and the resulting coefficient, with the honest read being that most products land well below 1 and should treat viral as an assist to paid rather than a growth engine. In Revenue, it's the unit-economics ratio and payback period. In Scale, it's per-channel and per-segment economics, because the question changes from "does this work" to "which version of this works at volume."
What holds up and what has aged
Holds up. The OMTM discipline is the most-adopted metrics practice in modern growth, operating under the North Star label at most companies that have never heard of Croll or Yoskovitz. The vanity-versus-actionable distinction is now baked into tooling defaults rather than argued for. The six-model taxonomy remains the cleanest split anyone has published — most modern benchmark reports are variations on it. And the retention-before-growth sequencing has been independently re-validated by essentially every serious growth practitioner since, which is a stronger endorsement than any single citation.

Has aged. Product-led growth barely existed as a named motion in 2013, so PQL-to-paid conversion, self-serve expansion mechanics, and free-to-paid time-to-value have to be grafted onto the framework rather than found in it. The mobile chapter predates the attribution shakeup. The media chapter predates the subscription and creator-direct pivot that reshaped digital publishing economics. The instrumentation advice is entirely pre-AI — modern teams lean on analytics platforms with built-in anomaly surfacing and increasingly on LLM assistance to interrogate their own data, which changes the cost of asking a question but not the discipline of choosing which question matters.
The honest limitation. *Lean Analytics* is a book about focus wearing metrics clothing. Its case studies are illustrative rather than evidentiary, its benchmarks were assembled from a specific slice of the 2011–2013 venture landscape, and it offers no serious treatment of statistical rigor. None of that undermines the core contribution, because the core contribution was never "here is the correct number." It was "you are tracking too many numbers and lying to yourself about most of them, and here is a procedure for stopping." That procedure is still the fastest path from a cluttered dashboard to a decision.
Related questions
How does Lean Analytics differ from The Lean Startup?
Ries supplies the philosophy — build-measure-learn, validated learning, innovation accounting — without specifying measurements. Croll and Yoskovitz supply the instrumentation: which metric, for which business model, at which stage, against which benchmark. Read Ries for why, this for what to put on the dashboard.
Is the One Metric That Matters compatible with OKRs?
Yes, and they compose well. The OMTM works as the company-level key result that team OKRs ladder into, which prevents the common OKR failure of fifteen unrelated objectives competing for the same engineering capacity. The OMTM supplies the tiebreaker when two teams' objectives conflict.
Does this apply outside venture-backed startups?

Partly. The OMTM discipline and the vanity filter transfer anywhere, including bootstrapped businesses and internal corporate initiatives. The Lines in the Sand benchmarks do not — they were calibrated for venture-scale growth expectations and will read as failure to a healthy, slower-growing profitable business.
What should a RevOps team take from it?
The stage gate, mostly. Don't build comp plans around expansion before logo retention is proven, don't scale headcount against an unvalidated channel, and don't let pipeline volume metrics stand in for conversion and retention ratios. Premature scaling in sales looks identical to premature scaling in product.
How long does it take to see results from adopting OMTM?
Process adoption lands in about a quarter — picking the metric, instrumenting it, running weekly reviews. Outcome improvement takes longer; retention curves and unit economics move over multiple quarters. Expect the first visible win to be decision speed, not metric movement.
FAQ
How do I actually choose the One Metric That Matters?
Start from your riskiest unvalidated assumption, not from what's easiest to measure. Ask what would have to be true for the business to work, identify which of those things you're least sure about, and pick the number that most directly tests it. Then check it against the four properties: comparative, understandable, a ratio, and behavior-changing. If you can't name a decision the number would change, keep looking.
How do I tell a vanity metric from an actionable one?
Vanity metrics are cumulative and monotonic — they only go up, and they conceal decay inside the total. Actionable metrics are ratios or rates measured over a defined window, so they can get worse and tell you when they do. The practical test: if the number moved 15% tomorrow, would anyone do anything differently? If not, it's decoration.

Are the Lines in the Sand benchmarks still usable?
As directional guardrails, yes. As precise targets, no — they were drawn from an early-2010s venture cohort and several categories have shifted materially since, particularly SaaS retention expectations and mobile and media monetization. Use them to sanity-check whether you're roughly in range, then replace them with benchmarks from current industry reports and, better, from your own historical cohorts.
Do I have to move through the five stages in order?
Mostly, yes, and the sequencing is the book's strongest practical claim. Spending on growth before retention holds is the canonical way to burn a round. The defensible exception is a business with genuinely different mechanics — some enterprise sales motions establish revenue proof before broad engagement data exists — but you should be able to articulate why your case is exceptional rather than assuming it.
What if my business fits two of the six frameworks?
Hybrids are common; a media property with subscriptions or a marketplace with a SaaS layer are both normal. Pick the model that carries the majority of your current risk rather than the majority of your revenue, run its metric stack as primary, and track the secondary model's key ratio as a supporting metric. Revisit the choice at each stage gate.
Should I read this if I've already read Running Lean?
Yes — they're complementary rather than redundant. Maurya's book is about validating a business model hypothesis through structured experiments and customer conversations. This one is about what to measure once you have something running. Running Lean gets you to a testable model; Lean Analytics tells you whether the model is working and when you're allowed to advance.
Sources
- https://leananalyticsbook.com/
- https://www.oreilly.com/library/view/lean-analytics/9781449335687/
- https://www.solutionsiq.com/resource/blog-post/lean-analytics-alistair-croll-benjamin-yoskovitz/
- https://a16z.com/16-startup-metrics/
- https://openviewpartners.com/blog/product-led-growth-benchmarks/
- https://www.bvp.com/atlas/state-of-the-cloud
- https://www.sequoiacap.com/article/pmf-framework/
- https://hbr.org/2013/05/why-the-lean-start-up-changes-everything
- https://www.lennysnewsletter.com/p/how-the-biggest-consumer-apps-got-their-first-1000-users
- https://amplitude.com/blog/north-star-metric
Related on PULSE
This page will be disappearing soon. Save it to your device for $1 — or read it free while it is here.
@Kory-White- · if Venmo asks, the last 4 of my number are 2012
This page is gone.
This one is off the shelf now. $1 keeps it on your phone for good — the whole page, pictures and diagrams included.
 pulse-recentCrossing the Chasm by Geoffrey Moore — Top 10 Key Takeaways for Sales Leaders in 2027
 pulse-recentWhat is the first concrete step in Sandler Rule #4 for a sales leader to implement in 2027?
 pulse-recentSandler Rule #1: What is the first concrete step to build a prospect's trust in a sales conversation in 2027?
 pulse-recentSales EQ by Jeb Blount — Top 10 Key Takeaways for Sales Leaders in 2027
 book-summaryWhat factors drive the price of Book Summaries up or down in 2027?
 pulse-recentWhat is the second concrete step in Strategic Selling by Miller Heiman for identifying a sales coach in 2027?
 pulse-recentThe Collaborative Sale by Keith Eades — Top 10 Key Takeaways for Sales Leaders in 2027
 pulse-recentThe Greatest Salesman in the World by Og Mandino — Top 10 Key Takeaways for Sales Leaders in 2027
 pulse-recentObviously Awesome by April Dunford — Top 10 Key Takeaways for Sales Leaders in 2027
 pulse-recentWhat is the first concrete step in The Sandler Rules by David Mattson for building a sales plan in 2027?