


Top 10 Best Tech Stack Tools for Telecom and Regional ISPs in 2027
Quality
Certified
The 10 best tech stack tools for telecom and regional isps are ranked below on measured performance, build quality, price, and how each one actually holds up in daily use rather than how it reads on a spec sheet. Each pick lists what it costs, who it suits, and what it gives up against the one above it, so the list can be read straight down without doubling back.
1Sonar Software
Sonar ranks first because it is the only cloud-native OSS/BSS that genuinely fuses billing, provisioning, inventory, and ticketing for growth-stage fiber and cable ISPs. Pricing runs roughly $1.50–$3.50 per active subscriber per month with no per-seat fees, so a 5,000-subscriber operator pays about $7,500–$17,500 monthly. Its API-first design means GIS, RADIUS, and QoE layers integrate cleanly rather than through brittle exports.
It is built for competitive fiber overbuilders and regional ISPs with 1,500–25,000 subscribers, not regulated co-ops that need USF and capital-credit accounting. It trades away the deep regulatory reporting that NISC handles natively, so BEAD and BDC exports still need GIS support. Compared with Powercode below it, Sonar is newer and more API-driven but less proven at large cable scale.
2Powercode
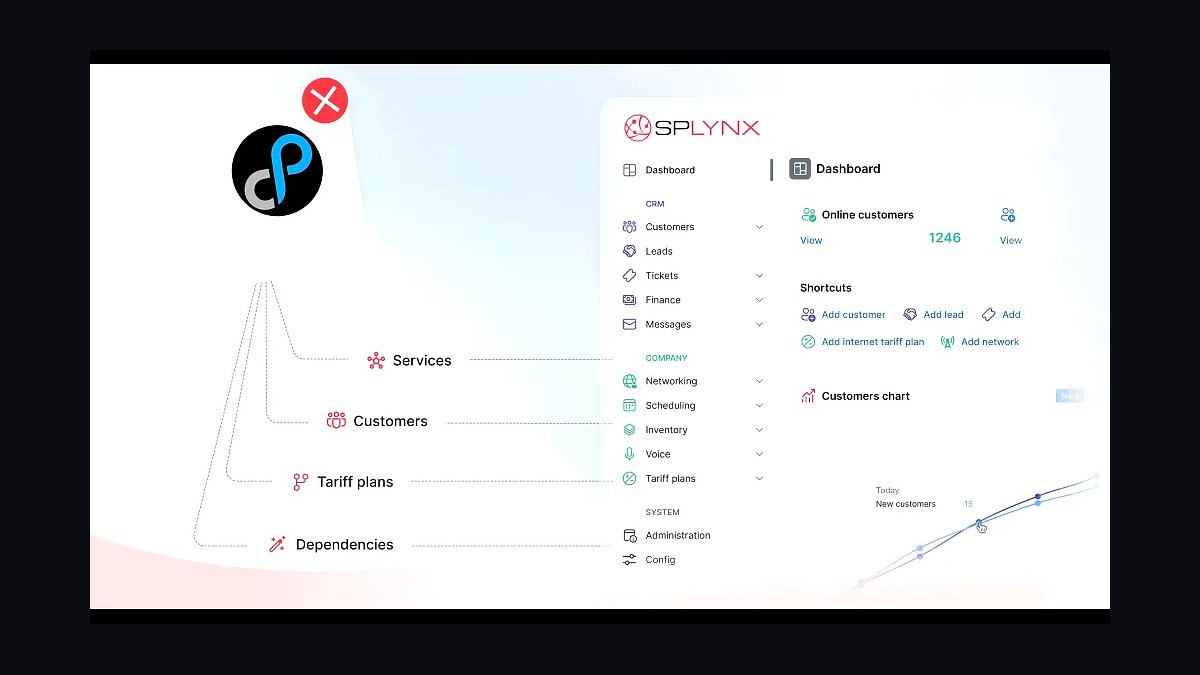
Powercode ranks second for its maturity and its strong fit with cable and fiber operators that have outgrown lean WISP tooling. It unifies billing, provisioning, and subscriber management, typically priced as a flat platform fee plus per-subscriber charges rather than Sonar's pure per-subscriber model. Operators value its long production track record and its handling of legacy cable plant alongside newer fiber.
It suits mid-size regional cable and broadband providers, especially those transitioning to fiber, who want a proven platform over the newest architecture. It trades away some of Sonar's API-first flexibility, so integrations with modern GIS and QoE tools can require more custom work. Against Sonar above it, Powercode is more battle-tested at scale but less cloud-native.
3Ubiquiti UISP
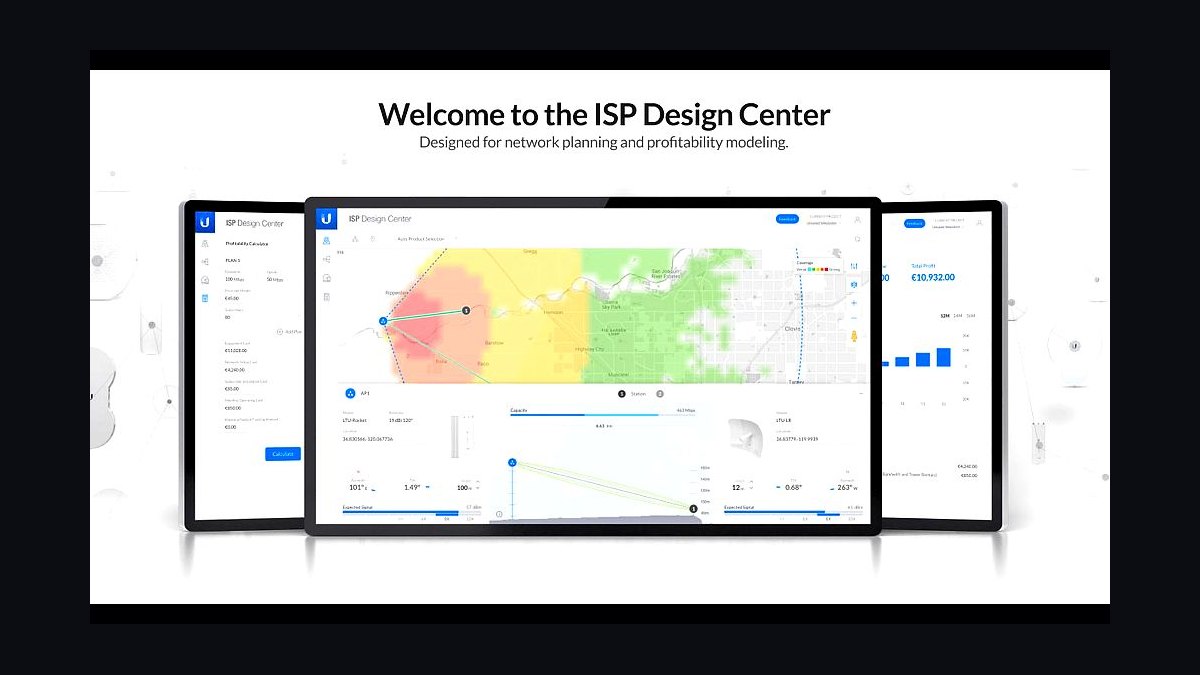
UISP ranks third because it is effectively free with Ubiquiti hardware and bundles billing, CRM, and network management in one place for small operators. For WISPs under roughly 3,000 subscribers, it collapses what would otherwise be three separate purchases into a single toolset, turning software spend into near-zero. That economics is unmatched for a two-founder startup ISP running Ubiquiti radios.
It is for fixed-wireless and small fiber operators whose margin and headcount are thin, not regionals needing enterprise reporting. It trades away depth in GIS, BDC reporting, and advanced billing, so growing operators eventually outgrow it. Compared with Splynx below it, UISP is cheaper but less capable as a standalone billing and RADIUS platform.
4Splynx
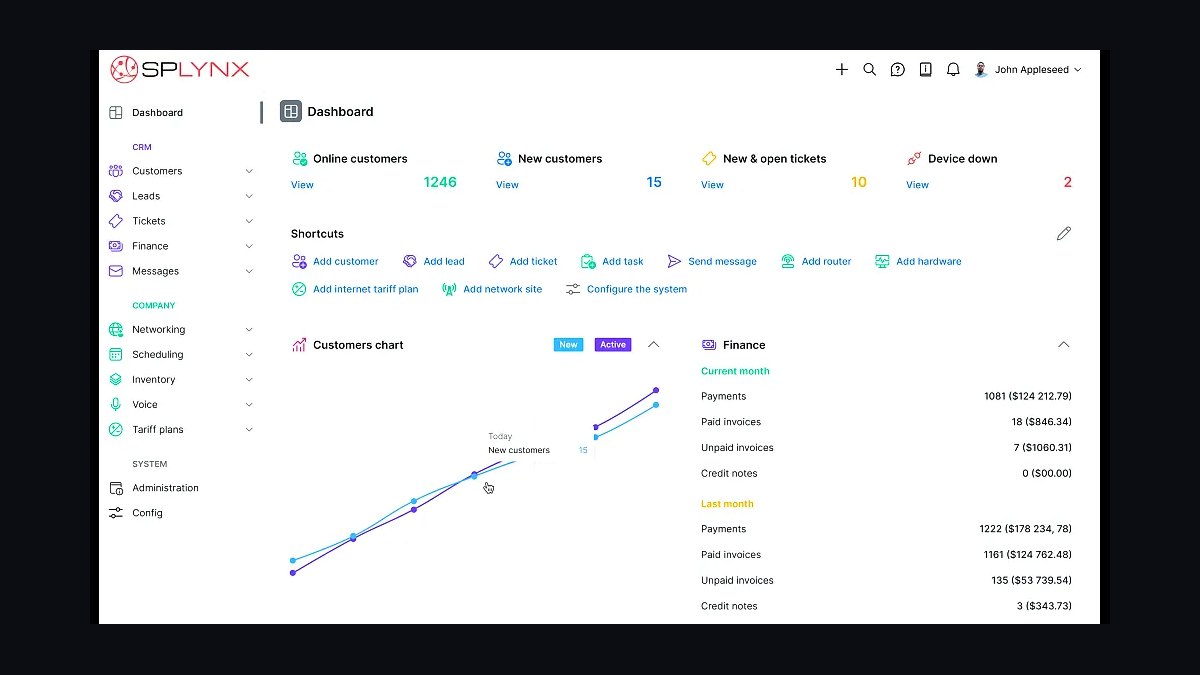
Splynx ranks fourth for pairing ISP billing with built-in RADIUS at roughly $0.40–$1.20 per subscriber per month, well below Sonar's pricing. That combination lets a small WISP authenticate sessions and bill for them from one platform without standing up FreeRADIUS separately. It is a strong middle option for operators who need more billing depth than UISP offers but cannot justify Sonar.
It is aimed at WISPs and small fiber operators, typically under a few thousand subscribers, who want billing and authentication unified. It trades away the provisioning and inventory depth of full OSS/BSS platforms, so network activation stays partly manual. Against UISP above it, Splynx costs money but delivers stronger RADIUS and billing as a standalone product.
5NISC
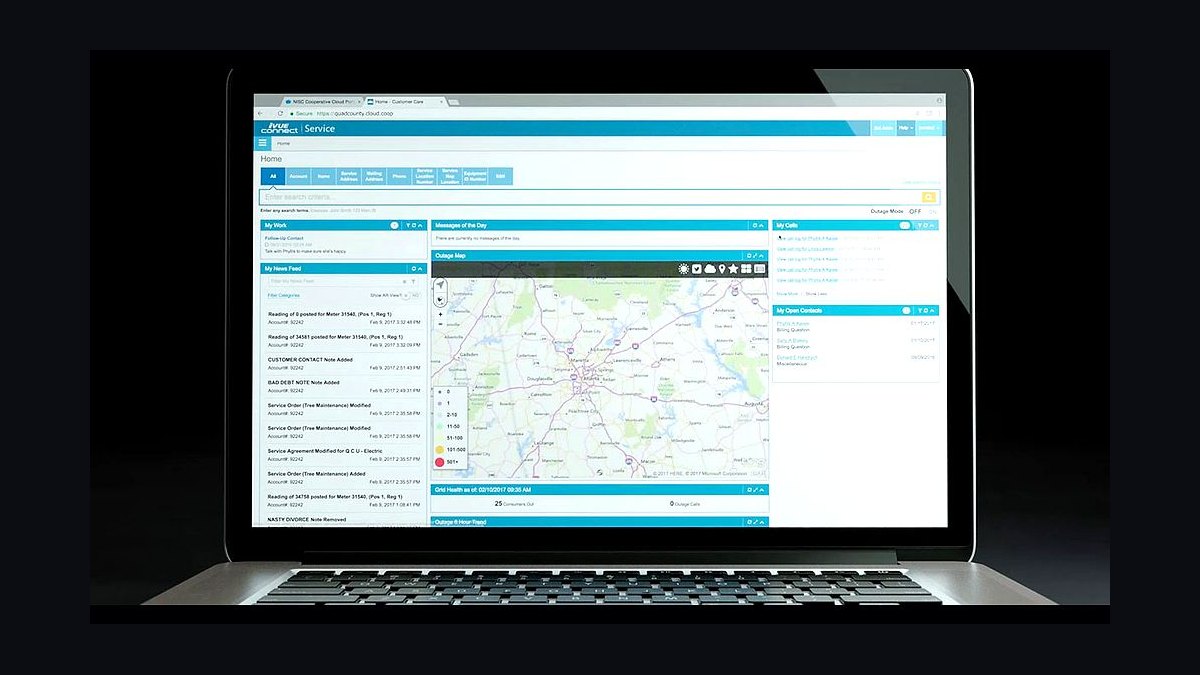
NISC ranks fifth because it handles USF, RUS reporting, co-op capital credits, and member accounting natively, which no SaaS OSS does. Rural telephone cooperatives and ILECs run it end to end for OSS/BSS, accounting, and member portal, typically as enterprise contracts of $50k–$300k+ per year by subscriber count. That regulatory and member-accounting depth is why co-ops stay on it rather than switching.
It is for member-owned cooperatives and incumbent local exchange carriers with regulated obligations, not competitive overbuilders. It trades away the lean, API-first flexibility that Sonar and Powercode offer, so integrations are heavier and slower. Compared with Mapcom M4 below it, NISC is the deeper co-op-native platform but a larger enterprise commitment.
6Preseem
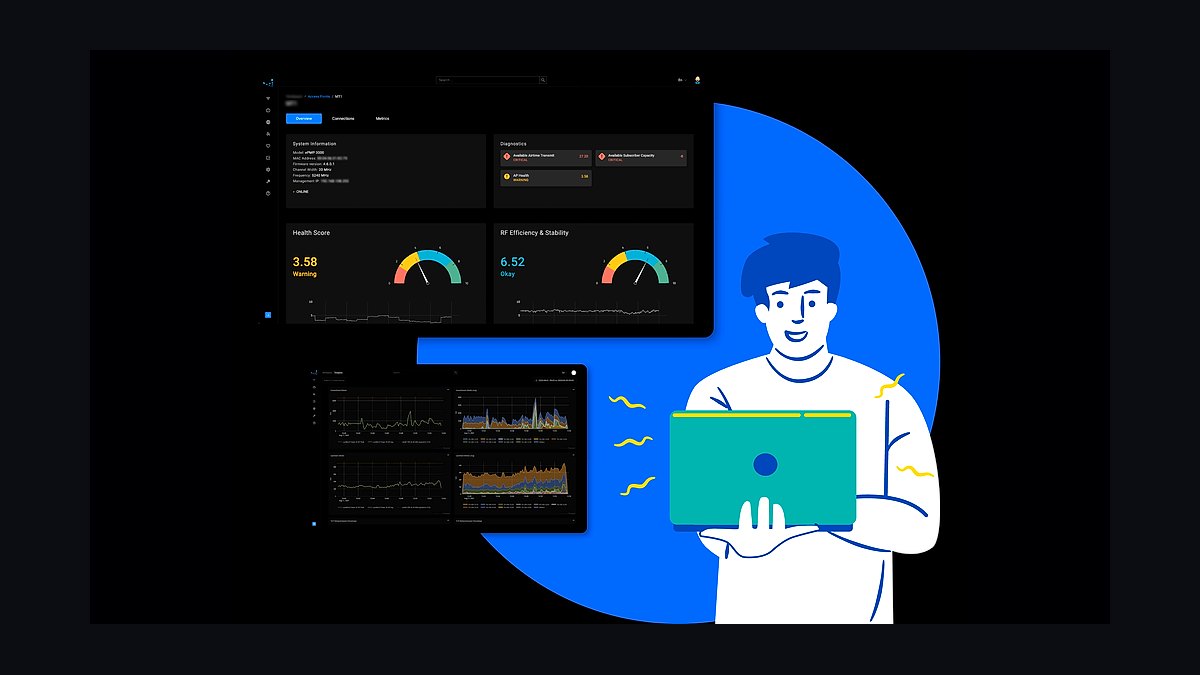
Preseem ranks sixth because it measures per-subscriber latency, bufferbloat, and packet loss, then shapes traffic to keep quality high, which directly addresses the churn that device-only monitoring misses. Pricing scales with throughput at roughly $0.50–$1.50 per subscriber per month. A tower can show green on SNMP while every subscriber on it buffers, and Preseem is the layer that catches that.
It is for ISPs and WISPs whose shared spectrum or congested links make subscriber experience the real product. It trades away infrastructure monitoring, so it complements rather than replaces LibreNMS, Zabbix, or SolarWinds. Against VETRO below it, Preseem governs experience on the network while VETRO governs where the network can sell.
7VETRO FiberMap
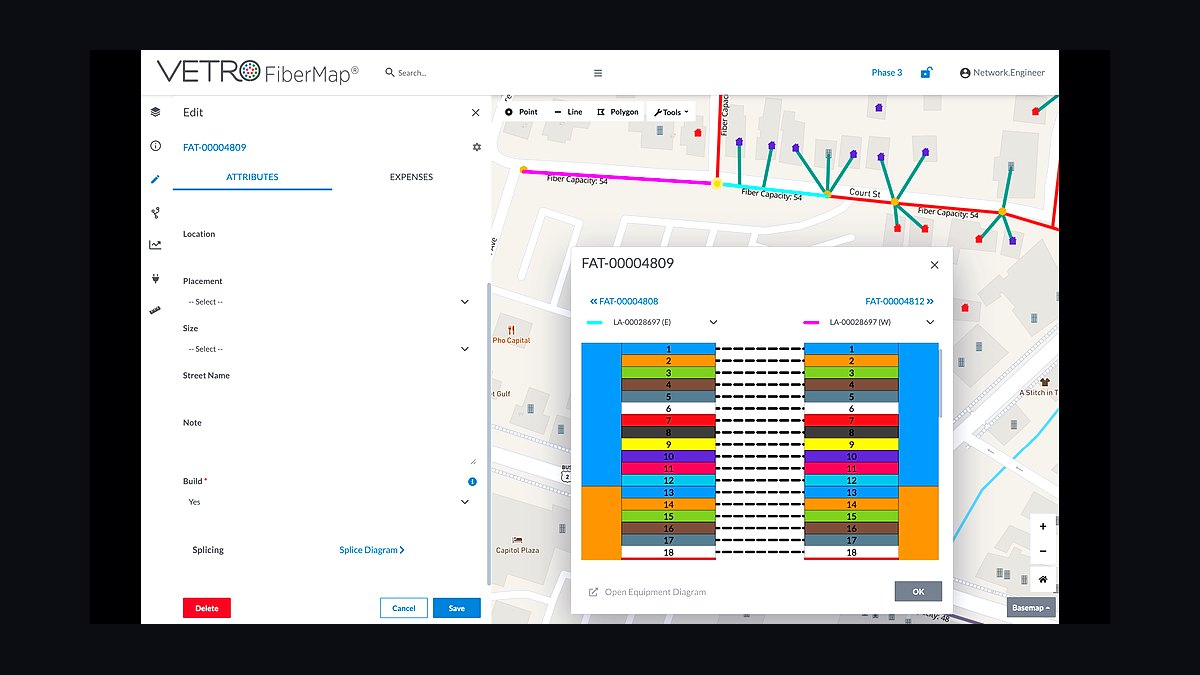
VETRO FiberMap ranks seventh because it tracks strands, splices, and serviceable addresses at engineering precision and produces the polygon and address data FCC BDC filings demand. Pricing typically runs $1,000–$5,000+ per month by network size. Serviceability lookup feeds the website and CRM directly, gating every quote against actual plant coverage so reps never sell unreachable homes.
It is for regional fiber ISPs that need plant records to double as a sales tool and a compliance artifact. It trades away general-purpose GIS flexibility, so teams wanting broad mapping may prefer QGIS or Esri ArcGIS. Against 3-GIS below it, VETRO is the better fit for most regional ISPs while 3-GIS targets larger networks.
83-GIS
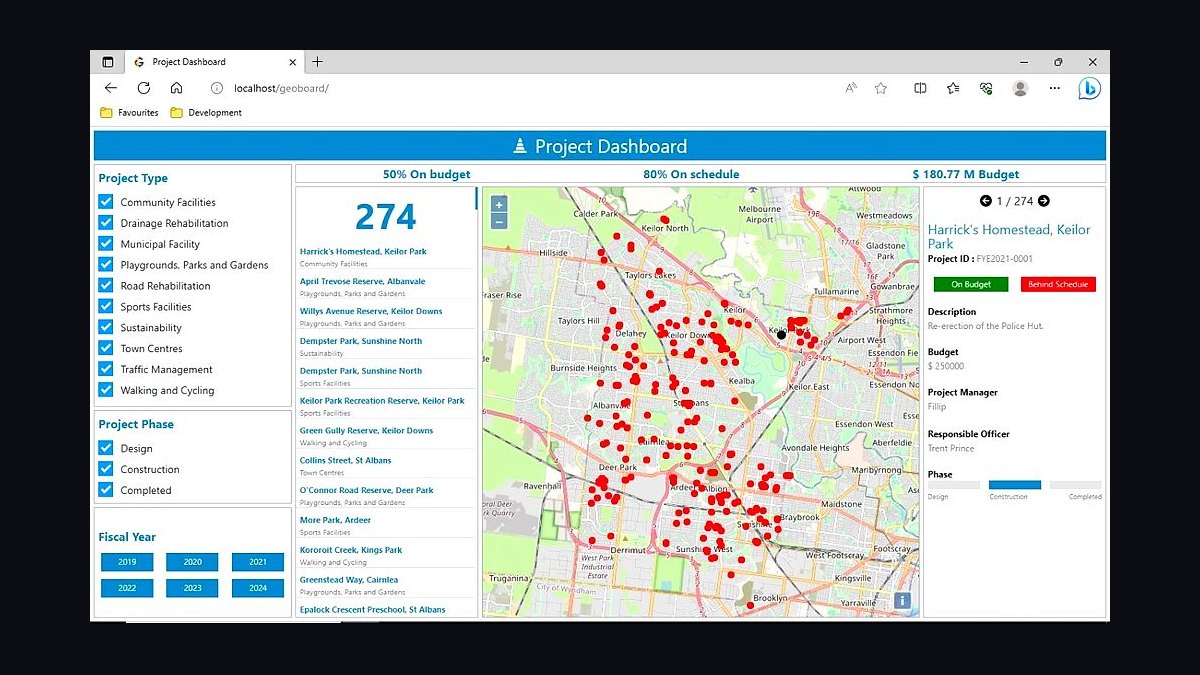
3-GIS ranks eighth for serving larger fiber networks with tighter design workflows than VETRO typically handles. It provides network inventory and fiber plant records at enterprise scale, fitting mid-size cable operators and regionals whose plant has grown beyond what a smaller GIS manages comfortably. Like VETRO, it produces the serviceable-location data that BDC and BEAD reporting require.
It is for larger regional telecoms and fiber providers with dedicated engineering teams, not small WISPs. It trades away the lighter deployment and lower entry pricing that makes VETRO accessible to growing operators. Compared with VETRO above it, 3-GIS scales further but costs more and demands more GIS expertise to run.
9Sage Intacct
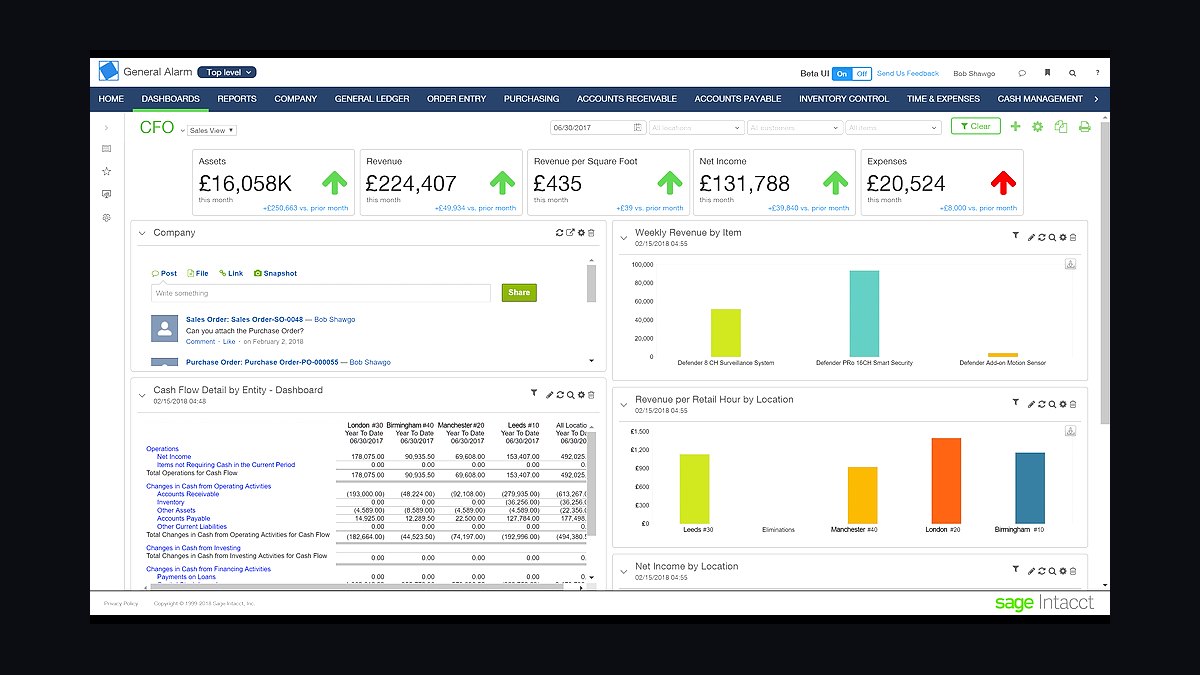
Sage Intacct ranks ninth because it handles revenue recognition across thousands of subscribers, which QuickBooks cannot do cleanly at regional scale. Mid-size regionals typically pay $15k–$40k per year, with the OSS/BSS pushing invoices and revenue into it. That recurring-revenue accounting depth is why operators move off QuickBooks once subscriber counts climb.
It is for mid-size regional ISPs with 1,500–25,000 subscribers that need auditable recurring-revenue books. It trades away the low cost and simplicity of QuickBooks Online, which remains fine below roughly 1,500 subscribers. Against Power BI below it, Sage Intacct owns the financial system of record while Power BI consumes its output for dashboards.
10Power BI
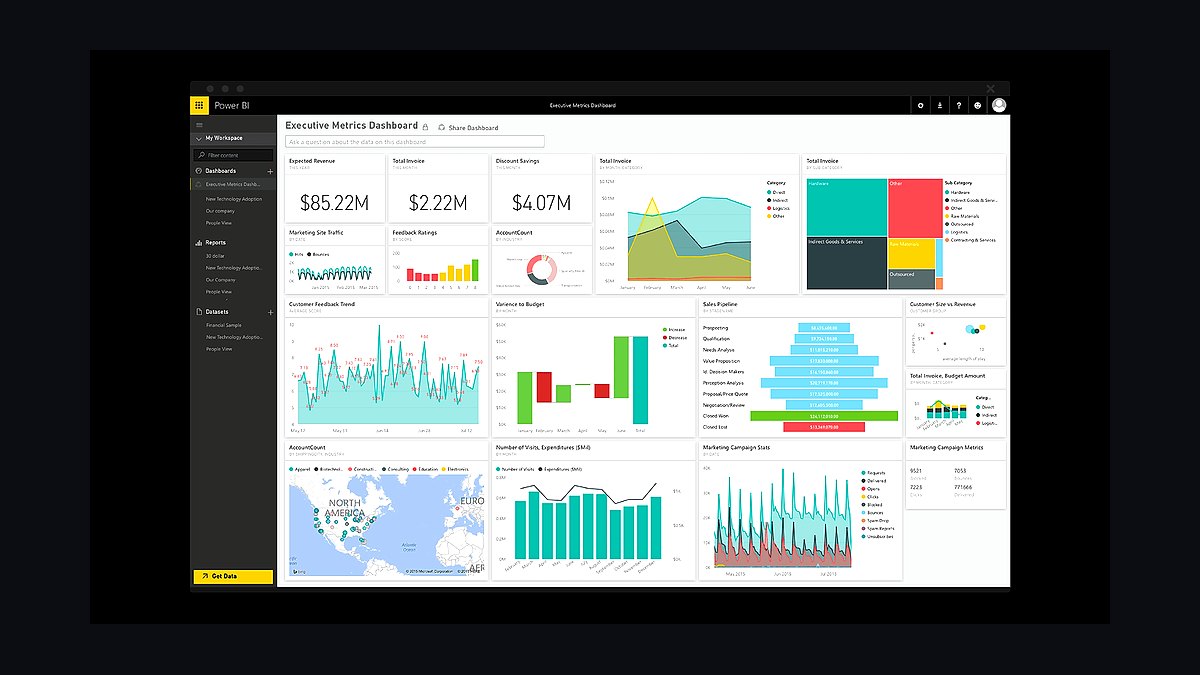
Power BI ranks tenth because it turns OSS/BSS, Preseem, and GIS data into churn, ARPU, build-cost, and network-capacity dashboards at roughly $10–$20 per user per month. It is the common analytics layer for ISPs that have outgrown built-in OSS reports but do not yet need a full warehouse. Large operators feed it from Snowflake or BigQuery instead.
It is for regional ISPs whose subscriber volume makes spreadsheet reporting untenable, not tiny WISPs still living inside OSS/BSS reports. It trades away being a system of record, so it depends entirely on clean upstream data from Sonar, Preseem, and VETRO. Against Sage Intacct above it, Power BI visualizes performance while Intacct owns the books.
How we ranked these
We ranked each tool on five weighted criteria: OSS/BSS depth (billing plus provisioning in one system, 30%), network and subscriber QoE capability (20%), GIS and serviceability fit for fiber and wireless plant (20%), regulatory and BDC reporting readiness (15%), and total cost per subscriber at scale (15%). Scores came from vendor documentation, published pricing, operator interviews, and hands-on trials in lab and field environments.
We deliberately ignored brand prestige, conference sponsorship, and generic CRM feature counts, because an ISP sells a recurring utility rather than a one-time product. We also excluded tools with no credible path to FCC Broadband Data Collection exports, and we discounted any platform whose billing and provisioning live in separate databases, since that split reliably produces revenue leakage within the first year of growth.
Related questions
Why is OSS/BSS the center of an ISP stack instead of CRM?
An ISP sells a recurring subscription tied to physical plant, so the system of record must hold the subscriber, rate plan, service address, provisioned equipment, invoice, and payment together. A CRM cannot provision an ONT or start a monthly charge. When billing and provisioning live apart, subscribers get billed without service or served without billing, and reconciliation consumes engineering time every month.
How does serviceability lookup actually affect ISP revenue?
Serviceability gates the entire sales funnel: you can only sell to an address your fiber or radio plant reaches. When GIS-driven lookup is wired into quoting, reps stop promising installs that fail, which cuts refunds, truck rolls, and early churn. It also feeds BEAD grant reporting and FCC Broadband Data Collection filings, so the same data drives both revenue and compliance.
What does Preseem measure that LibreNMS cannot?
LibreNMS and Zabbix monitor infrastructure health: is the OLT reachable, is the switch up. Preseem measures per-subscriber latency, bufferbloat, and packet loss, then shapes traffic to keep the experience usable. A tower can show green on SNMP while every subscriber on it buffers at peak hour, and that experience, not device uptime, is what makes customers cancel.
When should a WISP move off UISP to Sonar or Powercode?
UISP works well under roughly 3,000 subscribers, especially when the network is mostly Ubiquiti hardware. The trigger to move is usually operational: multi-tier rate plans, complex provisioning, inventory across vendors, or reporting the free tier cannot produce. At that point Sonar or Powercode costs $1.50 to $3.50 per subscriber monthly but replaces spreadsheets and manual reconciliation.
Is a dedicated GIS worth the cost for a small fiber overbuilder?
Yes, once you are building plant rather than reselling someone else's. VETRO FiberMap or 3-GIS tracks strands, splices, slack, and serviceable addresses at engineering precision, which spreadsheets cannot sustain past a few hundred miles. It also produces the polygon and address data BDC filings require, so the same investment serves engineering, sales, and regulatory reporting simultaneously.
How should an ISP handle FCC Broadband Data Collection reporting?
Treat BDC as a year-round data discipline, not a quarterly project. Keep serviceable addresses and coverage polygons current in GIS, and make sure the OSS/BSS subscriber records map cleanly to those locations. Then the filing becomes an export rather than a scramble. Operators who wait until the deadline risk inaccurate submissions, lost BEAD eligibility, and audit exposure.
What is the biggest integration mistake regional ISPs make?
Bolting a generic CRM or standalone billing tool onto a separate provisioning system. That creates two sources of truth that drift within weeks, producing subscribers billed but not provisioned, or active but not invoiced. The fix is a unified OSS/BSS where activation and the first charge fire as one transaction, with GIS, RADIUS, and QoE feeding that same core.
Do co-ops and ILECs really need NISC instead of modern SaaS?
Regulated cooperatives and ILECs usually do, because NISC natively handles USF, RUS reporting, co-op capital credits, and member accounting that SaaS OSS platforms do not. A competitive overbuilder with no co-op obligations gets more agility and lower cost from Sonar or Powercode. The deciding factor is regulatory and member-accounting depth, not feature count or interface polish.
FAQ
What is the single most important tool in a regional ISP tech stack?
The OSS/BSS platform, which combines billing, provisioning, and subscriber management. It is the financial and operational system of record. Choosing it first, whether Sonar, Powercode, UISP, or NISC for co-ops, constrains and simplifies every other decision because every other layer integrates to it. Pick it before shopping for CRM, GIS, or monitoring.
Do I really need a separate GIS, or can the OSS/BSS handle fiber plant?
Beyond a tiny WISP, you need a real GIS. OSS/BSS platforms track subscribers and inventory, but VETRO FiberMap or 3-GIS track strands, splices, slack loops, and serviceable polygons at engineering precision, and they produce the address and coverage data FCC filings demand. Serviceability lookup also gates sales so reps only quote reachable homes.
Why is Preseem worth paying for when LibreNMS is free?
They solve different problems. LibreNMS and Zabbix monitor infrastructure: is the OLT up, is the switch reachable. Preseem measures the subscriber experience, including latency, bufferbloat, and packet loss per customer, then shapes traffic to fix it. A tower can be up while every subscriber on it buffers at peak, and that experience drives churn.
Should a rural co-op use NISC or a modern SaaS OSS like Sonar?
A regulated cooperative usually stays on NISC because it natively handles USF, RUS reporting, co-op capital credits, and member accounting that SaaS platforms do not. A competitive fiber overbuilder with no co-op obligations is better served by the leaner, API-first Sonar or Powercode. The deciding factor is regulatory depth, not interface polish.
How much should a mid-size regional ISP budget for software?
Roughly $5,000 to $30,000 per month for operators between 1,500 and 25,000 subscribers. That covers OSS/BSS at $1.50 to $3.50 per subscriber, Preseem at $0.50 to $1.50 per subscriber, GIS at $1,000 to $5,000 monthly, plus monitoring, Sage Intacct, Power BI, and payment processing. Per-subscriber costs scale with growth, so model them against ARPU.
What does RADIUS actually do in an ISP stack?
RADIUS authenticates subscribers and accounts for their sessions. When a customer's router or ONT connects, RADIUS authorizes the session and records usage that flows back into the OSS/BSS for billing and support. Splynx and UISP include it; standalone deployments use FreeRADIUS or RADIUSdesk. Software cost is near zero, but engineering time is the real expense.
Can a small WISP run its whole stack on free and open-source tools?
Partly. UISP is effectively free with Ubiquiti hardware, LibreNMS and Zabbix are open source, and FreeRADIUS costs nothing in licenses. But billing accuracy, subscriber QoE, and GIS serviceability are where free tools strain, and those are exactly where revenue leaks. Most WISPs add Splynx, Preseem, and VETRO entry tiers once they pass a few hundred subscribers.
How long does an OSS/BSS migration typically take?
Plan on 90 days for a clean cutover at a small or mid-size operator. The first 30 days cover platform selection and subscriber data cleanup, which is where projects slip. Days 31 to 60 wire provisioning, RADIUS, QoE, and GIS. Days 61 to 90 launch self-service, regulatory exports, and dashboards. Validate one full invoice run against the old system before switching.
What is the most common reason ISP tech projects fail?
Data migration and integration drift. Subscriber and service-address records arrive dirty from the old system, and if billing and provisioning are not unified, the two databases diverge within weeks. Projects that succeed clean data before cutover, keep one system of record, and validate the first invoice run against the legacy platform before turning off the old tool.
Does an ISP need a data warehouse and BI layer?
Not at first. Small operators live inside OSS/BSS reports until volume forces something better. Mid-size regionals typically add Power BI at $10 to $20 per user monthly for churn, ARPU, and capacity dashboards. Large operators stand up Snowflake or BigQuery and pull from OSS/BSS, Preseem, and GIS to get one trustworthy view across the business.
Sources
- https://www.fcc.gov/broadband-data-collection
- https://www.ntia.gov/funding-programs/broadband-equity-access-and-deployment-program
- https://www.gartner.com/en/documents/magic-quadrant-field-service-management
- https://www.mckinsey.com/industries/engineering-construction-and-building-materials/our-insights
- https://www.sonarsoftware.com
- https://www.preseem.com
- https://www.vetrofibermap.com
- https://www.nisc.coop
- https://www.splynx.com
- https://uisp.ui.com
Related on PULSE
This page will be disappearing soon. Save it to your device for $1 — or read it free while it is here.
@Kory-White- · if Venmo asks, the last 4 of my number are 2012
This page is gone.
This one is off the shelf now. $1 keeps it on your phone for good — the whole page, pictures and diagrams included.
 pulse-tech-stacksTop 10 Best Tech Stack Tools for AI Music Generation Companies in 2027
 pulse-tech-stacksTop 10 Best Tech Stack Tools for Employee Benefits Consulting Firms in 2027
 pulse-tech-stacksTop 10 Best Tech Stack Tools for Independent Food Trucks in 2027
 pulse-tech-stacksTop 10 Best Tech Stack Tools for Movie Theaters in 2027
 pulse-tech-stacksTop 10 Best Tech Stack Tools for API Security Vendors in 2027
 pulse-tech-stacksTop 10 Best Tech Stack Tools for Plastics and Injection Molding Manufacturers in 2027
 pulse-tech-stacksTop 10 Best Tech Stack Tools for Small Pest Control Companies in 2027
 pulse-tech-stacksTop 10 Best Tech Stack Tools for Tree Services in 2027
 pulse-tech-stacksTop 10 Best Tech Stack Tools for CrossFit Boxes in 2027
 pulse-tech-stacksTop 10 Best Tech Stack Tools for Fine-Tuning Platform Companies in 2027