


How do you calculate rep capacity across a sales team in 2027?
Quality
Certified

To calculate rep capacity across a sales team in 2027, divide total available selling hours by the time required per deal cycle, then multiply by average deal size and win rate, adjusting for ramp time, attrition, and non-selling activities that typically consume 40-60% of a rep's week.
The outcome you should expect
When you calculate rep capacity correctly for a 2027 sales team, the primary outcome is a reliable, defensible revenue forecast that aligns headcount investment with market opportunity. Instead of guessing how many reps you need to hit a $50 million target, you produce a model that shows exactly how many fully ramped, productive sellers are required, given your specific deal complexity, sales cycle length, and conversion metrics. This capacity calculation directly informs hiring plans, territory design, quota setting, and compensation budgets. A properly built capacity model also surfaces the gap between current headcount and the number of productive reps you actually have, accounting for the fact that new hires typically take 3-6 months to reach full productivity. In practice, most sales organizations discover they have 15-30% less effective capacity than their headcount suggests, because ramp time, attrition, and administrative overhead consume significant portions of available selling time.
The capacity calculation fundamentally changes how leadership thinks about growth. Rather than setting a revenue number and back-solving into a headcount figure that feels right, you build a bottom-up model that respects the real constraints on each rep's time. For a team targeting $100 million in annual recurring revenue with an average deal size of $50,000, a 30% win rate, and a 90-day sales cycle, the calculation reveals you need roughly 67 fully productive reps working at full capacity. But when you layer in a 20% attrition rate and a 4-month ramp period for new hires, the actual headcount required jumps to approximately 92 people to maintain that 67 productive rep baseline throughout the year. This mismatch between theoretical and practical capacity is the single most common reason revenue plans fail.

The outcome also includes a clear picture of where your team is over- or under-resourced. A rep capacity model broken down by segment, region, or product line shows which areas have surplus selling time and which are stretched thin. This allows you to rebalance territories, adjust quotas, or redirect marketing spend before you miss a quarter. Organizations that run this calculation quarterly rather than annually see 10-15% higher forecast accuracy because they can respond to changes in deal velocity, rep productivity, and market conditions in near real time.
What drives that outcome
The core drivers of rep capacity fall into three categories: time availability, deal economics, and team dynamics. Time availability starts with the calendar — 52 weeks minus vacation, holidays, training, and internal meetings leaves roughly 40-44 weeks of actual selling time per year. Within those weeks, research from sales performance platforms consistently shows that reps spend only 30-40% of their working hours on direct selling activities like prospecting, demos, and negotiations. The remaining 60-70% goes to administrative tasks, internal meetings, CRM data entry, compliance training, and ad-hoc requests from management. This ratio has worsened over the past five years as tool complexity and reporting requirements have increased, making time allocation the most impactful lever in any capacity calculation.

Deal economics determine how that available selling time converts into revenue. The key inputs are average deal size, win rate, and sales cycle length. A rep selling $100,000 enterprise deals with a 25% win rate and a 120-day cycle needs to manage roughly 4 active opportunities at any given time to maintain pipeline velocity. Compare that to a rep selling $10,000 SMB deals with a 40% win rate and a 30-day cycle, who needs to manage 25-30 active opportunities simultaneously. The capacity model must reflect these differences at the individual rep level, not as team averages, because mixing enterprise and SMB motions in the same calculation produces meaningless results. The most sophisticated capacity models in 2027 use deal-stage conversion rates rather than overall win rates, because stage-by-stage analysis reveals bottlenecks that aggregate numbers hide.
Team dynamics include ramp time, attrition, and span of control. New reps typically take 3-6 months to reach full productivity, with the first 60 days almost entirely consumed by training and onboarding. During this period, their capacity contribution is effectively zero, yet they count as headcount in every budget spreadsheet. Attrition compounds this problem — if your team turns over at 25% annually, you lose one in four productive reps every year, and the replacements take months to contribute. Span of control matters because each first-line manager can effectively coach 6-8 reps; beyond that, coaching quality degrades, which directly reduces rep productivity by 10-20% according to multiple sales effectiveness studies. These dynamics mean a capacity model built on static headcount numbers will always overstate what the team can actually deliver.
Benchmarks and realistic ranges

Industry benchmarks for rep capacity vary significantly by sales motion, but several data points have remained consistent across the past three years of sales operations surveys. The median fully loaded cost of a sales rep in enterprise software is approximately $180,000-$220,000 annually, including salary, commission, benefits, and overhead. The median quota-to-cost ratio targets 4:1 to 5:1, meaning a rep costing $200,000 should produce $800,000 to $1 million in annual revenue. This ratio has compressed from 6:1 in 2020 as tooling costs and compensation expectations have risen, making capacity efficiency more critical than ever.
For inside sales teams handling transactions under $25,000, a productive rep typically closes 8-12 deals per month with a 30-40% win rate, generating $200,000-$300,000 in monthly revenue at full capacity. These reps spend 35-40 hours per week on selling activities and manage 40-60 active opportunities in their pipeline. For field sales teams handling enterprise deals over $100,000, a productive rep closes 2-4 deals per quarter with a 20-30% win rate, generating $400,000-$800,000 in quarterly revenue. These reps spend 25-30 hours per week on selling activities due to travel and internal coordination demands, and they manage 15-25 active opportunities.
The most commonly overlooked benchmark is the relationship between pipeline coverage and capacity. A healthy pipeline should be 3-5x the revenue target at any given time, but many teams carry pipeline that is 6-10x because they lack the capacity to progress deals efficiently. When you calculate rep capacity correctly, you can determine the optimal pipeline size for your team — typically 4x target for teams with 25% win rates and 3x target for teams with 35%+ win rates. Carrying more pipeline than your capacity can support is a sign that your team is overworked or that your qualification criteria are too loose, both of which degrade win rates and lengthen sales cycles.

Attrition benchmarks provide another critical sanity check for capacity models. Industry average sales rep turnover hovers around 20-25% annually, with the first 90 days being the highest risk period. Organizations with strong onboarding programs and manager coaching see turnover drop to 12-15%, which directly increases effective capacity by 8-10% without adding headcount. The cost of replacing a rep is estimated at 1.5-2x their annual compensation when you account for recruiting fees, training costs, and lost productivity during the ramp period. Reducing attrition by 5 percentage points in a 100-person team saves roughly $1.5-$2 million annually while increasing capacity by 3-5 full-time equivalent reps.
Risks, edge cases, and failure modes
The most common failure mode when calculating rep capacity is treating all reps as identical units. A team of 50 reps is not 50 times the capacity of one rep — it is a distribution of productivity levels that typically follows a power law curve. The top 20% of reps often produce 40-50% of total revenue, while the bottom 20% produce 5-10%. Building a capacity model on average productivity numbers will overstate capacity by 15-25% because it assumes every rep operates at the mean, when in reality most reps operate below it. The correct approach is to model capacity at the individual territory level, using historical performance distributions rather than averages.

Another major risk is ignoring the impact of deal concentration. If 30% of your revenue comes from 5% of your deals, those large opportunities consume disproportionate rep time in due diligence, executive alignment, and legal review. A rep managing three $500,000 deals and fifteen $50,000 deals is not operating at the same capacity as a rep managing thirty $50,000 deals, even if the total pipeline value is identical. Capacity models must account for deal complexity weighting, typically by assigning time multipliers to deals above certain size thresholds. A $500,000 deal might require 3x the selling time of a $50,000 deal, meaning the rep with large deals has effectively 40% less capacity than their pipeline value suggests.
Seasonality and market timing create additional failure points. A capacity model built on annual averages will fail to predict quarterly performance if your business has pronounced seasonal patterns. For example, a team selling into enterprise budgets may see 40% of annual revenue in Q4, requiring 50% more capacity in October-December than in January-March. If you staff for average capacity, you will be understaffed during peak periods and overstaffed during lulls, leading to missed quotas or wasted payroll. The solution is to build monthly capacity models that reflect your specific seasonality, then use contract workers or accelerated hiring timelines to cover peak periods.
The most dangerous edge case is the assumption that adding headcount linearly increases capacity. In practice, adding reps to an existing team often decreases per-rep productivity by 10-20% during the first 3-6 months because existing reps must spend time mentoring, managers become stretched thin, and territory splits create friction. This phenomenon, sometimes called the "capacity dilution effect," means that a team adding 10 reps to a 40-person team might see only 6-7 reps worth of net capacity increase in the first quarter. Capacity calculations that ignore this dilution effect routinely overstate the impact of hiring plans and lead to missed revenue commitments.
A practical rollout plan

Implementing a rep capacity model across a sales team in 2027 requires a phased approach that builds credibility with stakeholders while avoiding the common pitfalls of over-engineering. Start with a simple spreadsheet model using your actual CRM data for the past 12 months, focusing on three inputs: total available selling hours per rep, average hours per closed deal, and average deal size. Most CRM platforms can export this data directly, and the initial model should take no more than two weeks to build. The goal of phase one is to produce a single number: the gap between current capacity and current target, expressed in full-time equivalent reps.
Phase two involves validating the model with frontline managers and top performers. Schedule 30-minute interviews with 8-10 managers across different segments or regions, asking them to estimate their team's capacity independently. Compare their estimates to your model's output and look for discrepancies larger than 15%. These discrepancies almost always reveal missing variables — perhaps a manager's team handles more complex deals than the model assumes, or they have unusual administrative burdens from a recent system migration. Adjust the model to reflect these realities, and document every assumption so stakeholders can see what drives the numbers.

Phase three is the rollout to leadership, where the capacity model becomes the foundation for hiring plans and quota setting. Present the model as a decision-support tool rather than a prediction engine, emphasizing that it shows the relationship between inputs and outputs rather than forecasting the future. Use scenario analysis to show how changes in win rate, deal size, or ramp time affect capacity, giving leadership a range of outcomes rather than a single point estimate. This approach builds trust because it acknowledges uncertainty while providing actionable insights.
The final phase is ongoing maintenance and iteration. Capacity models degrade rapidly as markets, products, and team composition change, so schedule quarterly reviews where you update the base assumptions with actual performance data. Track the model's accuracy against actual revenue outcomes each quarter, and adjust the weighting of different inputs based on which ones prove most predictive. Over 4-6 quarters, this iterative process produces a model that is accurate within 5-10% of actual outcomes, making it an indispensable tool for strategic planning and resource allocation.
Related questions
How does ramp time affect rep capacity calculations?
Ramp time reduces effective capacity because new hires contribute zero revenue for 60-90 days and only 50% productivity for months 3-6. A 100-person team with 25% annual turnover effectively operates with 80-85 productive reps when accounting for ramp.
What is the ideal selling time percentage for sales reps?
Industry data shows top-performing reps spend 40-50% of their time on direct selling activities. Average performers spend 25-35%. The remaining time goes to CRM data entry, internal meetings, training, and administrative tasks.
How do you calculate capacity for a team with multiple product lines?
Build separate capacity models for each product line, then aggregate. Different products have different deal sizes, cycle lengths, and win rates. Combining them into one average produces misleading results that understate capacity for simple products and overstate it for complex ones.
What metrics should you track to validate your capacity model?

Track actual revenue per rep, pipeline velocity, deal cycle length, and win rate monthly. Compare these to your model's assumptions. If actual revenue per rep is consistently 20% below the model's prediction, your selling time or win rate assumptions are too optimistic.
How often should you update your rep capacity model?
Update the model quarterly at minimum, and monthly during periods of significant change like new product launches, market shifts, or leadership transitions. Annual updates are insufficient because capacity drivers change faster than most organizations realize.
FAQ
What is the single most important number in a rep capacity model?
The ratio of net selling hours to total working hours. Most teams assume reps sell 50% of the time, but actual data shows 30-40% is more realistic. Adjusting this single input by 10 percentage points changes capacity by 25-33%, making it the highest-leverage assumption in any model.
How do you account for part-time or hybrid selling roles in capacity calculations?
Treat part-time roles as fractional capacity based on their scheduled selling hours. A rep working three days per week with 35% selling time contributes 21% of a full-time rep's capacity. For hybrid roles like sales engineers, model their capacity separately and add it to the rep's capacity at the team level.

Should capacity models include managers and executives who carry quotas?
Only if they have dedicated, measurable selling time. Many player-coach managers carry quotas but spend 60-80% of their time on management activities. Include them at their actual selling time percentage, not their full headcount, or exclude them entirely and treat their quota as a bonus on top of team capacity.
What happens when a capacity model shows the team is overstaffed?
Investigate whether the overstaffing is real or an artifact of incorrect assumptions. Check if deal sizes have shrunk, win rates have dropped, or selling time has decreased. If the overstaffing is real, consider territory expansion, product line extensions, or reducing headcount through attrition rather than layoffs.
How do you calculate capacity for a new team with no historical data?
Use industry benchmarks adjusted for your specific market and deal type. Start with conservative assumptions — 30% selling time, 20% win rate, and 6-month ramp — then tighten the model as you collect actual data over the first two quarters. Expect 20-30% error in the first iteration.
Can automation tools increase rep capacity in 2027?
Yes, but the gains are smaller than vendors claim. AI-powered CRM automation and prospecting tools typically save 5-10 hours per week per rep, increasing selling time from 35% to 45-50%. This translates to a 25-40% capacity increase, but only if reps actually use the tools and redirect saved time to selling rather than other activities.
Sources
https://www.gartner.com/en/sales/insights/sales-operations https://hbr.org/2023/01/a-better-way-to-set-sales-quotas https://www.salesforce.com/resources/articles/sales-capacity-planning/ https://www.zendesk.com/blog/sales-capacity-planning/ https://www.linkedin.com/business/sales/blog/sales-strategy/how-to-calculate-sales-capacity https://www.xactlycorp.com/blog/sales-capacity-planning-best-practices https://www.forecastly.com/blog/sales-capacity-planning https://www.clari.com/resources/sales-capacity-planning
Related on PULSE
This page will be disappearing soon. Save it to your device for $1 — or read it free while it is here.
@Kory-White- · if Venmo asks, the last 4 of my number are 2012
This page is gone.
This one is off the shelf now. $1 keeps it on your phone for good — the whole page, pictures and diagrams included.
 revopsWhat metrics should a RevOps team report on a weekly basis in 2027?
 revopsWhat is the ideal lead-to-cash workflow for a B2B SaaS company in 2027?
 revopsHow do you set up a lead scoring model for inbound and outbound channels in 2027?
 revopsWhat are the most common RevOps mistakes that hurt customer retention in 2027?
 revopsHow do you reduce data inconsistency between CRM and billing systems in 2027?
 revopsWhat is the best way to align marketing and sales KPIs without data silos in 2027?
 revopsHow do you design a territory assignment model for a global sales team in 2027?
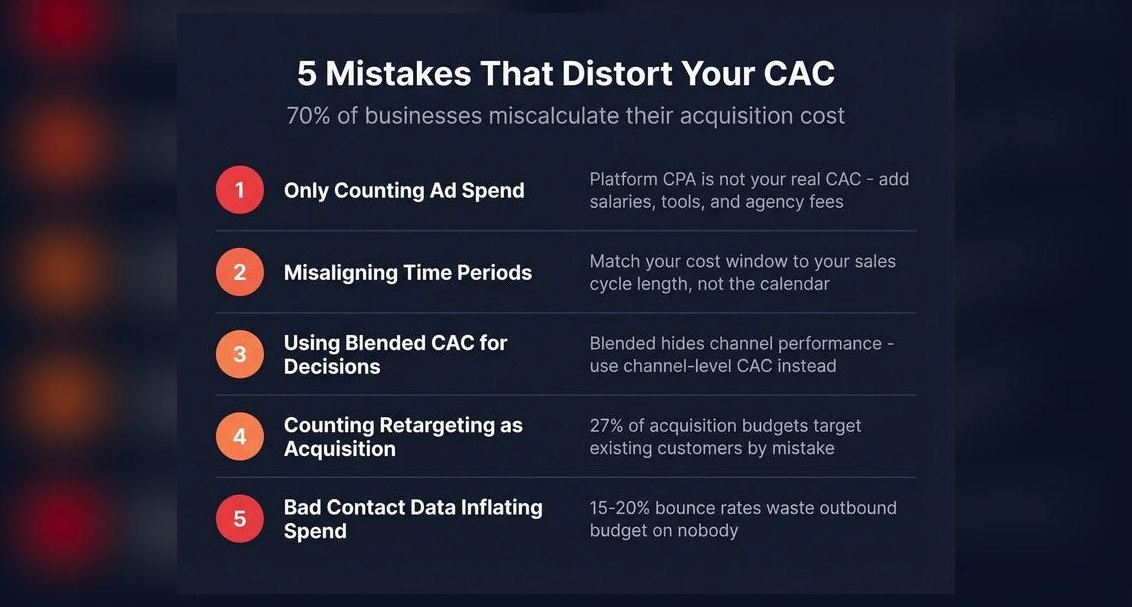 revopsHow do you calculate customer acquisition cost when running multi-channel campaigns in 2027?
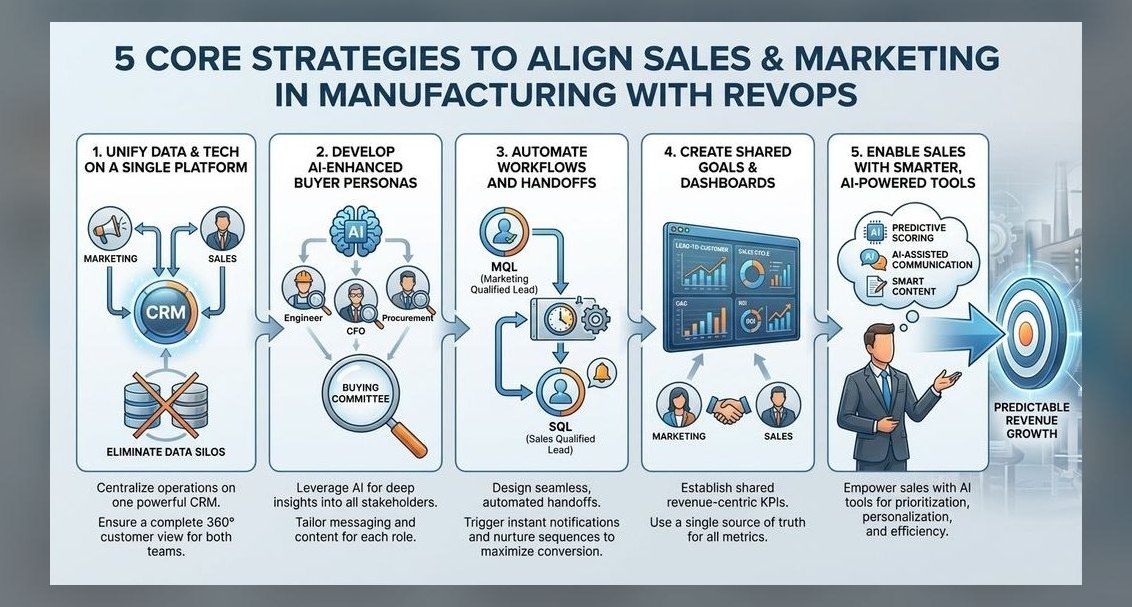 revopsHow does RevOps align marketing, sales, and customer success teams in 2027?
 pulse-toolsHow Many Front Desk Staff Should I Schedule Each Shift at My Hotel in 2027?