

How do you determine the right device-to-student ratio for a district-wide 1:1 program in 2027?
 Curated byKory White · Fractional CRO · Maryland
Quality
Certified

Determine the ratio by counting peak concurrent instructional demand, not enrollment. True 1:1 assigns one device per student plus a spares pool of 5–10% of fleet for repair and loaner circulation. Audit usage data, bell-schedule overlap, testing windows, and take-home policy, then fund the ratio each grade band actually consumes.
The outcome you should expect
A district that gets this calculation right ends up with something quieter than most people imagine. Teachers stop planning around cart availability, help-desk tickets stabilize at a predictable weekly rate, and the finance office can forecast next year's device spend to within a few percentage points. That is the actual deliverable. The ratio itself is a means, not the goal.
Concretely, a well-tuned program in the 2027 planning cycle should produce four measurable outcomes. First, instructional availability above roughly 97% — meaning that on any given school day, fewer than three students out of a hundred are without a working assigned device during a class that requires one. Second, a spares pool that never drops below about 2% of fleet in active circulation, because the moment the loaner shelf empties, every subsequent repair becomes an instructional outage rather than a swap. Third, a refresh curve that spreads replacement across grade bands rather than cliffing every four years. Fourth, a per-student annual cost you can defend line by line to a board that will ask why the number is what it is.
The failure mode most districts describe after the fact is not "we bought too few devices." It is "we bought exactly enough devices and had no slack." A fleet sized to enrollment with zero buffer is a fleet that degrades into a functional 1:1.15 or worse within eighteen months as breakage accumulates and repairs queue. Every device in the repair pipeline is a device not in a student's hands, and repair turnaround — whether in-house or vendor depot — is the hidden variable that converts a nominal 1:1 into a practical shortfall.

There is also a softer outcome worth naming. When the ratio is genuinely adequate, teachers change how they plan. Lessons that assume every student has a device at the moment of instruction look different from lessons that hedge against scarcity. Districts that hit true availability report that the pedagogical shift — from "device day" to device-as-default — happens roughly a semester after the hardware situation stabilizes, not immediately. The hardware is necessary and not sufficient, and the ratio decision should be framed to leadership that way so nobody expects instructional transformation to arrive in the same purchase order as the laptops.
Finally, expect the answer to be different per grade band, and expect that to be the single most contentious part of the recommendation. A K–2 program and an 11–12 program have almost nothing in common operationally: different device types, different take-home policies, different breakage profiles, different testing requirements. A district that applies one ratio uniformly across PK–12 is overspending at one end and underserving at the other. The right output of this analysis is a table with a row per grade band, not a single number.
What drives that outcome
Five forces determine what ratio a district actually needs, and they interact. Working through them in order keeps the analysis honest.

Concurrent instructional demand. The foundational question is not "how many students do we have" but "how many students need a device at the same instant?" In a true take-home 1:1, those numbers converge — every student has a device with them, so concurrency equals enrollment. But in a non-take-home or cart-based model, concurrency is bounded by scheduling. If a school runs eight periods and only 60% of sections in any given period require devices, peak concurrent demand may sit well below enrollment. This is why cart models can serve a building at a nominal 1:2 or 1:3 and still feel adequate — right up until state testing, when concurrency spikes to near-100% and the whole model breaks. Size for the peak, not the average, or explicitly plan how you'll survive the peak.
Breakage and repair turnaround. This is the arithmetic that most directly sets spares. If your annual damage rate is D (as a fraction of fleet) and your average repair cycle time is T days across a school year of roughly 180 instructional days, then the expected number of devices in the repair pipeline at any moment is approximately fleet × D × (T / 180). A district with a 20% annual damage rate and a 10-day turnaround has roughly 1.1% of fleet in the shop at steady state. Push turnaround to 30 days and that triples to about 3.3%. Push damage to 35% — plausible in a middle-school take-home program with rugged use — and 30-day turnaround puts nearly 6% of fleet out of circulation continuously. Your spares pool must cover that steady-state number plus variance, which is why 5–10% is the commonly cited band rather than a single figure.
Take-home policy. Devices that go home break more, get lost more, and are harder to recover for repair — but they also enable the homework and remote-continuity use cases that justified the program. Districts that restrict take-home to grades 6–12 and keep K–5 devices in-building are making an explicit trade: lower breakage and lower spares requirement in the elementary band, at the cost of no home access. That trade is defensible; what is not defensible is making it implicitly by never writing the policy down.
Device type and form factor. Managed Chromebooks, Windows laptops, and tablets have materially different failure profiles, repair economics, and lifespans. Chromebooks in particular carry a manufacturer-published Auto Update Expiration date, and a device past AUE stops receiving security and feature updates — which effectively makes AUE a hard end-of-life for any device that must touch student data. Building your refresh schedule off AUE dates rather than off a generic "four-year life" assumption is one of the highest-leverage planning corrections available, because AUE varies by hardware platform, not by when you bought it. A district that buys already-two-years-into-its-AUE-window inventory has purchased a shorter asset life than the invoice implies.

Assessment and specialty requirements. State online assessment windows create the sharpest concurrency spike in the calendar, and assessment platforms often impose minimum hardware, screen-size, or peripheral requirements that some fleet devices fail. A district can be at a true 1:1 by count and still be short on test-eligible devices. Similarly, CTE, media production, and computer-science pathways frequently need higher-spec machines that cannot be satisfied from the general fleet, so those seats should be budgeted separately rather than counted against the 1:1 ratio.
Benchmarks and realistic ranges
Numbers here should be treated as planning starting points that you replace with your own telemetry as soon as you have a year of it. Districts vary enormously, and a benchmark from a neighboring district with a different take-home policy is nearly useless.
Spares pool: 5–10% of fleet. The low end fits a district with in-house repair, a same-week turnaround, and a controlled take-home policy. The high end fits a district with vendor depot repair, multi-week turnaround, or a young-grades take-home program. If you are outsourcing repair and have not measured turnaround, plan at 10% and adjust down once you have data — being over on spares costs money, being under costs instruction.
Annual damage rate: highly variable, commonly cited in the 10–30% range depending on grade band and protective case policy. Middle school consistently runs highest across most districts' internal reporting; high school runs lower than middle school in many programs, which surprises people who expect a linear age relationship. Elementary in-building devices run lowest. Track your own rate by grade band and by damage type — cracked screen, liquid, lost charger, non-return — because the mix determines whether your fix is better cases, better policy, or better collection procedures.

Repair turnaround: 3–10 days in-house, 15–30+ days vendor depot. This is the single most controllable input to your spares math. A district that brings screen and keyboard repair in-house — including student-run repair programs, which several districts operate as CTE pathways — can often cut turnaround by two-thirds and reclaim several percentage points of fleet.
Device lifespan: plan against AUE, not a fixed year count. Chromebook AUE dates are published per hardware platform by Google and are the operative constraint for that fleet. For Windows and macOS devices, the analogous constraint is the OS vendor's supported-version lifecycle plus realistic battery degradation, which in practice tends to bite around the four-to-five-year mark for daily-use student hardware regardless of what the CPU can still do.
Charging and power infrastructure. Frequently ignored in ratio math and frequently the thing that breaks a rollout. A take-home model pushes charging to the home and needs relatively little in-building capacity. A non-take-home model needs cart charging capacity matched to fleet, and older buildings often cannot support the circuit load of enough carts without electrical work. Get facilities into the sizing conversation early; a purchase order for devices that arrive with nowhere to charge is a common and entirely avoidable embarrassment.
Network capacity. Concurrency drives bandwidth as much as it drives device count. A building moving from 1:3 carts to true 1:1 roughly triples simultaneous connections, and wireless access point density sized for the old ratio will not hold. Per-student bandwidth planning guidance has trended upward for years as instructional content has become more video-heavy; the practical move is to measure your current peak per-connection utilization and extrapolate, rather than adopting a national rule of thumb that may be several years stale by 2027.
Total cost of ownership. The device price is typically the minority of multi-year cost once you add management licensing, insurance or self-insurance reserve, repair parts and labor, accessories, network upgrades, and staff time. Districts that budget only for hardware discover the gap in year two. Build the model as a per-student annual figure across the full refresh cycle — that is the number a board can compare year over year and the number that survives a superintendent transition.
Risks, edge cases, and failure modes

The nominal-versus-effective ratio gap. A district reports 1:1 because it purchased one device per student. Two years later, accumulated unrepaired breakage, non-returns, and end-of-life devices still counted in inventory mean the effective ratio is 1:1.2. The fix is an inventory reconciliation discipline: a device that cannot be issued to a student today does not count toward the ratio. Audit asset management records against physical inventory at least annually, and treat "in repair," "awaiting parts," "lost," and "past AUE" as separate non-issuable categories rather than folding them into fleet total.
Enrollment volatility. Districts with significant mobility — military-adjacent, agricultural, high-turnover urban — see enrollment swing meaningfully within a school year. A fleet sized to October 1 enrollment is short by spring if the district is growing. Size to projected peak enrollment plus a mobility buffer, and keep a small unassigned reserve specifically for mid-year arrivals so a new student is not waiting two weeks for a device.
Non-return at year end and at withdrawal. Recovery rates vary widely and correlate with collection process quality more than with community demographics. Districts with structured end-of-year collection, clear parent communication, and a documented consequence framework recover materially more than districts that improvise. Every unrecovered device is a device you buy twice. Build the expected non-return rate into your annual purchase, and separately work the process to drive it down.
Insurance and fee-structure equity. Charging families a device fee or damage deductible raises revenue and reduces careless damage, but creates real equity risk: a student whose family cannot pay may lose device access, which converts a funding mechanism into an instructional barrier. Districts navigating this typically build hardship waivers directly into the policy rather than handling exceptions ad hoc. Whatever the approach, it should be written, board-approved, and applied consistently.

Special education and accessibility requirements. Students with IEPs may require specific assistive technology, alternate input devices, larger screens, or particular software that the standard fleet device cannot host. These are legally binding requirements, not preferences, and they should be scoped with the special education department during sizing rather than discovered during deployment. Budget them as a distinct line.
English learner and multilingual family support. Device policy documents, damage agreements, and help-desk access that exist only in English create a functional access gap. This is not a ratio question directly, but it affects effective utilization — a device a family is afraid to let their child use because they could not read the damage agreement is not a device in service.
The refresh cliff. A district that buys its entire fleet in one year must replace its entire fleet in one year, which creates a budget spike large enough to threaten the program's survival at exactly the moment it needs continuation funding. Staggering purchases — replacing roughly a quarter of fleet annually once steady state is reached — smooths the budget line and keeps a rolling mix of device ages, which also means a hardware defect in one purchase cohort doesn't take out the whole district.
Vendor and supply-chain timing. Lead times for education hardware have been volatile in recent years. Ordering in spring for fall deployment is standard practice for a reason; ordering in July is how districts end up with students sharing devices in October. Build imaging, asset tagging, and enrollment time into the schedule — a thousand devices do not go from pallet to student hands in a week without dedicated staffing.
Data privacy and device management scope. A 1:1 program that goes home extends the district's data governance surface into student homes. Content filtering obligations under E-Rate's CIPA requirements follow the device in many implementations, and monitoring software choices carry genuine privacy trade-offs that families increasingly ask about. Decide the monitoring posture deliberately, document it, and communicate it before deployment rather than after the first parent complaint.
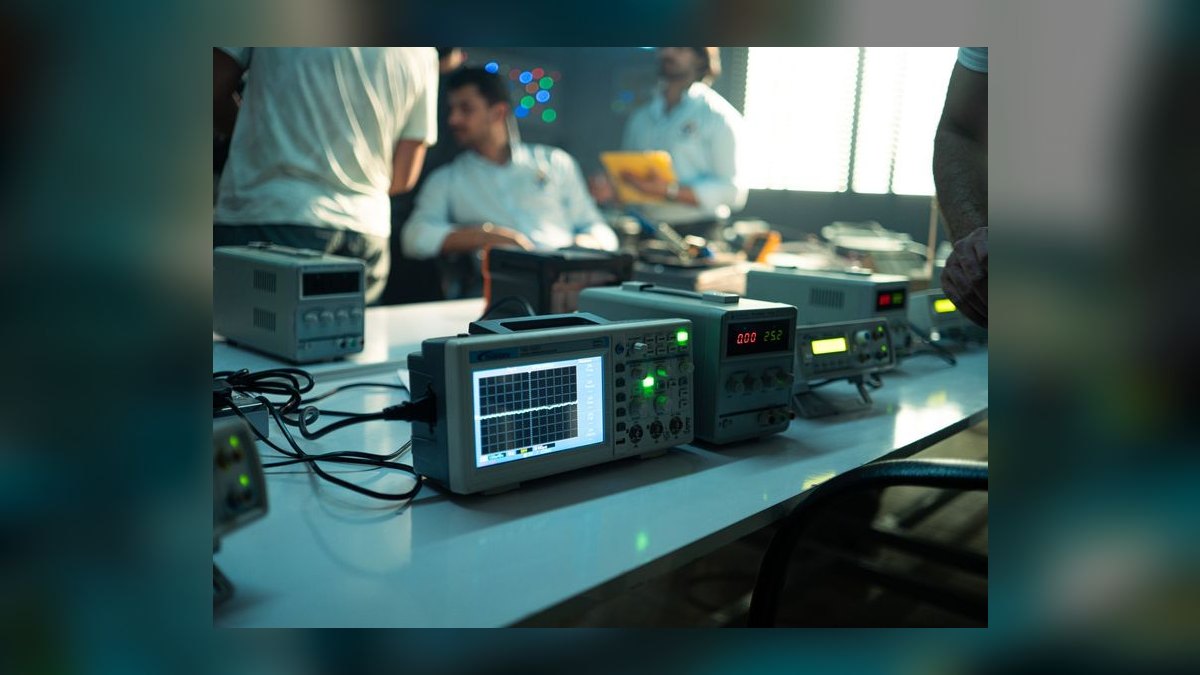
Staffing. The most common under-budgeted resource is people. A rough planning heuristic used in many districts is one dedicated technician per one to two thousand devices, adjusted for whether repair is in-house. Under-staff this and repair turnaround stretches, which — per the arithmetic above — directly increases the spares you need. Technician headcount and spares pool are substitutes for each other in the budget model, and it is usually cheaper to fund the technician.
A practical rollout plan
The sequence below assumes a district starting from a mixed cart-and-partial-1:1 posture and targeting full deployment for a 2027 school year. Adjust the calendar, keep the order.
Phase one — measure what you actually have (2–3 months). Reconcile the asset management system against physical inventory, building by building. Categorize every device as issuable, in repair, past AUE, or lost. Pull twelve months of help-desk tickets and classify by damage type and grade band. Pull the master schedule and calculate section-level device-use rates so you can compute peak concurrency rather than guessing it. Nothing downstream is trustworthy without this step, and it is the step districts most often skip.
Phase two — model the ratio per grade band (1 month). For each band, compute base requirement from concurrency, add the spares pool derived from your measured damage rate and turnaround, add specialty and assistive technology seats, and add a mobility reserve. Produce a table: band, enrollment, base devices, spares, specialty, total, implied ratio, unit cost, annual cost. Sensitivity-test it — what happens if damage runs five points higher than measured, or turnaround doubles? A model that only works at the optimistic input is not a model.
Phase three — write policy before you buy (1–2 months, parallel). Take-home rules by band, damage and fee structure with hardship provisions, non-return consequences, acceptable use, monitoring and privacy posture, and the parent-facing agreement in every language your families speak. Board approval on this precedes the purchase order, because policy changes after deployment are far harder than policy set before.
Phase four — infrastructure readiness (3–4 months, parallel). Wireless survey and AP density check against projected concurrency. Circuit capacity for charging where relevant. Bandwidth headroom at the ISP and at each building. Identity and device management platform ready to enroll at scale. This runs alongside procurement because it has the longest lead time of anything on the list.
Phase five — pilot at real scale (one semester). Pick two or three buildings representing different grade bands and deploy fully. Measure actual damage rate, actual turnaround, actual help-desk volume per hundred devices, and actual teacher-reported availability. A pilot small enough to be convenient is a pilot that teaches you nothing; you need enough volume for the failure rates to be statistically meaningful.
Phase six — full deployment, staggered (one to two years). Roll out band by band, with imaging and asset tagging staffed as a real project rather than absorbed into existing IT workload. Establish the annual refresh cadence in the same breath — the purchase that completes deployment should already be scheduled against a replacement year.
Phase seven — instrument and revisit annually. Effective ratio, damage rate by band and type, turnaround, spares depletion, non-return rate, and per-student annual cost. Review the ratio model against measured data every spring before the budget cycle. The right ratio is not a decision you make once; it is a number you maintain.
Related questions
Does 1:1 mean every student takes a device home?
No. 1:1 describes assignment — one device per student — not location. Many districts run in-building 1:1 for elementary grades and take-home 1:1 for secondary. The distinction matters for breakage, spares sizing, and home connectivity planning, so state which model you mean.
How large should the spares pool be?

Typically 5–10% of fleet, driven by measured damage rate and repair turnaround. Compute expected devices in the repair pipeline as fleet × annual damage rate × (turnaround days ÷ 180 instructional days), then add variance headroom. Faster in-house repair lets you carry fewer spares.
Should elementary and high school use the same ratio?
Rarely. Grade bands differ in device type, take-home policy, breakage rate, and assessment requirements. Model each band separately and present a table rather than one district-wide number. Uniform ratios typically overspend in one band while underserving another.
What sets device lifespan for a Chromebook fleet?
The manufacturer's Auto Update Expiration date, published per hardware platform. Past AUE, devices stop receiving security updates, which makes them unsuitable for student data. Build refresh schedules against AUE rather than a generic four-year assumption, and check AUE before purchasing.
How does state testing change the calculation?
Testing windows spike concurrent demand toward 100% and often impose hardware eligibility requirements some fleet devices fail. A district can be at 1:1 by count and still short on test-eligible devices. Verify eligibility separately and size for the peak, not the average.
FAQ
How do you determine the right device-to-student ratio for a district-wide 1:1 program in 2027?
Start with measured data, not a target. Reconcile actual issuable inventory, calculate peak concurrent instructional demand from the master schedule and testing calendar, derive spares from your own damage rate and repair turnaround, add specialty and assistive technology seats plus a mobility reserve, and model each grade band separately. The output is a per-band ratio table with a defensible cost per student, reviewed annually against telemetry.
What is the difference between nominal and effective ratio?

Nominal counts every device in inventory. Effective counts only devices that could be issued to a student today — excluding units in repair, awaiting parts, past their update expiration, or lost. Programs drift from 1:1 nominal to 1:1.2 effective within a couple of years without inventory discipline. Track and report the effective number.
Can a district run a credible program at less than 1:1?
Yes for specific contexts — shared carts can serve elementary grades where device use is scheduled rather than continuous. What breaks is peak concurrency: state testing, and any instructional model assuming device-as-default. If you deliberately run below 1:1, document how you will survive the peak weeks rather than discovering the problem during testing.
What drives cost most after the device itself?
Staffing and repair, usually. Technician headcount, parts inventory, and the spares pool together often rival hardware amortization over a refresh cycle. Management licensing, accessories, insurance reserve, and network upgrades fill out the rest. Build the model as annual cost per student across the full cycle, not as a one-time hardware purchase.
How far ahead should procurement start?
Order in spring for fall deployment as standard practice. Hardware lead times in education have been volatile, and imaging, asset tagging, and enrollment take real staff time at scale — a thousand devices do not reach students in a week. Late ordering is the most common cause of students sharing devices into October.
How often should the ratio model be revisited?
Annually, before the budget cycle. Re-run it against the year's measured damage rate, turnaround, non-return rate, and enrollment projection. The inputs move — a new take-home policy, a middle school with a bad cohort, a repair vendor whose turnaround slipped — and a model built on three-year-old assumptions quietly stops matching reality.
Sources
- https://www.cosn.org/
- https://www.setda.org/
- https://support.google.com/chrome/a/answer/6220366
- https://www.fcc.gov/consumers/guides/childrens-internet-protection-act
- https://www.usac.org/e-rate/
- https://nces.ed.gov/
- https://www.iste.org/
- https://www2.ed.gov/about/offices/list/oet/index.html
- https://sites.ed.gov/idea/
Related on PULSE
- How do you budget total cost of ownership for a district device fleet?
- What belongs in a student device take-home agreement?
- How do you cut Chromebook repair turnaround with an in-house program?
- How should districts plan wireless capacity for a 1:1 rollout?
- How do you measure effective versus nominal device availability?
This page will be disappearing soon. Save it to your device for $1 — or read it free while it is here.
@Kory-White- · if Venmo asks, the last 4 of my number are 2012
This page is gone.
This one is off the shelf now. $1 keeps it on your phone for good — the whole page, pictures and diagrams included.
 pulse-edtechHow do you ensure student data privacy when using third-party classroom software in 2027?
 pulse-edtechHow do you build a district-wide edtech professional development calendar that aligns with software rollout timelines in 2027?
 pulse-edtechWhat is the best way to prioritize edtech spending across instructional software, hardware, and professional development in 2027?
 pulse-edtechWhat is the best way to create a district-wide edtech data dictionary that standardizes terms across all platforms in 2027?
 pulse-edtechHow do you train teachers on new classroom software to ensure consistent usage across grade levels in 2027?
 pulse-edtechWhat is the best way to build a district-wide edtech budget that accounts for hardware, software, and training costs in 2027?
 pulse-edtechWhat is the best way to build a sustainable funding model for edtech initiatives after initial grants expire in 2027?
 pulse-edtechHow do you create a teacher-led edtech evaluation rubric that aligns with district curriculum standards in 2027?
 pulse-edtechWhat is the best way to forecast annual edtech operational costs for a district-wide program in 2027?
 pulse-edtechHow do you manage edtech budgets to reduce per-student software costs without sacrificing quality in 2027?