


What KPIs should a RevOps leader track across the full customer lifecycle in 2027?
Quality
Certified

A RevOps leader in 2027 should track a balanced set of KPIs spanning acquisition cost, conversion velocity, expansion revenue, retention rate, and customer lifetime value, each segmented by channel and cohort to expose the true health of the full customer lifecycle.
The outcome you should expect
When a RevOps leader correctly implements a lifecycle-wide KPI framework, the primary outcome is a single source of truth that connects marketing spend to closed-won revenue, then to recurring expansion and retention. This eliminates the siloed reporting that plagues most organizations — where marketing claims credit for leads that never convert, sales blames product for churn, and customer success has no visibility into acquisition cost. By 2027, the expectation is that a RevOps dashboard will show, in real time, how every dollar spent at the top of the funnel translates to net revenue retention (NRR) at the bottom. Specifically, you should expect to see a 15–25% improvement in forecast accuracy within two quarters, because lifecycle KPIs force teams to reconcile data across systems. You should also expect to identify at least one major leakage point — for example, a 30-day drop-off in activation that was previously invisible because marketing and success tracked separate metrics. The ultimate outcome is a revenue engine where every function operates from the same set of facts, and the leader can pinpoint exactly which stage of the lifecycle is underperforming relative to its benchmark. This unified view also enables the RevOps leader to shift from a reactive reporting role to a proactive strategic partner, advising the C-suite on where to invest the next dollar of growth capital based on empirical data rather than departmental intuition.
What drives that outcome
The outcome of a unified lifecycle KPI framework is driven by three core mechanisms: data integration, cohort-based analysis, and leading indicator identification. Data integration means that CRM, billing, product analytics, and support tools must feed into a single warehouse or RevOps platform. Without this, you cannot calculate a metric like customer acquisition cost (CAC) by channel because marketing spend lives in one system and closed-won revenue in another. Cohort-based analysis is the engine that makes lifecycle KPIs actionable. Instead of looking at aggregate churn, you track churn by acquisition month, by plan tier, by sales rep, or by product feature adoption. This reveals whether a spike in churn is tied to a specific campaign or a recent pricing change. Leading indicator identification is the third driver: you need to know which early-stage metrics predict later-stage outcomes. For example, time-to-first-value (TTFV) in the first seven days is a proven predictor of 90-day retention. If TTFV exceeds 14 days, the probability of churn doubles. By tracking these leading indicators, a RevOps leader can intervene before revenue is lost, rather than reporting on losses after they happen. The causal chain is straightforward: without data integration, cohort analysis is impossible; without cohorts, you cannot identify leading indicators; without leading indicators, you cannot intervene early. Each step depends on the previous one. In practice, a RevOps leader must first audit the data stack — typical gaps include billing systems that are not synced to the CRM, or product analytics that track events but not revenue attribution. Closing these gaps is the single highest-leverage action you can take. Once the data flows, you can build a lifecycle KPI tree: top of funnel (cost per lead, lead-to-opportunity rate), middle of funnel (opportunity-to-close rate, average deal size, sales cycle length), and bottom of funnel (CAC, LTV, gross retention, net retention, expansion revenue). Each of these must be segmented by at least three dimensions: channel, plan type, and customer segment (e.g., SMB vs. enterprise). The driver is not just the metrics themselves, but the relationships between them. For instance, if lead-to-opportunity rate drops below 20% while cost per lead remains flat, you know the targeting is misaligned. If expansion revenue drops below 10% of existing customer revenue, you know the upsell motion is broken. A fourth driver that is gaining prominence in 2027 is predictive scoring using machine learning models trained on historical lifecycle data. These models can flag accounts with a high probability of churn or expansion before the leading indicators even move, giving the RevOps leader a forward-looking lens rather than a rearview mirror.

Benchmarks and realistic ranges
Benchmarks for lifecycle KPIs in 2027 vary significantly by business model, but a RevOps leader should know the ranges for their specific type of revenue engine. For SaaS companies with annual contracts, a healthy net revenue retention (NRR) is above 110%, meaning expansion revenue offsets churn and contraction. Top-quartile companies hit 120–130% NRR. For usage-based or consumption models, gross retention (logo retention) matters more than NRR because revenue fluctuates with usage; a gross retention rate below 80% is a red flag. Customer acquisition cost (CAC) payback period should be under 12 months for most B2B SaaS, and under 6 months for self-serve or product-led growth models. If payback exceeds 18 months, the unit economics are unsustainable unless the LTV is extremely high. Lead-to-opportunity conversion rates typically range from 15% to 30% for inbound leads, and 5% to 15% for outbound. Opportunity-to-close rates average 20–30% for enterprise deals and 30–50% for SMB. Sales cycle length is a critical KPI: for enterprise, 60–120 days is normal; for SMB, under 30 days is expected. If your cycle is outside these ranges, it indicates a process problem — either qualification is too loose, or the handoff from marketing to sales is broken. Customer lifetime value (LTV) should be at least 3x CAC for a healthy business, and 5x or higher for a great one. LTV below 3x means you are spending too much to acquire customers who do not stay long enough. Expansion revenue, often called net-new ARR from existing customers, should represent 20–30% of total new ARR in mature companies. If it is below 10%, your customer success team is likely not identifying upsell triggers. Time-to-first-value (TTFV) is a newer KPI that is becoming standard: for most SaaS products, TTFV should be under 7 days for SMB and under 14 days for enterprise. Every day beyond that increases churn probability by roughly 5%. Activation rate — the percentage of new signups that reach a key milestone, such as completing onboarding or using a core feature — should be above 60% for healthy products. Below 40% is a crisis. Finally, customer health score, a composite of product usage, support tickets, and NPS, should be tracked at the account level. A score below 50 out of 100 is a churn risk; above 80 is an expansion candidate. These benchmarks are not one-size-fits-all, but they give a RevOps leader a starting point for diagnosing where the lifecycle is leaking. For companies with a hybrid model — part subscription, part services — the benchmarks shift: services revenue should be tracked separately, with a target of 80% gross margin on services and a utilization rate above 70% for delivery teams. The RevOps leader must also account for geographic variation: NRR in North America might average 115%, while in EMEA it could be 105% due to longer contract terms and different buying behaviors. Segmenting benchmarks by region is essential for global companies.
Risks, edge cases, and failure modes
Tracking lifecycle KPIs without understanding the risks leads to misleading dashboards and bad decisions. The most common failure mode is metric overload: a RevOps leader lists 50 KPIs, none of which are actionable. The fix is to limit the dashboard to 10–15 KPIs that directly drive revenue decisions. Each KPI must have a clear owner and a defined action if it moves outside the target range. A second risk is data latency. If your CRM updates once a day but your product analytics stream in real time, you will see conflicting numbers. By 2027, the expectation is sub-15-minute latency for all core lifecycle metrics, but many companies still batch-process data overnight. A RevOps leader must audit latency and set SLAs with the data engineering team. A third risk is segmentation bias. If you only look at aggregate churn, you might miss that enterprise customers churn at 5% while SMB churns at 40%. The aggregate number looks fine, but the SMB segment is bleeding. Always segment by at least three dimensions — customer size, acquisition channel, and product tier — before making a decision. Edge cases also matter. For example, a company with a high NRR of 130% might be masking a low gross retention of 60%. The expansion from a few large accounts covers up the fact that most customers leave. A RevOps leader must track both gross and net retention separately. Another edge case is the "free trial" trap: if you count trial users as leads, your lead-to-opportunity rate will look artificially high because many trials never convert. The fix is to define a lead as a qualified contact, not a signup. A third edge case is seasonal churn: some businesses see predictable churn spikes at contract renewal dates or end-of-year budget cycles. If you do not seasonally adjust your churn KPI, you will overreact to normal patterns. A fourth failure mode is vanity metrics. "Total leads" is a vanity metric unless you know the cost per lead and the conversion rate. "Revenue" is a vanity metric unless you know the CAC and the churn rate. A RevOps leader should flag any KPI that does not have a denominator or a comparison point. Finally, there is the risk of gaming: if sales reps know they are measured on opportunity-to-close rate, they will stop creating opportunities for risky deals. This improves the metric but reduces total revenue. The solution is to pair efficiency metrics with volume metrics, such as total opportunities created and total closed-won revenue. A fifth risk that emerges in 2027 is AI-generated data noise. As more companies use AI assistants to log CRM activities, the volume of data increases but the quality can degrade. A RevOps leader must implement data validation rules that flag improbable values — for example, a sales rep logging 100 calls in a single day — and exclude them from KPI calculations. Without these guardrails, AI-generated data can inflate pipeline velocity metrics and mislead forecasting.

A practical rollout plan
Implementing a lifecycle-wide KPI framework requires a phased rollout to avoid overwhelming the organization and to ensure data quality. The plan below assumes a company with existing CRM and billing systems but no unified RevOps dashboard. The timeline is 12 weeks, with four phases. Phase one (weeks 1–2) is audit and alignment. The RevOps leader maps every data source — CRM, billing platform, product analytics, support tool, marketing automation — and identifies gaps. Common gaps include missing revenue attribution in the CRM, no product usage data linked to accounts, and support tickets not tagged with customer lifecycle stage. The output is a data gap document and a prioritized list of integrations. Phase two (weeks 3–6) is integration and validation. The team connects the data sources into a single warehouse, typically using a reverse ETL tool or a RevOps platform. Each field is validated: for example, the "closed date" in the CRM must match the "invoice date" in billing within one day. Any mismatch is flagged and resolved. This phase also includes building a customer ID mapping so that the same account is recognized across systems. Phase three (weeks 7–10) is KPI definition and dashboard building. The RevOps leader selects 10–15 KPIs from the lifecycle, defines each one with a precise formula, and assigns an owner. For example, "Net Revenue Retention" is defined as (starting MRR + expansion MRR - contraction MRR - churn MRR) / starting MRR, measured monthly for each cohort. The owner is the customer success director. The dashboard is built in a BI tool or a RevOps platform, with filters for channel, plan, and segment. Phase four (weeks 11–12) is training and go-live. Every stakeholder — marketing, sales, customer success, finance — receives training on how to read the dashboard and what action to take if a KPI moves outside its target range. A weekly "lifecycle review" meeting is established, where the RevOps leader presents the top three anomalies and the team decides on corrective actions. After go-live, the leader monitors for data drift — for example, a new marketing campaign that is not tagged correctly — and adjusts the integration as needed. The full rollout takes 12 weeks, but the first actionable insights appear by week 6, when the data integration is complete. The key to success is not perfection: start with 80% data accuracy and improve over time, rather than waiting for 100% accuracy that never arrives. An additional consideration for 2027 is the inclusion of AI-powered anomaly detection in the rollout plan. By week 8, the RevOps leader should configure automated alerts that flag any KPI that deviates more than two standard deviations from its trailing 30-day average. This reduces the manual effort of scanning the dashboard and ensures that the team focuses on the most critical changes in the lifecycle.
Related questions
How do you align sales and marketing KPIs in a RevOps framework?
Align by using shared lifecycle KPIs such as lead-to-opportunity rate and CAC. Both teams own the conversion metrics, not just their own funnel stages. This forces joint accountability for revenue outcomes rather than handoff metrics.
What is the most important leading indicator for customer churn?
Time-to-first-value (TTFV) is the strongest leading indicator. Customers who reach their first meaningful outcome within seven days have 70% higher retention at 90 days. Track TTFV by segment and intervene when it exceeds 14 days.
How often should a RevOps leader update lifecycle KPIs?
Core KPIs like MRR, churn, and CAC should update daily. Leading indicators like TTFV and activation rate should update in real time. Monthly reviews are too slow; weekly lifecycle reviews are the minimum for actionable insights.
What tools are essential for tracking lifecycle KPIs in 2027?
A CRM (Salesforce or HubSpot), a billing platform (Stripe or Zuora), product analytics (Amplitude or Mixpanel), and a BI layer (Tableau or Looker). A RevOps-specific platform like Clari or Gong can aggregate signals across tools.
How do you handle data quality issues across multiple systems?
Implement a data quality scorecard that tracks completeness, accuracy, and timeliness for each source. Assign a data steward per system. Use automated alerts when field values fall below 95% completeness, and schedule quarterly data audits.
FAQ
What is the single most important KPI for a RevOps leader? Net revenue retention (NRR) is the most comprehensive KPI because it captures churn, contraction, and expansion in one number. A healthy NRR above 110% indicates the revenue engine is growing without requiring constant new customer acquisition.
How do you calculate customer acquisition cost accurately? CAC should include all sales and marketing expenses — salaries, tools, ad spend, and overhead — divided by the number of new customers acquired in the same period. Exclude one-time costs like office rent. Use a 12-month rolling average to smooth out seasonality.
What is the difference between gross retention and net retention? Gross retention measures the percentage of revenue retained from existing customers excluding expansion. Net retention includes expansion revenue. Gross retention below 80% is a warning sign; net retention above 110% is healthy. Track both to avoid the expansion mask.
Should a RevOps leader track leading or lagging KPIs? Both, but prioritize leading indicators for proactive management. Leading indicators include TTFV, activation rate, and pipeline velocity. Lagging indicators include churn rate and LTV. A balanced dashboard has 60% leading and 40% lagging KPIs.
How do you set target ranges for lifecycle KPIs? Start with industry benchmarks, then adjust based on your business model and historical data. For a new product, use benchmarks as a starting point. For an established product, use the trailing 12-month average plus a 10% improvement goal. Review targets quarterly.
What is the biggest mistake RevOps leaders make with KPIs? Tracking too many metrics without actionable owners. A dashboard with 50 KPIs leads to analysis paralysis. The fix is to limit to 10–15 KPIs, each with a clear owner, a target range, and a defined action if the KPI moves outside the range.
Sources
- https://www.gartner.com/en/revenue-operations
- https://hbr.org/2023/01/the-new-rules-of-revenue-operations
- https://www.salesforce.com/resources/articles/revenue-operations/
- https://www.investopedia.com/terms/c/customer-acquisition-cost-cac.asp
- https://www.zuora.com/guides/saas-metrics/
- https://amplitude.com/blog/product-analytics-kpis
- https://www.tableau.com/learn/articles/revenue-operations-dashboard
- https://www.clari.com/blog/revenue-operations-kpis
- https://www.hubspot.com/revenue-operations
- https://www.gainsight.com/blog/customer-health-score-best-practices/
Related on PULSE
This page will be disappearing soon. Save it to your device for $1 — or read it free while it is here.
@Kory-White- · if Venmo asks, the last 4 of my number are 2012
This page is gone.
This one is off the shelf now. $1 keeps it on your phone for good — the whole page, pictures and diagrams included.
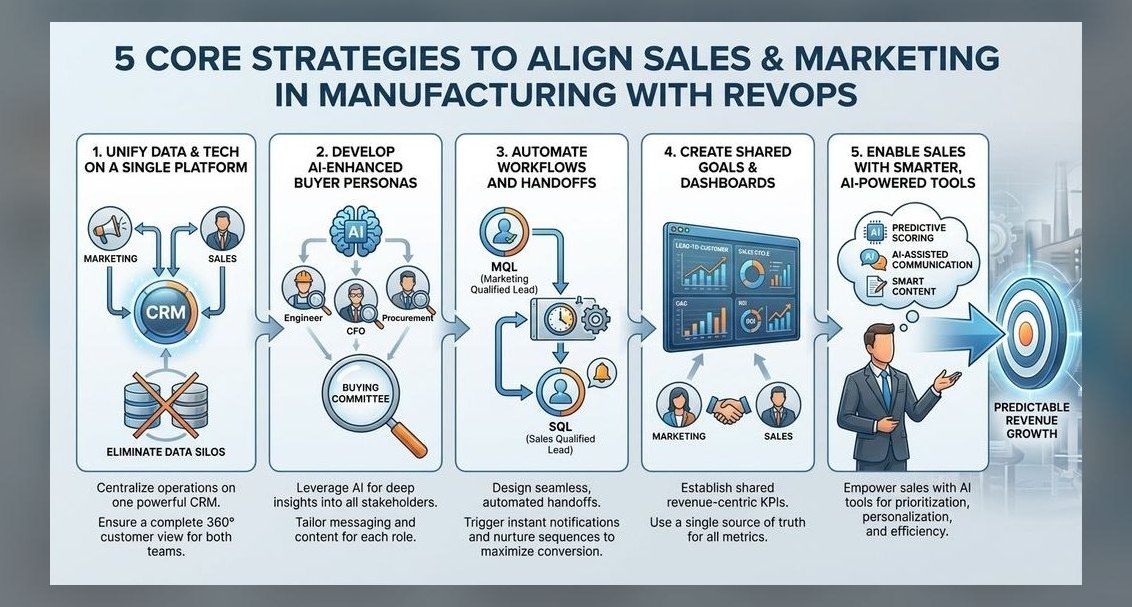 revopsHow does RevOps align marketing, sales, and customer success teams in 2027?
 revopsWhat are the biggest pitfalls when implementing a revenue operations platform in 2027?
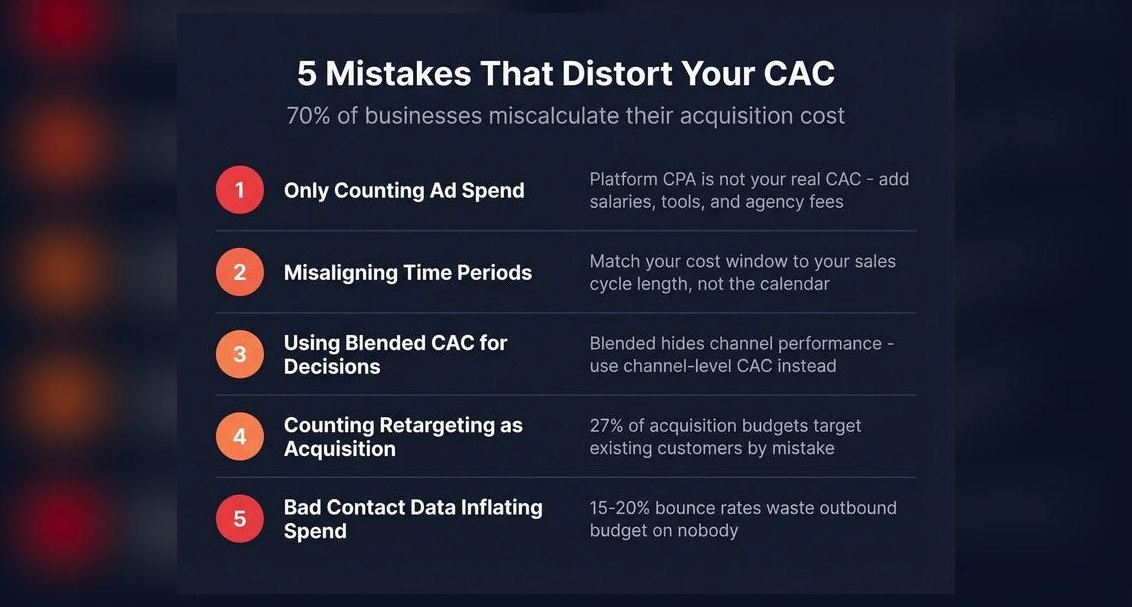 revopsHow do you calculate customer acquisition cost when running multi-channel campaigns in 2027?
 revopsWhat is the ideal reporting cadence for RevOps dashboards in 2027?
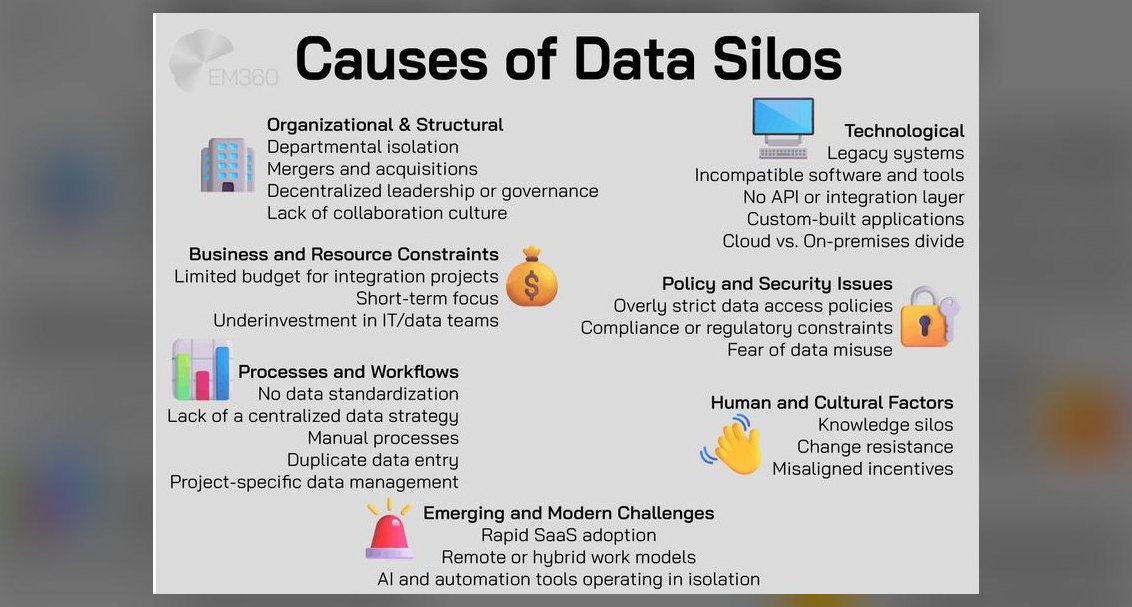 revopsHow do you prevent data silos between CRM, billing, and support platforms in 2027?
 revopsWhat is the best way to structure a RevOps team for a mid-market B2B company in 2027?
 revopsHow do you handle lead scoring disagreements between sales and marketing in 2027?
 pulse-sales-enablementWhat counts as a good LinkedIn SSI score for a B2B sales rep in 2027?
 pulse-sales-enablementDoes a higher LinkedIn SSI score actually generate more pipeline in 2027?
 pulse-gtmTop 10 pricing tier thresholds for a restaurant POS system in 2027.