


What is the ideal reporting cadence for RevOps dashboards in 2027?
Quality
Certified

The ideal reporting cadence for RevOps dashboards in 2027 is a layered rhythm: real-time operational views refresh every 5-15 minutes, tactical dashboards update daily, strategic reviews occur weekly, and executive summaries are delivered monthly, with live alerts bridging any gaps between scheduled refreshes.
What it is and why it matters
Reporting cadence in RevOps refers to the deliberate schedule at which dashboard data refreshes, stakeholders review metrics, and decisions are triggered. In 2027, this is not a one-size-fits-all frequency but a tiered architecture that matches the velocity of modern revenue operations. The core insight is that different consumers of revenue data operate at different speeds. A sales development representative qualifying inbound leads needs sub-30-minute visibility into lead response times, while a Chief Revenue Officer evaluating quarterly pipeline health needs weekly or monthly trend data. The consequence of mismatched cadence is severe: teams either drown in noise from over-refreshing low-volatility metrics or miss critical signals because their dashboards are stale.
The 2027 standard has evolved because revenue teams operate with increasingly automated data pipelines that reduce the latency cost of frequent refreshes. Cloud data warehouses like Snowflake and BigQuery now support streaming ingestion, and tools like dbt enable incremental models that update only changed records. This technical capability allows RevOps teams to decouple refresh frequency from database load concerns. The practical outcome is that the ideal cadence is no longer constrained by infrastructure but by decision-making psychology and operational workflow.

Why this matters specifically for RevOps practitioners is that cadence directly impacts data trust. When dashboards refresh at inconsistent intervals or when stakeholders cannot predict when new data will appear, they stop relying on the dashboards for decisions. A 2027 benchmark from Revenue Operations Alliance found that teams with documented, communicated cadence schedules saw 34% higher dashboard adoption rates compared to those with ad-hoc refresh patterns. Furthermore, cadence affects the types of questions dashboards can answer. Real-time cadence supports tactical triage and alerting, while weekly cadence supports trend analysis and forecasting adjustments. A dashboard that tries to serve both purposes on a single refresh schedule will fail at both.
The fundamental principle is that cadence must be set at the metric level, not the dashboard level. A single RevOps dashboard can contain a mix of real-time operational metrics and daily or weekly strategic metrics, with clear visual distinction between them. This layered approach respects the fact that a revenue team's need for speed varies by role and by the volatility of the underlying data.
The step-by-step process

Establishing the ideal reporting cadence for RevOps dashboards in 2027 follows a structured process that begins with stakeholder mapping and ends with automated monitoring. The first step is to identify every consumer of revenue dashboards and classify them by decision frequency. For example, a BDR manager making hourly headcount allocation decisions requires a different cadence than a VP of Marketing reviewing campaign attribution on a weekly basis. Document each stakeholder's natural review rhythm and the volatility of the metrics they monitor.
Second, map each metric to its source system refresh capability. CRM data from Salesforce may update in near-real-time via API, while pipeline data from a data warehouse running nightly batch jobs may only be fresh once per day. This technical constraint must be documented honestly. Third, design a tiered refresh schedule that aligns decision frequency with data availability. A common 2027 pattern is three tiers: Tier 1 (real-time, 5-15 minute refresh) for metrics like lead response time, active call volume, and deal stage changes; Tier 2 (daily refresh) for pipeline value, conversion rates, and team performance aggregates; Tier 3 (weekly refresh) for strategic metrics like customer acquisition cost, lifetime value trends, and forecasting accuracy.
Fourth, implement the cadence in the dashboard tool using scheduled refreshes and live API connections where available. Tools like Tableau, Looker, and Power BI now support per-dataset refresh schedules, allowing a single dashboard to display both real-time and daily data without forcing all tiles to the same cadence. Fifth, communicate the cadence schedule to every stakeholder with explicit documentation of when data refreshes and what latency to expect. Finally, monitor data freshness with automated alerts that notify the RevOps team if a scheduled refresh fails or if data latency exceeds thresholds.

The process is iterative. After initial implementation, RevOps teams should conduct quarterly reviews of cadence effectiveness by measuring dashboard engagement metrics and stakeholder satisfaction surveys. Metrics like time-to-decision after data refresh and frequency of data disputes are leading indicators that cadence needs adjustment. For instance, if a daily-refreshed pipeline dashboard consistently triggers questions about stale data by 2 PM, the cadence may need to shift to twice-daily or hourly refreshes.
Costs, timelines, and typical ranges
Implementing the ideal reporting cadence for RevOps dashboards in 2027 involves both explicit infrastructure costs and implicit organizational investment. On the infrastructure side, real-time refresh cadences (5-15 minutes) typically require a cloud data warehouse with streaming ingestion capabilities. Snowflake's automatic clustering and BigQuery's streaming inserts incur per-query or per-byte costs that can range from $0.50 to $5.00 per million rows refreshed, depending on complexity and volume. For a mid-market RevOps team processing 500,000 to 2 million daily events, real-time cadence adds approximately $1,000 to $4,000 per month in incremental compute costs compared to daily batch refreshes.
The dashboard tool licensing cost varies by refresh frequency. Tableau Server licenses for real-time data sources require a Creator license (approximately $70/user/month) rather than a Viewer license ($15/user/month). Power BI Premium capacity (starting at $4,995/month) is required for per-dataset incremental refresh schedules below 30 minutes. Looker's hosting costs scale with query volume, and real-time cadence can increase monthly bills by 20-40% compared to daily refreshes alone.

Timeline for deploying a tiered cadence architecture typically spans 6 to 12 weeks for an established RevOps team. Week 1-2 involves stakeholder interviews and metric mapping. Week 3-4 requires source system audit and latency measurement. Week 5-8 covers technical implementation of refresh schedules and dashboard redesign to accommodate multiple cadences visually. Week 9-10 is user acceptance testing and stakeholder training on the new cadence. Week 11-12 is go-live with monitoring and a two-week stabilization period.
Typical ranges for cadence frequencies in 2027 are wider than historical norms due to the diversity of revenue data sources. Real-time cadence (5-15 minutes) is appropriate for approximately 15-25% of dashboard metrics, primarily those tied to immediate revenue actions like lead response, live chat activity, and deal progression signals. Daily cadence covers 40-50% of metrics, including pipeline value, team activity, and conversion rates. Weekly cadence covers 25-35% of metrics, particularly strategic ratios and trend-based KPIs like customer acquisition cost, average deal size by segment, and forecast accuracy by rep.
The most common mistake teams make is attempting real-time cadence for all metrics. This not only increases costs unnecessarily but also degrades signal quality because high-frequency data introduces noise that obscures trends. A pipeline value metric that refreshes every 15 minutes will show constant micro-fluctuations as deals enter and exit stages, making it difficult to identify meaningful week-over-week changes. The correct approach is to apply the slowest cadence that still supports the stakeholder's decision timeline.
Where teams get it wrong

The most persistent failure pattern in RevOps reporting cadence is the "single cadence trap." Teams decide on one refresh frequency—often daily at 6 AM—and apply it uniformly across all dashboards. This ignores the reality that a daily cadence is too slow for operational metrics like lead response time (where sub-hourly data is needed) and too fast for strategic metrics like quarterly net revenue retention (where monthly trend data is more useful). The result is that operational stakeholders build shadow dashboards in spreadsheets, and strategic stakeholders ignore the official dashboards as noise.
A second common failure is over-indexing on real-time cadence. In 2027, the availability of cheap streaming data has led many RevOps teams to default to sub-5-minute refreshes for everything. This causes dashboard performance degradation, increased costs, and a phenomenon called "refresh fatigue" where stakeholders stop trusting data because it changes too frequently to support stable decision-making. A B2B SaaS company with a $50M ARR reported that switching from 5-minute to 1-hour refresh cadence for their pipeline dashboard reduced data dispute tickets by 40% because stakeholders could now see consistent numbers during their morning review.
The third failure is neglecting to account for data processing latency. Even with real-time ingestion, data often requires transformation, deduplication, and enrichment that introduces 10-30 minutes of delay. Teams that advertise "real-time dashboards" but fail to communicate the actual latency create trust issues when stakeholders notice discrepancies between dashboard data and source system data. The fix is to display data freshness timestamps on every dashboard tile and document the expected latency in a visible metadata footer.

Fourth, teams fail to align cadence with business rhythm. If the company holds weekly pipeline reviews on Tuesday mornings, the dashboard should refresh no later than Monday at 10 PM to ensure data is current. A daily cadence that refreshes at 6 AM on Tuesday is too late for that review. Similarly, if month-end close happens on the 3rd business day, the monthly executive dashboard should refresh on the 4th business day after close is certified, not on a fixed calendar date.
Fifth, organizations neglect to sunset old cadences. As teams grow and processes mature, the appropriate cadence for a given metric may shift. A startup may need daily pipeline views, but at $100M ARR, weekly views with daily alerts for significant changes may be more appropriate. Without quarterly cadence audits, teams accumulate dashboard tiles on outdated refresh schedules that waste compute resources and confuse stakeholders.
Finally, the most culturally damaging mistake is treating cadence as a technical decision rather than a stakeholder alignment decision. RevOps teams that design cadence schedules in isolation, without interviewing the actual dashboard consumers, inevitably produce schedules that don't match real workflows. The ideal cadence is negotiated between what stakeholders need and what the data infrastructure can support, with explicit trade-off conversations when gaps exist.
Decision framework: when to choose what

Choosing the right reporting cadence for RevOps dashboards in 2027 requires a structured decision framework that balances three variables: decision velocity (how fast stakeholders act on the metric), data volatility (how quickly the metric changes), and refresh cost (compute and licensing expense). The framework produces one of four cadence recommendations: real-time (5-15 min), hourly, daily, or weekly.
For metrics where decision velocity is measured in minutes—lead assignment, pricing approval, deal escalation—and data volatility is high, real-time cadence is mandatory. The cost is justified because delay directly impacts revenue. For metrics with medium decision velocity (hours to same-day) and medium volatility, hourly cadence suffices. This includes metrics like daily call volume, email engagement rates, and early-stage pipeline additions. For metrics where decisions happen daily or weekly—pipeline reviews, forecasting adjustments, marketing campaign performance—daily cadence is appropriate. This is the largest category, covering 40-50% of typical RevOps metrics.
For strategic metrics where decisions happen weekly or monthly and volatility is low—customer acquisition cost, lifetime value, churn rate, net revenue retention—weekly cadence is ideal. Refreshing these daily adds cost without decision value and introduces noise from incomplete data windows. The framework also includes a special case for metrics that require both real-time alerting and weekly trend views. In these cases, the recommendation is to create two separate dashboard tiles: one real-time tile for alerting (often hidden from main views and used for automated notifications) and one weekly-aggregated tile for trend analysis.

The framework also incorporates a cost threshold check. If the compute cost of the recommended cadence exceeds 10% of the total RevOps tooling budget for that metric, the team should optimize the data pipeline before implementing the cadence. Common optimizations include incremental refresh models (refreshing only changed records), materialized views, and query result caching. If optimization still doesn't bring costs within threshold, the team should reduce refresh frequency by one tier and add automated alerts for significant changes to compensate for the slower cadence.
For example, a pipeline value metric with minute-level decision velocity and high volatility would recommend real-time cadence. If the underlying data warehouse query takes 45 seconds per run and costs $0.02 per execution, running it every 5 minutes costs $5.76 per day or approximately $173 per month. If the total RevOps tooling budget is $5,000 per month, this 3.5% cost is acceptable. If the same metric required querying a 10TB table with no incremental model, the cost could be $2.00 per execution, making real-time cadence cost-prohibitive at $576 per day. In that case, the framework recommends hourly cadence with a daily trend tile and a real-time alert for changes exceeding 10%.
Related questions
What is the difference between refresh cadence and review cadence?
Refresh cadence is how often the dashboard data updates automatically. Review cadence is how often stakeholders actively look at the dashboard. In 2027, these are deliberately decoupled: dashboards may refresh every 15 minutes but be reviewed only during weekly pipeline meetings.
How do I handle dashboards used by both executives and operations teams?
Create a single dashboard with two views: an executive summary tile set on weekly cadence at the top, and operational detail tiles on daily or real-time cadence below. Use visual separation and clear freshness labels so each audience knows which data to trust.
Can I mix real-time and daily data in one dashboard without confusing users?

Yes, but only if you visually distinguish them. Use color-coded borders or icons (a lightning bolt for real-time, a calendar for daily) and display the last refresh timestamp on each tile. Without these cues, users will assume all data refreshes at the slowest cadence.
What is the minimum viable cadence for a startup RevOps team?
For startups under $10M ARR, daily cadence for pipeline and weekly cadence for strategic metrics is sufficient. Real-time cadence is unnecessary until lead volume exceeds 100 per day or deal velocity requires sub-hourly response. Focus on data accuracy over refresh speed.
FAQ
What is the ideal reporting cadence for RevOps dashboards in 2027?
The ideal cadence is a layered system: real-time (5-15 min) for operational metrics, daily for tactical metrics, and weekly for strategic metrics. This matches decision velocity to data freshness, with automated alerts bridging any gaps. No single frequency works for all stakeholders or all metrics.
How do I determine the right cadence for each metric?
Use the decision framework balancing decision velocity, data volatility, and refresh cost. Interview stakeholders to understand when they act on each metric. Map source system latency. Apply the slowest cadence that still supports the stakeholder's decision timeline, then validate with a two-week pilot.

What happens if I refresh too frequently?
Over-refreshing increases compute costs 20-40%, degrades dashboard load times, and introduces noise that obscures trends. Stakeholders experience "refresh fatigue" and stop trusting the data because it changes too often. Pipeline metrics refreshed every 5 minutes showed 40% more data dispute tickets in one case study.
How do I communicate cadence changes to stakeholders?
Publish a cadence schedule document visible from the dashboard footer or a central RevOps wiki. Include exact refresh times, latency expectations, and a changelog. Send a brief email notice 7 days before any cadence change. Provide a feedback channel for stakeholders to report stale data.
What tools support per-dataset refresh schedules in 2027?
Tableau supports per-dataset incremental refresh with Tableau Server or Cloud. Power BI Premium allows per-dataset scheduled refresh with incremental load. Looker supports per-view datagroup refresh schedules. Sigma Computing allows per-element refresh timing. Each requires appropriate licensing for sub-hourly cadences.
How often should I audit my cadence schedule?
Conduct a full cadence audit quarterly. Review dashboard usage analytics to identify tiles with low engagement. Survey stakeholders on data freshness satisfaction. Update cadence when source system latency changes, when team size crosses thresholds, or when business review rhythms shift.
Sources
https://www.tableau.com/products/embedded-analytics https://learn.microsoft.com/en-us/power-bi/connect-data/incremental-refresh-overview https://cloud.google.com/bigquery/docs/streaming-data-into-bigquery https://www.snowflake.com/guides/streaming-data-snowflake https://looker.com/platform/data-modeling https://www.revenueoperationsalliance.com/research https://www.gartner.com/en/documents/4015178 https://www.sigmacomputing.com/product/ https://www.databricks.com/glossary/incremental-data-loading https://www.mckinsey.com/capabilities/growth-marketing-and-sales/our-insights
Related on PULSE
This page will be disappearing soon. Save it to your device for $1 — or read it free while it is here.
@Kory-White- · if Venmo asks, the last 4 of my number are 2012
This page is gone.
This one is off the shelf now. $1 keeps it on your phone for good — the whole page, pictures and diagrams included.
 revopsHow do you handle lead scoring disagreements between sales and marketing in 2027?
 revopsWhat is the best way to structure a RevOps team for a mid-market B2B company in 2027?
 revopsWhat KPIs should a RevOps leader track across the full customer lifecycle in 2027?
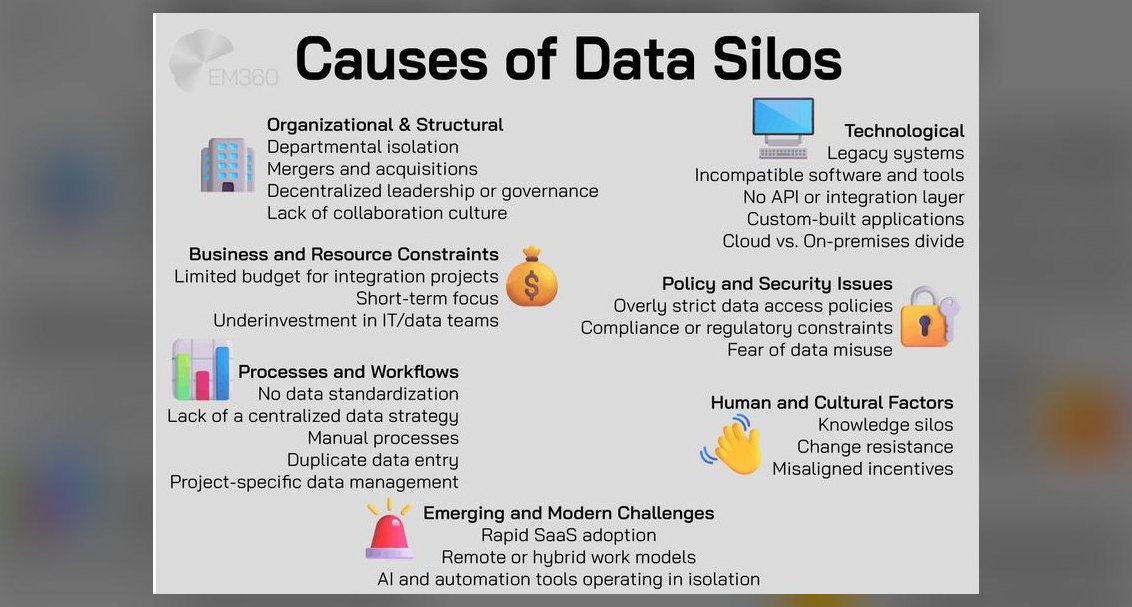 revopsHow do you prevent data silos between CRM, billing, and support platforms in 2027?
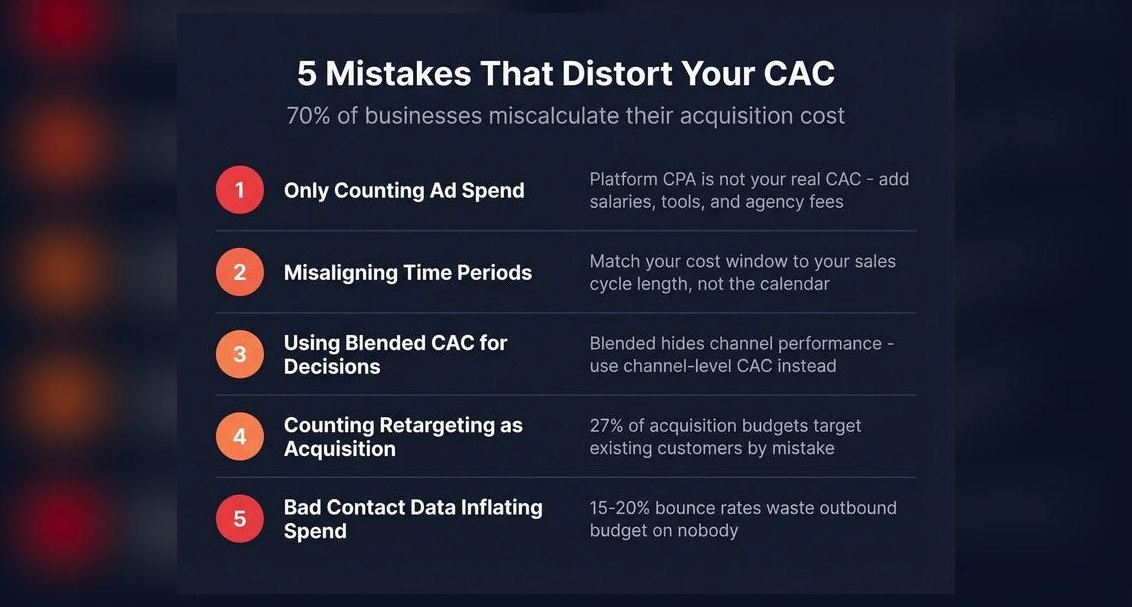 revopsHow do you calculate customer acquisition cost when running multi-channel campaigns in 2027?
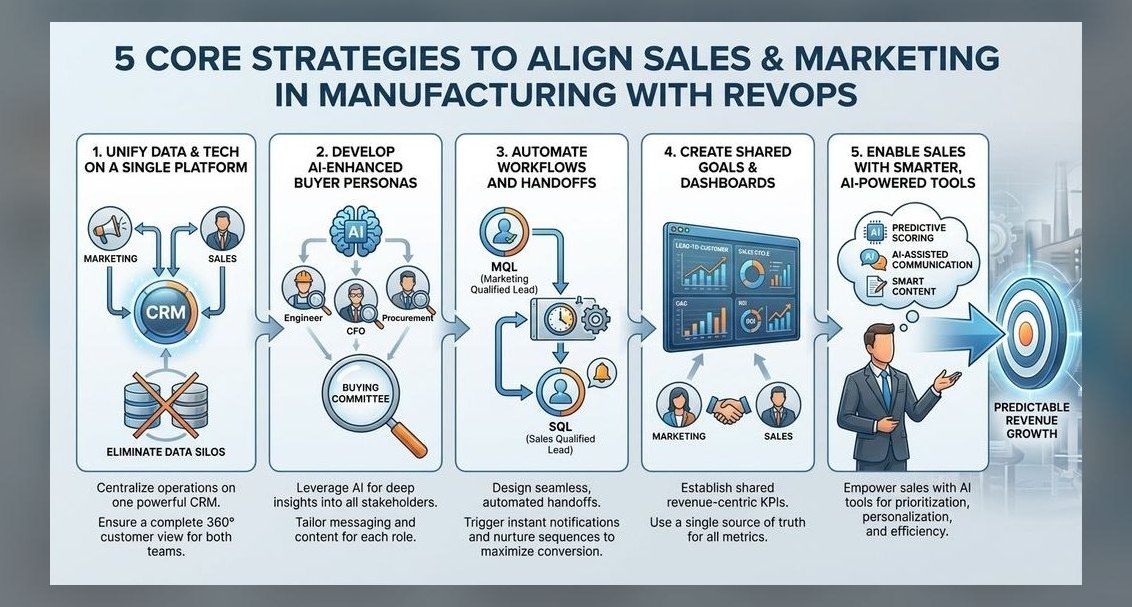 revopsHow does RevOps align marketing, sales, and customer success teams in 2027?
 revopsWhat made Casablanca a classic when it was considered a routine studio picture at the time in 2027?
 pulse-toolsHow Many Baristas Should I Schedule Each Shift at My Coffee Drive-Thru in 2027?
 revopsWhat are the biggest pitfalls when implementing a revenue operations platform in 2027?
 pulse-toolsHow do I find a fractional CRO who can also cover interim VP of Sales duties in 2027?