


What is the most effective method for forecasting recurring revenue in 2027?
Quality
Certified

The most effective method is a bottoms-up cohort model: start from installed ARR, apply logo and dollar retention rates measured by cohort, layer expansion from product usage signals, then add new bookings driven by pipeline-coverage math. Blend that with a weighted CRM roll-up and reconcile the two monthly against actuals.
What bottoms-up recurring revenue forecasting actually is and why it wins in 2027
A recurring revenue forecast is not a sales forecast with a subscription label on it. A sales forecast predicts how much new business closes in a period. A recurring revenue forecast predicts the entire revenue base — the portion that renews automatically, the portion that expands through seat growth or consumption, the portion that contracts at renewal, the portion that churns outright, and only then the new bookings layered on top. In most established subscription businesses, new bookings are the smallest of those five components. A company at $40M ARR growing 30% adds roughly $12M in net new ARR per year, but the $40M base is what determines whether the year is a good one. If gross retention slips from 90% to 85%, that is $2M of ARR that disappears silently — more than most quarters of new sales — and no amount of pipeline accuracy recovers it.
The bottoms-up method inverts the usual order of operations. Instead of asking "what will sales close?" and treating the base as a fixed constant, it asks "what does the existing base do on its own?" and treats new sales as the increment. Mechanically, you build the forecast from the smallest reliable unit — a customer, a contract, a cohort — and roll upward. Each customer contributes a starting ARR, a renewal date, a probability-weighted renewal outcome, and an expansion trajectory. Sum those and you have the base forecast. Then you add new logo ARR from the pipeline model, and you have total ending ARR.
Why this method beats the alternatives in 2027 specifically comes down to three structural shifts in how subscription contracts work now. First, consumption and hybrid pricing are no longer edge cases. A meaningful share of contracts have a committed floor with usage-based overage, or credits that draw down at variable rates, or per-outcome pricing tied to volume the customer controls. A rep-entered CRM close date says nothing useful about how much a customer will consume in month seven of a twelve-month commitment. Usage telemetry does. Second, renewal motions have professionalized. Multi-year contracts with mid-term co-terms, auto-renewal with notice windows, and ramped pricing schedules mean the contractual cash flow is often knowable eighteen months out — but only if the forecast reads contract terms rather than opportunity stages. Third, the boards and lenders who consume these forecasts now underwrite on net revenue retention and rule-of-40 style efficiency metrics rather than raw growth, which means the forecast has to decompose into retention and expansion components anyway. A single blended number does not survive a diligence conversation.

The word *effective* here has a specific operational meaning: a forecast is effective when it is accurate enough to plan hiring and spend against, decomposable enough to diagnose a miss, and cheap enough to run every month without a heroic effort. A model that hits ±2% but takes three analysts two weeks to produce is not effective — you will stop running it by month four. The bottoms-up cohort approach scores well on all three because most of the inputs are system-of-record facts (contract value, renewal date, seats provisioned, events consumed) rather than opinions, and because the decomposition into retention, expansion, contraction, churn, and new is exactly the decomposition an executive team needs to act on.
The trade-off is that bottoms-up modeling is data-hungry. It requires clean contract data with real renewal dates, a reliable link between billing entities and CRM accounts, and at least eight to twelve quarters of history to fit cohort curves with any confidence. Companies under roughly $5M ARR or with fewer than about 150 customers generally cannot fit stable retention curves — the cohorts are too small and a single large logo swings the whole rate. Those companies should run a simpler weighted-pipeline model with a manual renewal list and revisit cohort modeling when the customer count supports it.
The step-by-step process for building the model

Build the model in seven passes. Each pass produces an artifact you can inspect, which matters because a forecast nobody can audit is a forecast nobody trusts.
Pass one — establish the ARR base. Snapshot contracted ARR as of the last closed month. Define ARR precisely and write the definition down: normally the annualized value of committed subscription contracts, excluding one-time services, excluding overage that is not contractually committed, and excluding anything on a month-to-month term you would not underwrite. Reconcile that snapshot to the billing system to within 1%. If you cannot reconcile, stop — every downstream number inherits the error. The most common source of variance is currency: fix a rate for the forecast period and disclose it, because a 5% FX move on a book that is 30% non-USD is a 1.5% ARR swing that has nothing to do with the business.
Pass two — build the renewal calendar. Every contract with a renewal or expiration date inside the forecast horizon goes on a dated list, with its ARR, its owner, its auto-renew status, and its notice deadline. This list is the single most valuable artifact in the whole exercise and most companies do not have one. For an eighteen-month horizon at a company with 400 customers on annual terms, expect roughly 600 renewal events including mid-term co-terms and multi-year anniversaries.
Pass three — fit retention by cohort. Group customers by acquisition quarter and compute, for each cohort, logo retention and net dollar retention at months 12, 24, and 36. You are looking for the shape of the curve, not a single number. A typical B2B SaaS pattern shows the steepest logo loss in the first renewal cycle, then a flattening — cohorts that survive their first renewal churn at a materially lower rate thereafter. Fit separate curves by segment; enterprise and SMB cohorts behave differently enough that a blended curve misleads both.

Pass four — model expansion from usage. For each active customer, pull the leading indicators that actually precede expansion in your product: seats provisioned versus seats licensed, monthly active users trending, API calls or events against the committed tier, number of activated modules, admin-configured integrations. Fit a simple model — logistic regression or even a scored rubric — that maps those signals to expansion probability and expected dollar amount at the next renewal. This is the pass most teams skip, and it is the one that separates a forecast that predicts net revenue retention from one that only predicts churn.
Pass five — model new bookings. Use pipeline coverage and stage-weighted conversion, but calibrate the weights against historical stage-to-close rates rather than accepting CRM defaults. Compute coverage as qualified pipeline entering the quarter divided by the new-ARR target. Most teams find they need 3x to 4x coverage for a stable quarter; if your historical stage-2-to-close rate is 22%, then 3x coverage is arithmetically tight and you should say so.
Pass six — assemble and reconcile. Ending ARR equals starting ARR plus expansion plus new, minus contraction, minus churn. Produce the waterfall, then run the weighted CRM roll-up independently and compare. A gap under 5% is normal noise. A gap over 10% means one of the two models has a broken assumption and you should find it before publishing.
Pass seven — publish with ranges. Ship a base, a low, and a high case, with the specific assumption that differs between them named explicitly.
Costs, timelines, and typical ranges

A first working version of this model takes a competent revenue operations analyst four to six weeks at a company with clean data, and three to four months where contract data lives in spreadsheets or a billing system that was never reconciled to the CRM. The bulk of that time is not modeling — it is data plumbing. Expect to spend the first two weeks establishing a reliable account-to-billing-entity mapping, which is tedious and unglamorous and is the single most common reason these projects stall.
Ongoing effort settles at roughly one to three days per month once the pipeline is automated: a day to refresh and reconcile, a day to review with segment owners, and a half day to write the narrative. If your monthly cycle still takes more than five days after six months, the model is too manual and you should cut scope rather than keep grinding.
On tooling, there is a real fork. The spreadsheet-plus-SQL path costs nothing in license fees and is entirely appropriate up to roughly $20M ARR and a few hundred customers; the constraint is not scale but key-person risk, since the model usually lives in one analyst's head. The warehouse path — contract and usage data modeled in a warehouse with a transformation layer, surfaced through a BI tool — costs more in engineering time up front but survives turnover and gives you version-controlled logic. Dedicated revenue-forecasting and subscription-analytics products sit on top of that; pricing varies widely by vendor and by ARR tier, so get quotes rather than assuming, and be skeptical of any tool that promises accuracy without access to your usage data, because expansion is where the accuracy actually lives.

Accuracy ranges worth calibrating against: a mature bottoms-up model forecasting one quarter out typically lands within 2-5% of actual total revenue, because the base dominates and the base is largely contractual. Four quarters out, 5-12% is a realistic band. The new-bookings component is always the noisiest — quarter-out new ARR error of 10-20% is common even at good companies, which is precisely the argument for building the forecast on the base rather than on bookings. Renewal forecasts for the current quarter should be tight, in the 1-3% range, because you know exactly which contracts are up and who owns them; if your current-quarter renewal forecast is off by more than 5%, the problem is renewal process discipline, not modeling.
Headcount ranges: below about $15M ARR, this is a fraction of one RevOps person's time. Between $15M and $75M, it is typically one dedicated analyst working with a finance partner. Above that, it is usually a small team of two to four spanning RevOps and FP&A, with a data engineer maintaining the pipelines. Budget one BI or analytics engineer's involvement regardless of size, because the warehouse models will drift otherwise.
Time-to-trust is its own timeline and it is longer than the build. Expect two to three full quarters of running the model in parallel with whatever the company used before, publishing both, and explaining the variances, before executives plan against the new number. Skipping the parallel-run period is the fastest way to have the model quietly ignored.
Where teams get it wrong
Forecasting bookings and calling it revenue. The most frequent and most expensive error. A booking is a signed commitment; recognized revenue follows the delivery schedule and the ramp. A three-year contract that starts at $200K, steps to $300K, and ends at $400K books as $900K of TCV and $200K of year-one ARR — and a model that treats those as interchangeable will overstate the near term by 50%. Ramped deals, mid-year starts, and multi-year prepays all need to be laid out on a monthly schedule, not annualized flat.

Treating churn as one number. Blended churn hides the thing you need to know. Separate logo churn from dollar churn, separate voluntary from involuntary (failed payments and expired cards are a collections problem with a different fix), and separate downgrades from full cancellations. A company reporting 8% gross dollar churn where 3 points are involuntary has a fixable billing problem, not a product problem, and the blended number would never have surfaced it.
Building cohorts on too little data. Fitting a retention curve on a cohort of eleven customers produces a number with a confidence interval so wide it is decorative. Below roughly 30 customers per cohort, aggregate cohorts into half-years or annual vintages, and be honest in the output that the curve is directional.
Ignoring seasonality and renewal concentration. If 40% of your ARR renews in Q4 because that is when you ran your first big enterprise push three years ago, then Q4 carries disproportionate risk every single year and a smoothed monthly model will understate it. Plot ARR-up-for-renewal by month and look at the shape before you trust any average.
Letting reps set renewal probability. Renewal likelihood should come from observable signals — usage trend, support ticket severity, executive sponsor still employed, invoice payment timeliness, whether the customer has logged in this month — not from a dropdown. Rep sentiment is a useful input, not the model. Where teams do use rep judgment, the discipline that works is requiring a named reason code tied to an observable fact.
Never comparing forecast to actual at the component level. Total accuracy can look fine while two components are badly wrong in opposite directions — over-forecasting churn and over-forecasting expansion nets out to a clean total and a model you cannot learn from. Track error per component, every month, and keep the log.

Refusing to publish a range. A single point estimate invites false precision and gets treated as a commitment. Publishing base/low/high with the differing assumption named turns the forecast into a decision tool instead of a scorecard.
Forgetting FX and pricing changes. A mid-year list price increase applied at renewal changes the expansion component but not the retention component, and models that lump them together will misattribute the lift. Hold price and volume separate.
Decision framework: matching method to your situation
There is no single right model for every company, and the honest framework is a decision tree rather than a recommendation. The variables that matter are customer count, contract structure, and data maturity.
If you have fewer than about 150 customers, cohort curves will not stabilize. Run a named-account model instead: every customer on a line, a renewal date, an owner, and a judgment call backed by a reason code. It is manual, it is entirely appropriate, and at that size the CRO can hold the whole book in their head anyway. Add cohort modeling when you cross roughly 200-300 customers.
If your contracts are predominantly flat annual subscriptions with low usage variance, a contract-driven model with cohort retention is sufficient and you can skip the usage-telemetry layer. If a meaningful share of revenue is consumption-based, usage modeling is not optional — build the telemetry layer first, because consumption drift is where both your upside and your misses will come from, and a contract-only model is blind to it by construction.

If you sell to both enterprise and self-serve segments, model them separately and always. The retention shapes, expansion mechanics, sales cycles, and even the definition of a "logo" differ enough that a blended model is wrong for both halves. Two clean models beat one blended one.
If your data is genuinely messy — no reliable account mapping, contract dates in free-text fields, billing and CRM disagreeing on who the customer is — fix the data before building anything sophisticated. A simple model on clean data outperforms a sophisticated model on dirty data every time, and the sophisticated version will additionally cost you credibility when it produces an obviously wrong number in month two.
On machine learning specifically: use it where you have volume and a clear label, which in practice means churn and expansion propensity scoring at companies with thousands of customers. Do not use it to produce the headline forecast number at a company with 300 customers — there is not enough signal, and an unexplainable number is a number the board will reject. The durable pattern is a transparent, arithmetic waterfall for the headline, with ML feeding the probability inputs underneath it.
Related questions
How far out should a recurring revenue forecast run?
Four to six quarters for planning, with declining precision by quarter. The current quarter should be near-committed, the next two directional, and anything beyond that a scenario rather than a forecast. Longer horizons belong in the annual plan, refreshed quarterly.
Should the forecast be owned by RevOps or Finance?
RevOps typically owns the model mechanics and the CRM and usage inputs; Finance owns the published number and the reconciliation to GAAP revenue. The failure mode is two competing forecasts, so agree on one source of truth and one publication cadence.
How often should the model be rebuilt versus refreshed?

Refresh monthly with new actuals. Refit cohort curves quarterly, since a single month rarely moves them. Rebuild the structure annually or whenever the pricing model changes materially — new pricing invalidates old expansion curves.
What single metric best summarizes forecast health?
Net revenue retention, because it captures expansion, contraction, and churn in one number and is what investors underwrite against. Pair it with gross retention so expansion cannot mask a churn problem underneath.
FAQ
What is the most effective method for forecasting recurring revenue in 2027?
A bottoms-up cohort model built on contracted ARR, with retention curves fitted by acquisition cohort and segment, expansion driven by product usage signals, and new bookings from calibrated pipeline conversion — reconciled monthly against an independent weighted CRM roll-up. The reconciliation matters as much as the model; two independent methods that agree are far more trustworthy than one sophisticated method with no check on it.
How much historical data do I need before cohort modeling works?
Practically, eight to twelve quarters of clean contract history and enough customers that each cohort has 30 or more logos. With less, the curves are unstable and a single large churn event distorts the whole rate. Companies short on history should run a named-account renewal list and start accumulating cohort data in parallel so the model is ready when the volume arrives.

Does usage data actually improve forecast accuracy, or is it just fashionable?
It improves expansion and churn prediction substantially, particularly in consumption or seat-based models where behavior visibly precedes the contract event. It does little for pure flat-fee annual contracts with no usage lever. Judge it by whether your product generates a signal that leads the renewal by 60-90 days — if it does, model it; if it does not, do not build the plumbing.
How do I forecast a hybrid contract with a committed floor plus overage?
Split it. Forecast the committed floor as contractual base ARR with high confidence, and forecast the overage separately from usage trend with a wider band and a stated confidence range. Never blend them into one number, because they have completely different volatility profiles and blending hides which one moved.
What accuracy should I hold the team to?
Within 2-5% on total revenue one quarter out is a reasonable standard for a mature model, widening to 5-12% four quarters out. Hold the current-quarter renewal component tighter, around 1-3%, since those contracts are known. Track error by component rather than in total, or you will never learn which part of the model is actually broken.
Can AI or machine learning replace this process?
It can improve specific inputs — churn propensity, expansion likelihood, lead scoring — where you have thousands of customers and clean labels. It should not produce the headline number at typical B2B scale, because the sample is too small and executives will not act on a figure nobody can explain. The durable design is transparent arithmetic on top, model-driven probabilities underneath.
Sources
- https://www.saastr.com/
- https://a16z.com/tag/enterprise/
- https://www.bvp.com/atlas
- https://openviewpartners.com/blog/
- https://hbr.org/topic/subject/forecasting
- https://www.mckinsey.com/capabilities/growth-marketing-and-sales/our-insights
- https://www.gartner.com/en/sales/topics/sales-forecasting
- https://www.fasb.org/
- https://corporatefinanceinstitute.com/resources/financial-modeling/
Related on PULSE
This page will be disappearing soon. Save it to your device for $1 — or read it free while it is here.
@Kory-White- · if Venmo asks, the last 4 of my number are 2012
This page is gone.
This one is off the shelf now. $1 keeps it on your phone for good — the whole page, pictures and diagrams included.
 revopsHow do you handle lead scoring disagreements between sales and marketing in 2027?
 revopsWhat is the ideal reporting cadence for RevOps dashboards in 2027?
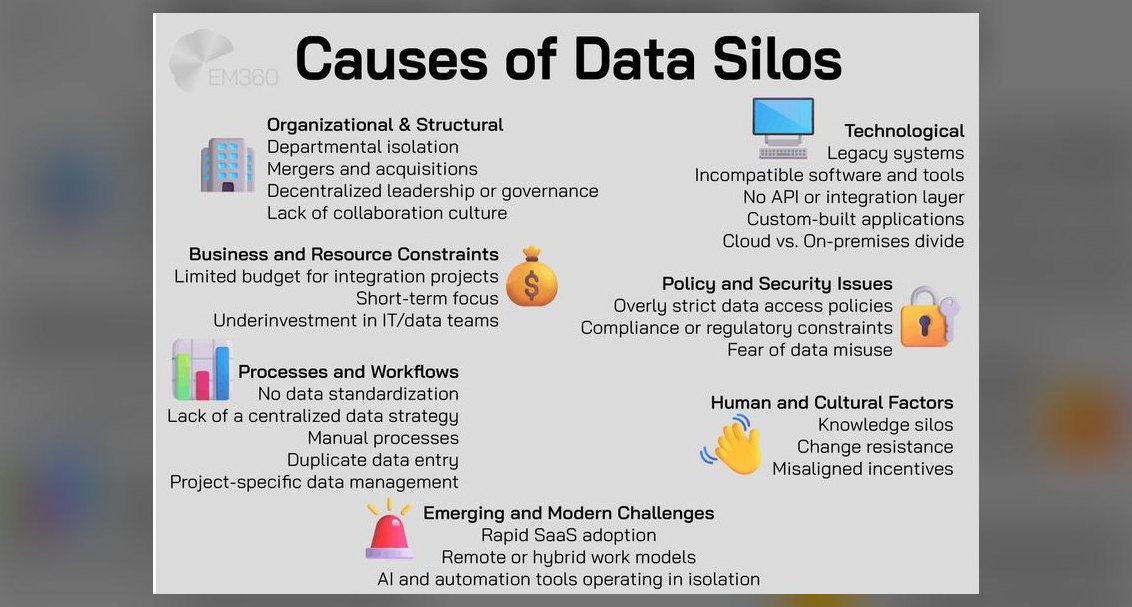 revopsHow do you prevent data silos between CRM, billing, and support platforms in 2027?
 revopsWhat are the biggest pitfalls when implementing a revenue operations platform in 2027?
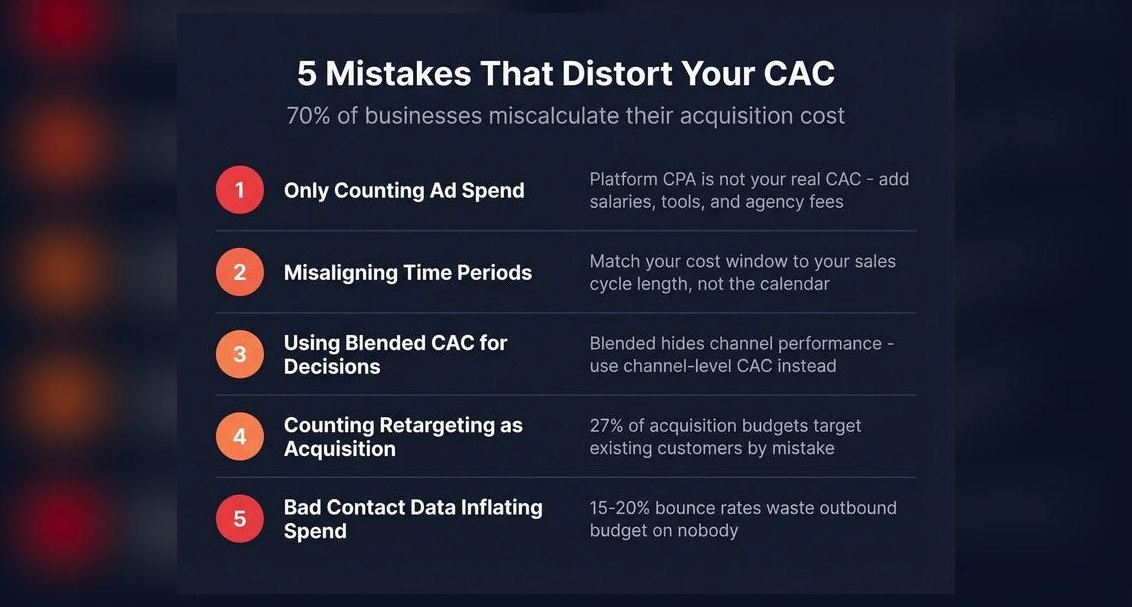 revopsHow do you calculate customer acquisition cost when running multi-channel campaigns in 2027?
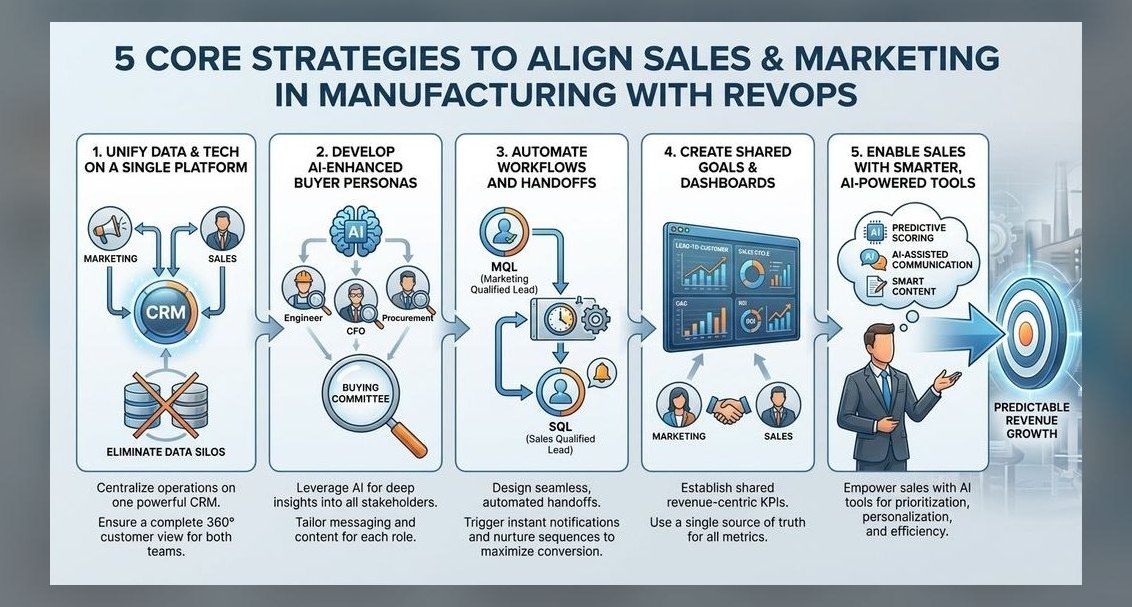 revopsHow does RevOps align marketing, sales, and customer success teams in 2027?
 revopsWhat makes a movie's sound design win an Oscar in 2027?
 revopsWhat genre defined film noir in the 1940s and why did it fade out in 2027?
 pulse-sales-enablementWhich of the four LinkedIn SSI pillars raises your score the fastest in 2027?
 revopsHow do you build a RevOps tech stack without tool overlap in 2027?