


Top 10 Sales KPIs for Commercial Apparel and Uniform Decoration in 2027
Quality
Certified
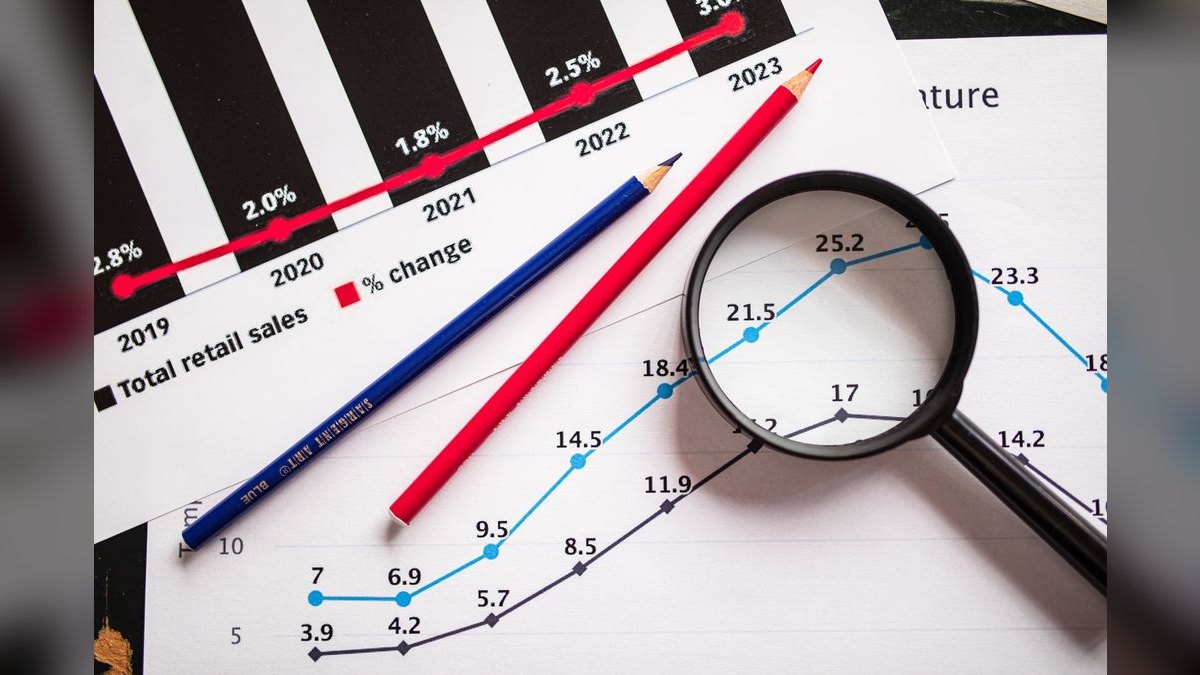
The key sales KPIs for the Commercial Apparel and Uniform Decoration industry in 2027 split project work from recurring programs, then track recurring-program revenue share (45-60%), average order value by lane, gross margin by decoration method, company-store activation rate (75%+), reorder velocity, production-floor utilization, sample-to-program conversion, and decorated-revenue quota attainment per rep.
The outcome you should expect
When you instrument these metrics correctly, the outcome is a decorator that stops living on the seasonal revenue rollercoaster and starts compounding recurring program revenue underneath its project spikes. That is the single result every KPI on this page is engineered to produce, and it is measurable within two or three quarters.
Concretely, expect three shifts. First, recurring-program revenue share climbs from wherever a project-driven shop starts — often under 25% — toward a healthy 45-60% floor. That share is the percentage of monthly billed decoration revenue tied to active company stores, uniform contracts, and scheduled reorder programs rather than one-time orders. Best-in-class B2B decorators such as Vantage Apparel program accounts run 65-75%, and a uniform-rental giant like Cintas approaches 90% because the rental contract itself is the annuity and decoration is the sticky add-on.
Second, expect blended margin to rise even if top-line revenue stays flat, because you begin comping on margin-dollars-per-production-hour instead of raw revenue. A $7.20 blank polo from S&S Activewear or alphabroder marks up 40-55% on the garment line, but the 8,000-stitch left-chest logo carries 58-63% on the decoration line. The shops that win quote the blended number and protect it in the pricing engine.
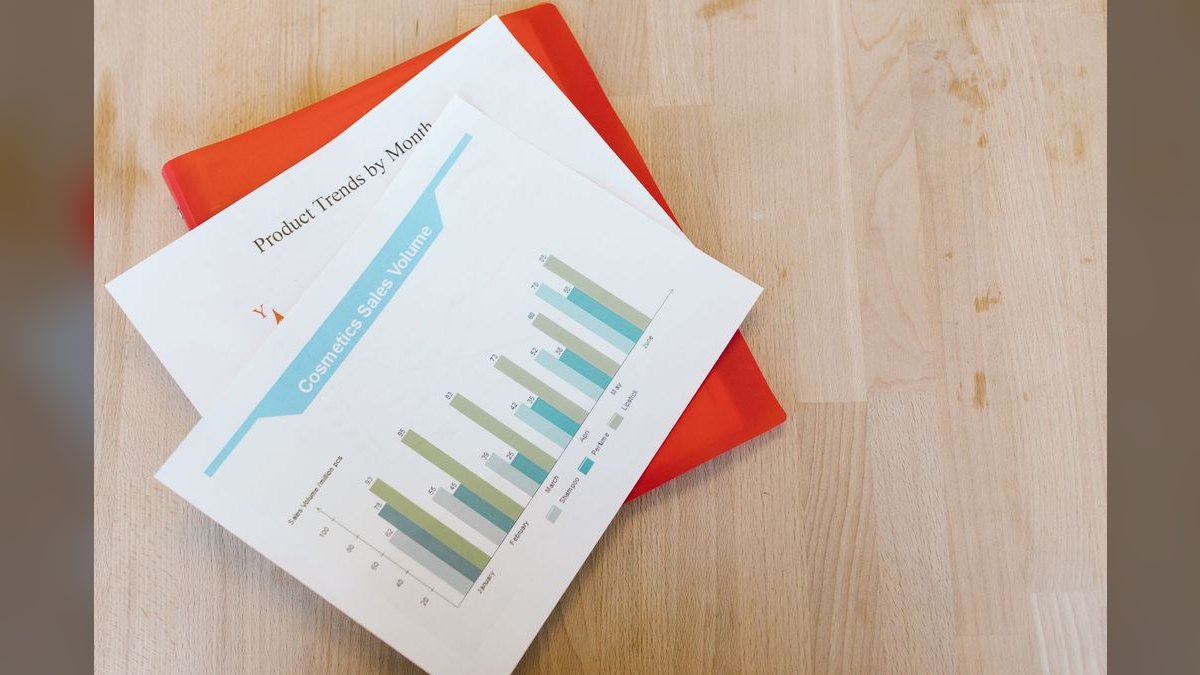
Third, expect reorder economics to reveal which accounts actually pay you. First-order gross margin on a new project account averages 42-48% after rush fees, sampling, art charges, and shipping subsidies. Reorder margin on that same account averages 56-64% because the art is digitized, thread colors are locked, and OrderMyGear or an embedded company store handles checkout with near-zero rep time. The outcome you are buying is a book of accounts whose second and third orders are far more profitable than their first — and a sales team that knows it.
What drives that outcome
The outcome is driven by four mechanics unique to this Decoration industry, and the reporting cadence that keeps sales aligned with the production floor.
Decoration method drives margin, not the garment. Reps who anchor on garment cost and add a flat per-piece decoration fee underprice every job. The margin lives in stitch count, color count, and multi-location placement, so the pricing system has to reason in blended margin, never garment markup plus a flat add-on.
Two buying committees, one shop. Project work runs through coaches, athletic directors, event coordinators, and marketing managers who want a 10-14 day turn, buy one to three times a year, and price-shop. Program work runs through HR directors, brand managers, and procurement teams who want consistency, branded portals, and 24-36 month contracts. A rep selling both lanes without segmented pipeline reporting lets the slower program lane starve.
Equipment utilization is a sales constraint. A shop with eight Tajima embroidery heads and one ROQ automatic press has a hard ceiling on stitches-per-day and impressions-per-hour. Book past 85% utilization and lead times slip from 10 days to 21, service fails, and programs churn. Sales velocity must be governed by live floor capacity.
Reorder is where the money lives. The digitized file, locked colors, and self-serve store turn every repeat order into near-pure margin, so the metric that predicts account profitability is reorder velocity, not first-order size.
Because two clocks govern the business — the project sale closing in 5-21 days and billing once, the program sale closing in 45-120 days but billing monthly for 18-36 months — any KPI that blends the two produces garbage. Split first, measure second. That single discipline is what makes every downstream metric trustworthy.
Benchmarks and realistic ranges

Each KPI below has a defensible target range. Treat them as the calibration a practitioner can act on this quarter.
Recurring-program revenue share. Pull it from your order management system tagged at the account level, not the order level. Pure project shops sit under 25% and fight the January and August revenue troughs. Healthy is 45-60%. Give reps a program-revenue sub-quota so the number moves.
Average order value, split by lane. Project AOV benchmark is $1,800-$4,200 (a 24-piece team uniform set up to a 200-piece event spirit-wear run). Program reorder AOV is $380-$950 (an employee onboarding kit or a quarterly store window). A project AOV under $1,400 means you are competing on price and losing to a cheaper regional embroiderer; a program reorder AOV under $300 means the store assortment is too thin or shipping policy is killing add-ons. A rolled-up AOV hides both problems.
Gross margin by decoration method. Embroidery: 55-65% at 6,000-12,000 stitch counts on 24+ piece runs. Screen print: 48-58% on four-color, 48+ piece runs, dropping toward 38% under 24 pieces. DTG (direct-to-garment): 38-48%, because ink on dark garments runs roughly $1.10-$2.40 per impression on Kornit or Brother fleets. Heat transfer (CAD-cut vinyl or sublimated transfers from an Epson SureColor): 50-60% on small runs. A shop at 70% screen and 15% embroidery has a different P&L than one at 50% embroidery and 30% screen at identical revenue.
Company-store activation rate. For shops running branded stores via OrderMyGear, InkSoft Stores, or custom Shopify builds, this is the share of contracted store accounts that produced at least one order in the trailing 90 days. Target 75%+. Under 60% means the stores are dormant and the program is a churn risk — usually fixed by an account manager refreshing the assortment and triggering an internal email blast, not by product changes.
Reorder velocity (60/90/180 day). Of accounts placing a first order in month T, benchmark 25% reorder by T+60, 38% by T+90, and 55% by T+180 for project accounts; program accounts should run 80%+ at 90 days by definition. A 60-day reorder under 18% signals a broken post-sale handoff — a missing art-approved follow-up, a missing store invite, or a skipped day-30 check-in.
Garment-cost-to-decoration ratio. The split between garment cost and decoration revenue on the average invoice. Healthy is 40/60 to 55/45, with decoration the larger line. A 70/30 garment-heavy invoice means you are effectively a wholesale distributor with a logo machine, earning distributor margins. Push the ratio with stitch count, color count, multi-location decoration, premium garments, and bag-and-tag services.

Production-floor utilization. Target 78%+ scheduled embroidery head-hours on a Tajima or Brother PR-Series floor, 70%+ automatic-press hours on an M&R or ROQ Evolution, and roughly 65%+ of rated DTG impression capacity. Under 65% utilization is the signal to push rush orders; sustained 85%+ is the signal to hold standard lead times rather than quote a 10-day turn into a 21-day backlog.
Sample-to-program conversion. Of program opportunities receiving a sample kit (typically 6-12 garments decorated across embroidery, screen, and heat transfer with the buyer's logo), benchmark 35-50% signing a contract within 90 days. Under 25% means samples are reaching unqualified buyers or the kit does not match the eventual assortment. Charging $150-$400, refundable against the first order, filters tire-kickers and lifts conversion.
Rep quota attainment (decorated revenue per AE per month). Inside reps on project work and small stores: $65k-$95k. Outside reps on program accounts and large uniform contracts: $85k-$110k. National account reps on Fortune 1000 brand-merch programs: $140k-$220k. If 40%+ of reps miss quota two quarters running, the problem is territory design or product mix — not the reps.
Risks, edge cases, and failure modes
The most expensive failure mode is quoting on garment margin instead of blended margin. A rep anchors on the SanMar or S&S Activewear garment cost, marks it 40%, then bolts on decoration at a flat per-piece fee. A 24-piece embroidered polo run that should bill at 56% blended margin ships at 38%. The fix is to load pricing in InkSoft or Printavo with margin-target rules — not flat per-piece rates — and force the system to refuse a below-target quote without a sales-manager override.
The second failure mode is letting the program pipeline starve. Program sales take 45-120 days and pay no commission until signature, while project sales close in two weeks and pay this month. Without a separated program quota and a separated program pipeline review, reps abandon program work mid-cycle to chase the next project order. The shop makes its number this quarter and starves next year's recurring revenue — the exact outcome the KPIs exist to prevent.
Third is having no live floor-capacity visibility for sales. When scheduling lives on the production manager's whiteboard or a standalone spreadsheet while reps quote lead times from memory, the shop overpromises through every peak — August school, November holiday, March spring sports — then eats service failures and program cancellations. The fix is a shared utilization dashboard pulling from both order intake and the production schedule.

Fourth is treating samples as a cost instead of a qualification gate. Shops that hand decorated kits to anyone who asks burn $120-$280 per kit in garment, decoration, and rep time on unqualified buyers. The best operators charge a refundable fee against the first order, require a signed sample-request form with intended program scope, and treat sample-to-program conversion as a gating KPI rather than a courtesy.
Edge cases worth naming: hybrid accounts that buy both project and program need order-level tags layered on top of the customer-level lane tag, or their margins blur. Seasonal shops should staff variable labor before buying another Tajima head that sits idle in February — the decoration equipment ROI window is typically 14-26 months at full utilization, so a machine bought for two peak months rarely pencils. And a single vanity metric — total top-line revenue — will quietly reward the least profitable behavior in the whole Commercial Apparel decoration business, which is why margin-dollars-per-production-hour has to be the headline number the sales floor sees.
A practical rollout plan
Instrument the two lanes in the first 30 days, fix pricing and pipeline in the next 30, and lock in the recurring engine by day 90.
Days 1-30: Instrument. Tag every account in InkSoft, Printavo, or your order management system as project, program, or hybrid — no untagged accounts. Stand up a margin-by-decoration-method report; export weekly to a spreadsheet if the system cannot produce it natively. Audit the last 90 days of quotes and count how many shipped under target margin, and which reps and customer types drive it. Build a sample-request form that gates every kit on program scope, expected first-order size, and decision timeline. Get a live floor-utilization read in front of the sales team daily, even if it is just a screenshot of the production schedule.
Days 31-60: Fix. Reset decoration pricing with margin-target rules so no per-piece flat rate can undercut the floor without manager approval. Split any dual-lane rep's quota into a project quota and a program quota, reviewed separately in weekly one-on-ones. Launch a 60-day post-shipment reorder trigger — automated email plus an AE call — on every first-order project account, and watch the 60-day reorder rate lift. Audit dormant company stores with no order in 90 days, then either reactivate with a customer-side campaign or sunset them and reclaim rep time. Begin charging the refundable sample fee; expect a 20-30% drop in sample volume and a meaningful lift in sample-to-program conversion.

Days 61-90: Lock in. Set and hit a recurring-program revenue share floor — 45% is the bottom of healthy — and weight the comp plan to value program revenue 1.3-1.5x project revenue. Stand up a quarterly review for the top 25 program accounts, where the account manager presents a one-page health doc covering activation rate, reorder velocity, AOV trend, and at-risk signals. Build the equipment capacity plan for the next two peak seasons; if embroidery utilization holds above 82%, start the procurement cycle on another Tajima or Brother PR-Series machine. Rebalance territories on 90 days of clean lane-tagged data so program reps stop carrying one-off project work and project reps stop carrying national program accounts.
The plan works because each phase feeds the next: clean lane tags make the margin report trustworthy, the margin report justifies the pricing rules, and the pricing rules plus split quotas make the recurring-revenue floor reachable without heroics.
Related questions
How is this different from measuring KPIs for a plain apparel retailer?
A retailer optimizes sell-through and inventory turns on finished goods. A decorator optimizes margin-per-production-hour on a service applied to blanks, so utilization, decoration-method margin, and reorder velocity dominate — metrics a retail P&L never tracks.
Which single KPI should a project-heavy shop fix first?
Recurring-program revenue share. It is the metric most correlated with escaping seasonal revenue swings, and moving it forces the downstream fixes — lane tagging, split quotas, and comp changes — that stabilize the entire business.
How often should these metrics be reviewed?
Daily for floor utilization and quote-to-order rate, weekly for bookings-by-lane and store activations, monthly for decorated revenue per AE and margin-by-method, and quarterly for reorder cohort curves and capacity planning against forecasted demand.
Do these benchmarks hold for a small regional embroiderer?
The ranges hold, but small shops should weight utilization and reorder velocity hardest, since one idle Tajima head or one broken reorder handoff moves their P&L far more than it moves a distributor-scale operation's.
FAQ
How do I separate project margin from program margin if my system tags everything as a single order?

Tag at the customer-record level, not the order level. In InkSoft, Printavo, or a custom Shopify setup, add a "lane" custom field with values project, program, or hybrid, and let every order inherit it. For hybrid customers, tag the individual order when it ships from a company-store URL versus a quote-driven sale. It is a half-day setup, not a system replacement.
What is a realistic recurring-program revenue share if my shop has always been project-driven?
Year one, push toward 25-30%. Year two, target 40%. Year three, target 50%+. The blocker is rarely customer demand — it is sales behavior. Project reps avoid the longer program cycle and delayed commission, so comp changes such as a program multiplier, a launch bonus, and a monthly residual on active stores shift behavior faster than training.
How do I price embroidery versus screen versus DTG without losing deals on the high-cost methods?
Price the outcome, not the method. A 24-piece uniform with a left-chest logo plus back name and number should carry one bundle price, not separate embroidery, screen, and garment lines. Buyers demanding method-by-method pricing are usually shopping you against a competitor, and you have likely already lost the relational sale. Bundle the number and protect blended margin in the pricing engine.
My floor is at 95% utilization in peak season and we are losing rush deals — hire or buy?
Both, in order. First hire a seasonal embroidery operator and a part-time press operator for the August-through-December and March-through-May peaks; variable labor beats another Tajima head idle in February. If utilization holds above 85% across a full year, then buy capacity — another Tajima or Brother PR-Series, or a ROQ Evolution if screen is the bottleneck.
Should we build our own company-store platform or use OrderMyGear or InkSoft Stores?
Use OrderMyGear or InkSoft Stores unless you have a software team and a clear differentiation thesis. A custom build runs roughly $180k-$450k plus $60k-$120k a year to maintain, while per-store platform pricing pays off past eight to twelve active stores. Customize within the platform — branded URLs, custom assortments, EDI for large accounts — before considering a build.
How do I measure rep performance fairly when account quality varies across territories?
Use decorated revenue per AE per month as the headline, but split it by lane and adjust for account density. A rep inheriting 40 active program accounts should carry a higher program quota than one building a new territory. Layer activity metrics — sample kits shipped, discovery calls held, quotes sent — for ramping reps so slow early pipeline does not unfairly penalize them.
Sources
- SanMar decoration services and dealer drop-ship-decorated program documentation, sanmar.com
- Vantage Apparel B2B custom apparel and corporate program case studies, vantageapparel.com
- alphabroder distributor and decoration services overview, alphabroder.com
- S&S Activewear company-store program and distributor reporting, ssactivewear.com
- Cintas uniform and facility services revenue mix from public filings, cintas.com
- Tajima embroidery machine head capacity specifications, tajima.com
- Brother USA PR-Series embroidery and GTX DTG specifications, brother-usa.com
- Kornit Atlas Max DTG ink and impression benchmarks, kornit.com
- OrderMyGear company-store platform and activation benchmarks, ordermygear.com
- ASI Central and PPAI industry research on decoration and program benchmarks, asicentral.com and ppai.org
Related on PULSE
- What are the key sales KPIs for the Uniform Rental and Workwear Services industry in 2027?
- What are the key sales KPIs for the Athletic Apparel and Footwear industry in 2027?
- What are the key sales KPIs for the Fast Fashion Apparel industry in 2027?
- Top 10 Apparel Retail Revenue KPIs
- Top 10 Commercial Real Estate Revenue KPIs
This page will be disappearing soon. Save it to your device for $1 — or read it free while it is here.
@Kory-White- · if Venmo asks, the last 4 of my number are 2012
This page is gone.
This one is off the shelf now. $1 keeps it on your phone for good — the whole page, pictures and diagrams included.
 pulse-industry-kpisTop 10 Sales KPIs for Industrial Cybersecurity (OT/ICS) Services in 2027
 pulse-industry-kpisTop 10 Sales KPIs for AI Sales Coaching / Conversation Intelligence in 2027
 pulse-industry-kpisTop 10 Sales KPIs for Commercial Insurance Brokerage in 2027
 pulse-industry-kpisTop 10 Sales KPIs for Commercial Print Services in 2027
 pulse-industry-kpisTop 10 KPIs for HVAC Contractors in 2027
 pulse-industry-kpisTop 10 Sales KPIs for Medical Billing and Revenue Cycle Management in 2027
 pulse-industry-kpisTop 10 Sales KPIs for Architectural Door & Hardware Distribution in 2027
 pulse-industry-kpisTop 10 Sales KPIs for Commercial Hardware Distribution in 2027
 pulse-industry-kpisTop 10 Sales KPIs for Commercial Electrical Contracting in 2027
 pulse-industry-kpisTop 10 KPIs for Barbershops in 2027