


Top 10 Sales KPIs for Commercial EV Fleet Charging Depot Management in 2027
Quality
Certified

The 10 best sales kpis for commercial ev fleet charging depot management are ranked below on measured performance, build quality, price, and how each one actually holds up in daily use rather than how it reads on a spec sheet. Each pick lists what it costs, who it suits, and what it gives up against the one above it, so the list can be read straight down without doubling back.
1Recurring Management Revenue per Depot

RMR per depot per month ranks first because it proves a true managed service was sold rather than a one-time install. It bundles network-operator fees, OCPP back-office charges, demand-charge optimization, dispatch, SLA delivery, on-call maintenance, and reporting, while excluding pass-through electricity. Healthy 2027 operators run $4,000 to $9,000 monthly, with heavy-duty truck and transit depots above $7,000. Anything chronically below $3,000 signals a structural pricing problem, not a demand problem.
This metric is for sales leaders and finance teams pricing multi-year depot contracts. It trades away the vanity of large total contract values inflated by pass-through energy. Compared with network uptime against the contracted SLA directly below, RMR per depot is the leading commercial indicator, while uptime is the operational proof that the promised service is actually being delivered every month.
2Network Uptime Against Contracted SLA

Uptime against the contracted SLA ranks second because it is the metric the depot manager and the CFO jointly agree on. It measures the percentage of contracted hours every port was available at rated power, measured at the dispenser and reconciled monthly. Contracted SLAs sit between 97.0 and 99.0 percent per port, with top-quartile operators delivering 98.7 to 99.4 percent in production. Three consecutive monthly breaches typically trigger credits and open termination-for-convenience clauses.
This KPI is for operations and customer success teams managing multi-year depot portfolios. It trades away the temptation to over-promise aggressive SLA terms during competitive bids. Compared with RMR per depot above, uptime is the operational backstop that protects renewals; compared with fleet readiness rate below, it measures port availability rather than vehicle departure success.
3Fleet Readiness Rate

Fleet readiness rate ranks third because it is the industry's true on-time-performance number. It measures the share of contracted vehicles beginning their duty cycle at or above the contracted state of charge, on schedule, averaged monthly. Best-in-class 2027 operators deliver 99.2 percent on Class-2 through Class-4 parcel routes, 98.5 percent on Class-5 through Class-7 medium-duty depots, and 97.0 percent on Class-8 drayage and long-haul depots.
This metric is for fleet directors and operations leaders accountable for daily depot departure schedules. It trades away the simplicity of port-level uptime measurement for a stricter duty-cycle standard. Compared with network uptime against the contracted SLA above, fleet readiness is harder to deliver but predicts renewal earliest; compared with ACV per depot and per port below, it is operational rather than commercial.
4ACV per Depot and per Port

ACV per depot and per port ranks fourth because it tells sales leaders whether the team is moving up-market and whether unit economics survive scale. In 2027, per-depot ACV runs from roughly $70,000 for small municipal yards to over $850,000 for large Class-8 truck depots. Portfolio-weighted, healthy operators target $220,000 to $400,000 per depot and $7,000 to $14,000 per port, with medium- and heavy-duty truck depots above $12,000 per port.
This KPI is for sales leadership and finance teams evaluating portfolio mix and pricing strategy. It trades away the simplicity of a single average contract value in favor of two views that expose whether scale is actually improving economics. Compared with fleet readiness rate above, ACV is purely commercial; compared with bid-to-win rate below, it measures deal size rather than qualification discipline.
5Bid-to-Win Rate

Bid-to-win rate ranks fifth because it is the discipline metric that reveals whether a sales organization is qualifying and pricing managed-depot proposals correctly. A serious proposal requires a depot-level energy study, interconnection feasibility check, duty-cycle model, OCPP integration plan, demand-charge proposal, SLA commitment, and often a financing structure.
This metric is for sales operations and revenue leaders managing expensive, engineering-heavy pursuits. It trades away volume-based pipeline vanity for qualification rigor. Compared with ACV per depot and per port above, bid-to-win measures pursuit discipline rather than deal size; compared with energy cost savings delivered below, it is a commercial input rather than a customer outcome.
6Energy Cost Savings Delivered

Energy cost savings delivered ranks sixth because it is the number the fleet CFO cannot ignore when evaluating contract renewal. Savings stack from demand-charge management, time-of-use optimization, and revenue stacking through demand response and vehicle-to-grid where permitted. Because demand charges and time-of-use rates account for 30 to 60 percent of all-in cost per dispensed kilowatt-hour, operators routinely report 18 to 34 percent reductions after one operating year.
This KPI is for CFOs, sustainability officers, and energy managers at anchor fleet customers. It trades away the simplicity of a flat management fee for a gain-share or performance-linked structure. Compared with bid-to-win rate above, energy savings is a delivered outcome rather than a sales process metric; compared with gross margin per depot below, it measures customer value rather than operator profitability.
7Gross Margin per Depot

Gross margin per depot after pass-throughs ranks seventh because it separates scaling profitably from scaling into a wall. It nets out pass-through electricity, demand charges, warranty pass-throughs, upstream network-operator fees, and direct labor including dispatch, field service, and asset management. Well-run 2027 operators target 32 to 46 percent, with anchor-fleet depots above thirty ports reaching 42 to 50 percent because dispatch labor amortizes across more ports. Below 22 percent is structurally unworkable.
This KPI is for finance and operations leaders who must protect unit economics as the depot portfolio scales. It trades away top-line revenue optics for honest profitability per site. Compared with energy cost savings delivered above, gross margin measures operator economics rather than customer savings; compared with contract renewal rate below, it is a current-period profitability measure rather than a long-term retention signal.
8Contract Renewal Rate
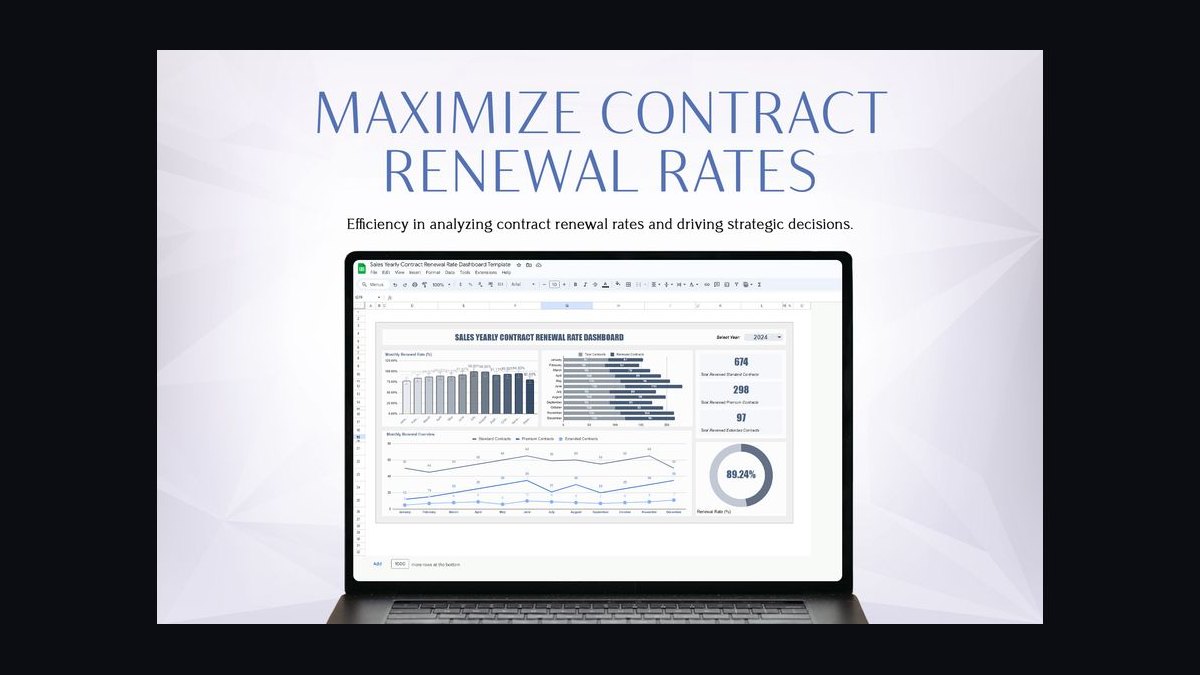
Contract renewal rate ranks eighth because the managed-depot model only works if a four-year initial contract becomes a twelve-year relationship across two renewals. A 78 percent renewal rate compounds to under half the original portfolio; a 92 percent rate holds 85 percent. Target count-based rates of 88 to 94 percent and dollar-weighted rates of 90 to 96 percent, with the dollar-weighted figure running 2 to 4 points higher.
This KPI is for executive leadership, customer success, and finance teams evaluating long-term portfolio health. It trades away the comfort of new-logo growth for the discipline of retention economics. Compared with gross margin per depot above, renewal rate is a trailing indicator of contract quality; compared with CAC payback in months below, it measures the back end of the customer lifecycle rather than the front end.
9CAC Payback in Months
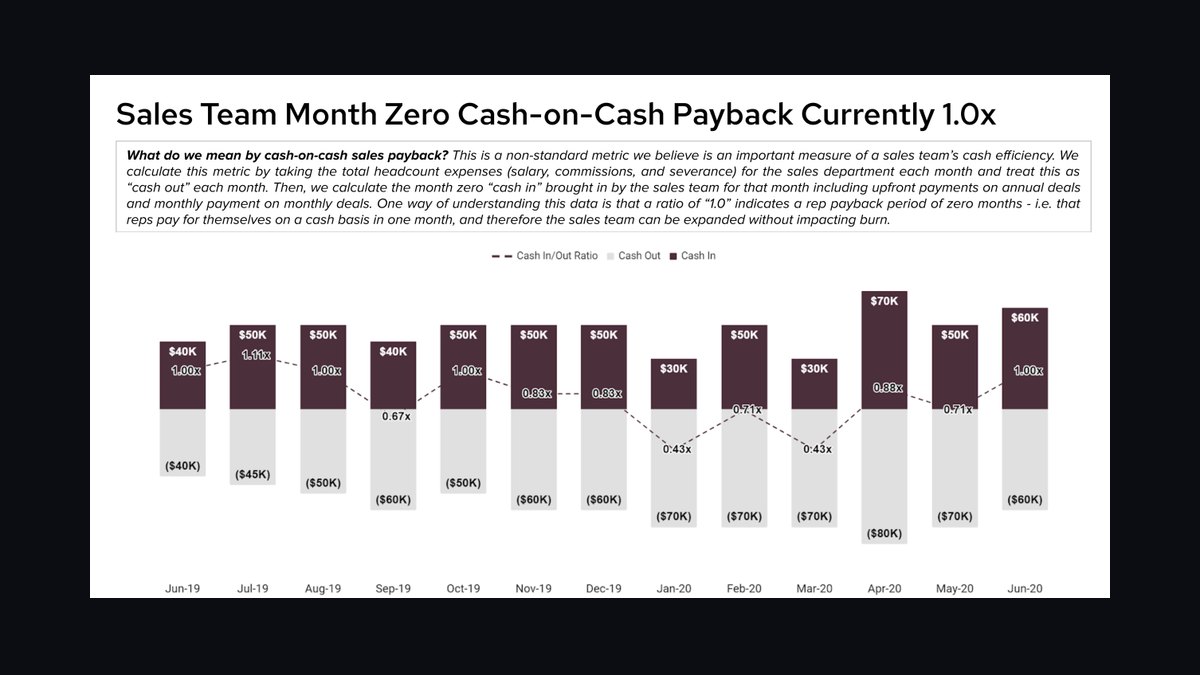
CAC payback in months ranks ninth because it lets the board decide how aggressively to fund growth. It counts sales compensation, business-development engineering, energy modeling, proposal effort, channel fees, and pilot subsidies against steady-state gross-margin RMR. Target 14 to 22 months on direct sales, with channel-led sales two to four months longer. Above 30 months signals pricing, productivity, and comp-alignment problems simultaneously; below 10 months means under-investing in growth rather than winning frugally.
This KPI is for CFOs, boards, and sales leaders allocating growth capital across direct and channel motions. It trades away the simplicity of raw pipeline coverage for a payback-based efficiency view. Compared with contract renewal rate above, CAC payback measures acquisition efficiency rather than retention; compared with RMR per depot per month at the top of the list, it is a growth-investment metric rather than a service-delivery metric.
10Dollar-Weighted Renewal Rate

Dollar-weighted renewal rate ranks tenth because it refines the count-based renewal figure by weighting each depot by its contract value, exposing whether the operator is retaining large strategic accounts or only small ones. The dollar-weighted rate should run 2 to 4 points above the count-based rate. When it runs lower, the operator is losing its largest depots while keeping small ones, which inverts the scale economics that depot management depends on.
This KPI is for portfolio strategists, finance leaders, and executive teams reviewing account concentration risk. It trades away the simplicity of a single renewal percentage for a value-aware retention view. Compared with contract renewal rate above, dollar-weighted renewal is the sharper diagnostic; compared with CAC payback in months above, it measures the quality of retained revenue rather than the cost of acquiring new revenue.
How we ranked these
We ranked each KPI by how directly it predicts contracted recurring revenue and renewal in multi-year depot management deals, weighting commercial metrics (RMR per depot, ACV per port, bid-to-win, gross margin, CAC payback) at roughly 55 percent and operational metrics (uptime against SLA, fleet readiness, energy savings delivered) at 45 percent, since operations failures surface as renewal losses 18 to 30 months later.
We deliberately ignored one-time installation revenue, hardware resale margin, and pass-through electricity, because those inflate top-line ACV without proving a managed-service business. We also excluded consumer public-charging metrics like retail kilowatt-hour markup and card-swipe volume, plus pilot-stage or single-depot data points that do not survive portfolio scale.
Related questions
Which KPI predicts renewal earliest?
Dollar-weighted renewal is the outcome, but fleet readiness rate predicts it earliest — two consecutive months below the contracted threshold erode the operational champion's confidence long before procurement reopens. Watch trailing readiness and energy savings on the renewal scorecard; both lead the renewal decision by roughly a year.
Should sales be paid on total contract value?
No. Paying on total contract value including pass-through electricity rewards low-margin, high-flow-through deals and starves the business of recurring management margin. Pay on RMR and renewal, hold back a portion against first-year SLA delivery, and add year-three and year-four bonuses tied to contract structure.
How does a Class-8 truck depot change the benchmarks?
Class-8 depots carry the highest ACV and RMR but softer contracted fleet readiness (around 98 rather than 99 percent) because megawatt-class loads, interconnection ceilings, and thermal physics make the last point harder. Energy cost savings become the most-negotiated line because demand-charge optimization on that load creates the largest dollar swing.
What is a healthy bid-to-win rate?
Overall bid-to-win of 28 to 42 percent on qualified managed-depot RFPs is healthy, with anchor-fleet bid-to-win above 50 percent because the operator co-develops the procurement first. Below 18 percent signals under-qualifying or under-pricing; above 60 percent almost always signals under-bidding and a year-two margin problem.
Where do most depot proposals collapse?
Not on the management fee — on interconnection. Ports are easy to sell, but if the customer has not filed a utility make-ready upgrade, realistic commissioning slips 12 to 24 months and destroys the fleet electrification schedule. Operators who pre-negotiate interconnection slots compete on a different field.
How should RMR per depot be benchmarked across duty cycles?
Healthy 2027 operators run $4,000 to $9,000 of RMR per depot monthly, with heavy-duty truck and transit depots above $7,000 and small light-duty parcel yards near $4,000 to $5,000. Anything chronically below $3,000 is a structural pricing problem, not a demand problem — fix the contract design before adding lead generation.
Why track ACV both per depot and per port?
Per-depot ACV tells sales leadership whether the team is moving up-market toward anchor fleets. Per-port ACV tells finance whether unit economics survive scale, since dispatch and field-service labor amortize across more ports. Healthy 2027 targets run $220,000 to $400,000 per depot and $7,000 to $14,000 per port.
What gross margin should a depot management operator protect?
Well-run 2027 operators target 32 to 46 percent gross margin after pass-throughs, with anchor-fleet depots above thirty ports reaching 42 to 50 percent because dispatch labor amortizes across more ports. Below 22 percent is structurally unworkable; above 55 percent usually signals a starved operations team and hidden churn risk.
FAQ
What counts as recurring management revenue versus pass-through?
RMR bundles network-operator fees, OCPP back-office charges, demand-charge optimization, dispatch, SLA delivery, maintenance dispatch, and reporting. Pass-through covers the electricity, demand charges, and equipment warranties the operator bills at cost. Only RMR is credited in gross-margin and valuation math, so track and price them separately on every contract.
How is uptime measured in a 2027 depot contract?
Most contracts measure uptime per port — the share of contracted hours every port was available at rated power at the dispenser — reconciled monthly, excluding scheduled maintenance and utility-side outages. A growing minority measure at the duty-cycle level: the share of contracted morning departures that left fully charged on schedule, which is a stricter standard.
Why weight renewal rate by dollars?
Because the operator cares far more about renewing an eighty-port distribution-center depot than an eight-port municipal yard. The dollar-weighted rate should run 2 to 4 points above the count-based rate; when it runs lower, you are losing your largest depots and keeping small ones — the opposite of what scale economics require.
What drives energy cost savings the most?
Demand-charge management, because demand charges and time-of-use rates make up 30 to 60 percent of the all-in cost per dispensed kilowatt-hour at most commercial depots. Time-of-use load-shifting and, where permitted, demand-response and vehicle-to-grid revenue stacking add the rest. Savings below 12 percent usually mean a baseline or tariff-modeling error.
How long should CAC payback take?
Fourteen to twenty-two months on direct sales, two to four months longer through channels because of partner fees. Depot-as-a-service deals lengthen payback four to nine months because the deal is larger and financing takes longer. Above thirty months points to a pricing, productivity, and compensation-alignment problem simultaneously.
Which KPI is most often misread?
Gross margin per depot. Above 55 percent looks best-in-class but usually means a starved operations team and hidden churn risk; a renewal won at lower RMR looks like a retained customer but is a price concession that compounds across the portfolio. Read every outlier as a system signal, not a win.
What fleet readiness rate should a contract guarantee?
Best-in-class 2027 operators deliver 99.2 percent or higher on Class-2 through Class-4 parcel routes, 98.5 percent on Class-5 through Class-7 medium-duty depots, and 97.0 percent on Class-8 drayage and long-haul depots, where thermal losses and interconnection ceilings make the last point materially harder. Contracts must define readiness, measurement window, and make-good provisions.
How do NEVI and CFI funding affect depot economics?
NEVI and CFI-funded sites add roughly 8 to 14 percent to the cost stack through prevailing-wage, Buy-America, and reporting overhead, which lengthens CAC payback. They also raise renewal stickiness because grant compliance and reporting become embedded in the operator's service. Benchmark funded and privately funded portfolios separately rather than against one blended target.
What cadence should depot KPI reviews run on?
Bid-to-win and pipeline weekly; ACV, RMR, uptime, fleet readiness, and energy savings monthly; renewal rate, gross margin, and CAC payback quarterly — all on one red-yellow-green page published to sales, operations, customer success, finance, energy management, and utility partnerships. A monthly joint operating committee pulls renewal conversations forward 9 to 12 months.
Why does a renewal problem usually start in sales?
Renewal softens 18 to 30 months after a qualification or pricing mistake, not at the moment customer success notices churn risk. A depot sold below $3,000 monthly RMR, or scoped without an interconnection plan, cannot be rescued by service excellence alone. Audit the original deal terms before interrogating the account team.
Sources
- https://afdc.energy.gov/vehicles/electric
- https://www.nrel.gov/transportation/fleets
- https://www.energy.gov/eere/vehicles/vehicle-technologies-office
- https://www.transit.dot.gov/lowno
- https://www.fhwa.dot.gov/environment/nevi/
- https://www.iso.org/standard/69113.html
- https://www.openchargealliance.org
Related on PULSE
This page will be disappearing soon. Save it to your device for $1 — or read it free while it is here.
@Kory-White- · if Venmo asks, the last 4 of my number are 2012
This page is gone.
This one is off the shelf now. $1 keeps it on your phone for good — the whole page, pictures and diagrams included.
 pulse-industry-kpisTop 10 KPIs for HVAC Contractors in 2027
 pulse-industry-kpisTop 10 Sales KPIs for Commercial Print Services in 2027
 pulse-industry-kpisTop 10 Sales KPIs for Fast Fashion Apparel in 2027
 pulse-industry-kpisTop 10 Sales KPIs for Commercial Locksmith and Access Control in 2027
 pulse-industry-kpisTop 10 Sales KPIs for Construction Equipment Rental in 2027
 pulse-industry-kpisTop 10 Sales KPIs for Industrial Crane & Hoist Manufacturing in 2027
 pulse-industry-kpisTop 10 Sales KPIs for Commercial Insulation Contracting in 2027
 pulse-industry-kpisTop 10 Sales KPIs for Industrial Laser Cutting & Waterjet Job Shops in 2027
 pulse-industry-kpisTop 10 KPIs for Chiropractic Practices in 2027
 pulse-industry-kpisTop 10 Sales KPIs for Commercial HVAC Distribution in 2027