


Top 10 Sales KPIs for Commercial Tile and Stone Contracting in 2027
Quality
Certified

The 10 best sales kpis for commercial tile and stone contracting are ranked below on measured performance, build quality, price, and how each one actually holds up in daily use rather than how it reads on a spec sheet. Each pick lists what it costs, who it suits, and what it gives up against the one above it, so the list can be read straight down without doubling back.
1Bid-Hit Rate by Procurement Type

Bid-hit rate ranks first because it is the fastest diagnostic of whether a shop sells on relationship or on price. Segmented benchmarks: hard-bid public work runs 8-14% healthy, negotiated design-assist private work 18-28%, and repeat-GC pull-through 35-55%. Lumping all bids into one number hides where the margin actually originates.
This is for the preconstruction director or VP who owns the markup matrix and top-GC relationships, not a junior estimator. It trades away simplicity — three segments means three targets and three review cadences. Compared to pipeline coverage directly below, bid-hit is the lagging confirmation; coverage tells you whether next quarter's bids exist at all.
2Pipeline Coverage Ratio
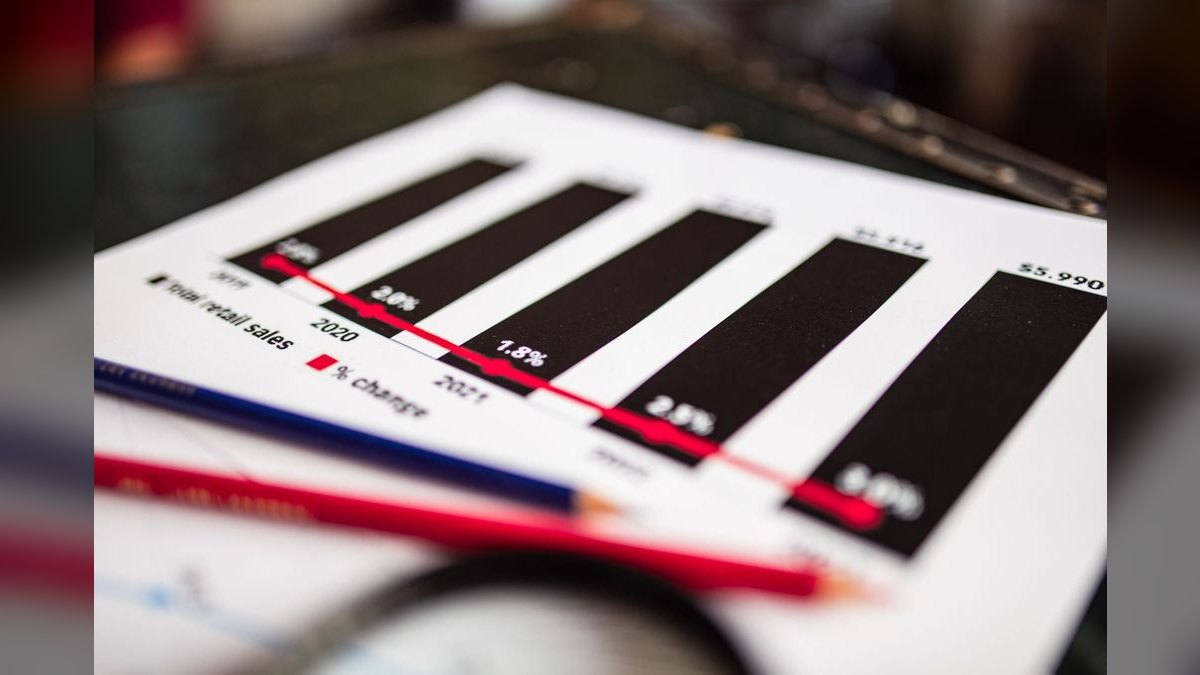
Pipeline coverage ranks second because it predicts revenue holes six to nine months before they appear on the P&L. Weighted pipeline divided by trailing 12-month revenue should sit at 4x-6x for tile-dominant shops and 5x-7x for stone-heavy work. Below 3x forecasts a hole; above 8x usually means estimating capacity is burning on unwinnable bids.
It is built for the sales lead running a weekly pipeline review, not for finance. The trade-off is that coverage is easy to inflate with stale or unqualified opportunities, so it only works when every bid carries a stage, probability, and named decision-maker. Compared to bid-hit rate above, coverage is the leading indicator and settles first.
3Average Project Value Trend

Average project value ranks third because a two-quarter decline is the quietest signal that negotiated relationships are eroding. Tile-only commercial work runs $85k-$650k, stone slab packages $250k-$2M+, and full-property hotel packages $1.2M+. Shops drifting down are backfilling with smaller, thinner-margin jobs carrying identical management overhead.
This metric belongs to ownership and the business development lead, since it exposes strategy rather than execution. It trades away short-term revenue optics — declining ACV rarely shows up until margin compresses two quarters later. Compared to installed gross margin below, ACV is the earlier warning; margin is the confirmation that job selection actually deteriorated.
4Installed Gross Margin by Material

Installed gross margin ranks fourth because it is the number that survives closeout or evaporates during it, and material type sets the ceiling. Ceramic and porcelain run 22-32%, large-format porcelain over 24x48 inches 25-35%, natural stone 28-38%, and poured-in-place terrazzo 30-40% where competition is thinnest. Hard-bid work caps near 20-24% regardless of install quality.
This is for the estimator and preconstruction lead setting the markup matrix, not the field superintendent. It trades away volume — chasing terrazzo and stone margins means fewer, larger, more complex jobs. Compared to revenue per installer below, margin measures pricing discipline while revenue-per-installer measures how efficiently the crew calendar converts that pricing into installed square footage.
5Revenue per Skilled Installer

Revenue per skilled installer ranks fifth because labor is the binding constraint on growth, not demand. Healthy shops run $185k-$275k annually per skilled installer; top-quartile shops reach $240k-$310k through tighter journeyman-to-apprentice ratios and disciplined job selection. Shops that plateau near $12-15M in revenue almost always stall here.
It is aimed at operations and sales leadership jointly, since selling work the crew calendar cannot absorb produces slip and callbacks instead of revenue. The trade-off is that pushing this number too hard invites apprentice-heavy crews doing journeyman work. Compared to installed gross margin above, revenue-per-installer is the efficiency counterweight — margin can look fine while labor productivity quietly caps the shop's ceiling.
6Schedule Slip Working Days

Schedule slip ranks sixth because GCs share performance history informally across their own bid networks, making slip a sales metric disguised as an operations one. Under 8 working days on a 90-day install window, or 14 days on a 180-day window, keeps a shop on the preferred list. Slip beyond that quietly suppresses repeat-award rates.
This belongs to project managers and the sales lead jointly, since PM performance directly determines whether the next negotiated bid gets invited. It trades away aggressive scheduling — accepting overlapping jobs that need the same crew in the same month is the most common cause of slip. Compared to change order capture below, slip is the relationship risk while change orders are the margin risk on the same project.
7Change Order Capture Rate
Change order capture ranks seventh because it is where negotiated margin either gets documented or silently eaten. Healthy negotiated work captures 6-12% of contract value in change orders; hard-bid work 3-7%. Turnaround from request to approval should stay under 12 working days. Verbal approvals of $3k-$15k scope changes are the primary leak.
This is for project managers and the preconstruction lead, not the field crew. It trades away GC comfort — insisting on paper for small changes strains relationships that drive future negotiated invitations. Compared to AR days-to-cash below, change order capture protects the contract value while AR protects when that value actually converts to cash.
8AR Days-to-Cash

AR days-to-cash ranks eighth because commercial payment includes retention, extending the real cycle far beyond the invoice date. Healthy DSO runs 52-78 days, or 120-220 days including retention release. Slow collection on a 30% margin job erodes working capital faster than a thin-margin job that pays in 45 days.
It is owned by the controller and project executive, with sales accountability for the GC relationships that determine payment behavior. The trade-off is that pushing collection hard can damage the same relationships that generate negotiated bids. Compared to warranty callback cost below, AR measures cash timing while callbacks measure the goodwill that determines whether the next bid gets invited at all.
9Warranty Callback Cost Percentage

Warranty callback cost ranks ninth because tile and stone finish 70%+ of commercial interiors, so every upstream trade's mistake becomes a callback attributed to the finish contractor. Healthy shops stay under 1.4% of project revenue; top quartile runs under 0.8%. Category-level tracking points at the specific crew or spec causing the bleed.
This is for operations leadership and the sales lead, since rising callbacks burn the GC goodwill the buyer triangle depends on. It trades away short-term cost savings — fixing a recurring spec problem costs money before it saves any. Compared to AR days-to-cash above, callbacks are the downstream sales signal while AR is the downstream cash signal.
10GC Concentration Risk

GC concentration ranks tenth because it is the metric that makes every other KPI look healthy right up until it does not. Any single general contractor above roughly 22% of revenue turns a sales relationship into a dependency; a schedule dispute or leadership change at that GC can remove a fifth of backlog in one conversation. It belongs in the same quarterly review as the trend lines.
This is for ownership and the business development lead, not the estimating team. The trade-off is deliberate diversification — spreading effort across lower-volume GCs costs short-term efficiency and estimating capacity. Compared to bid-hit rate at the top of this list, concentration is the structural risk that bid-hit segmentation can mask for several quarters before it surfaces.
How we ranked these
We ranked nine sales KPIs by how directly each one predicts backlog health, margin durability, and repeat-award rate for commercial tile and stone contractors. Weighting favored metrics tied to negotiated and design-assist work over hard-bid volume, because procurement type drives economics more than raw bid count. Bid-hit rate segmented by procurement type, pipeline coverage, installed gross margin, and change order capture carried the heaviest weight.
We deliberately ignored total revenue, total bids submitted, and headcount growth. Those numbers reward volume chasing and hide the structural problem this segment actually faces: winning low-margin hard-bid work to keep crews busy. We also excluded generic CRM activity metrics like calls logged, since they measure effort rather than whether a GC relationship is producing negotiated invitations.
Related questions
How does bid-hit rate differ between hard-bid and negotiated commercial tile work?
Hard-bid public and institutional work runs 8-14% healthy, since price is often the deciding factor. Negotiated or design-assist private work runs 18-28%, because the relationship removes competitive pressure before the number is submitted. Lumping both together hides which motion is actually funding the backlog.
Why does material lead time matter for a sales pipeline in this industry?
Natural stone slab runs 10-22 weeks and large-format porcelain 6-14 weeks from order to site. Locking selection during design-assist, before bid, prevents schedule risk from being priced into margin loss later. Shops that quote stone cold get squeezed when designers reject slab bundles.
What is a healthy pipeline coverage ratio for a stone-heavy contractor?
5x-7x trailing 12-month revenue, slightly higher than the 4x-6x tile-dominant benchmark, because the longer stone sales cycle needs more weighted pipeline in flight to keep backlog full. Below 3x predicts a revenue hole six to nine months out.
How much does schedule slip actually affect future sales?
Under 8 working days on a 90-day install window is healthy. Slip beyond that gets noticed by GCs even without formal feedback, and repeat-award rates on future bids from the same general contractor drop accordingly. Slip is a sales metric disguised as an operations one.
What drives installed gross margin differences between tile and stone packages?
Ceramic and porcelain run 22-32%, large-format porcelain over 24x48 runs 25-35%, natural stone runs 28-38%, and poured-in-place terrazzo runs 30-40% where competition is thinnest. Material yield, crew skill, and procurement type explain most of the spread between shops.
Why track revenue per skilled installer instead of revenue per employee?
Revenue per skilled installer of $185k-$275k separates shops that scale from shops that plateau around $12-15M. Labor is the binding constraint, so this ratio exposes whether job selection and crew scheduling are actually converting headcount into installed square footage or just stacking overhead.
How should change order capture be measured on negotiated versus hard-bid work?
Negotiated work should capture 6-12% of contract value in change orders with under 12 working days from request to approval. Hard-bid runs 3-7%. A shop below those bands is absorbing scope verbally to keep GCs comfortable, which quietly erases margin before closeout.
What does a rising warranty callback rate signal about the sales motion?
Callback cost above 1.4% of project revenue, versus a top-quartile 0.8%, usually points at over-committed crews, apprentice-heavy staffing on journeyman work, or bad job selection. It burns GC goodwill that the negotiated relationship depends on, so it hits future bid invitations before it hits the P&L.
FAQ
How is commercial tile and stone different from residential for KPI purposes?
Commercial project value runs 5-15x larger, the buyer is a three-party structure of GC, designer, and owner instead of a single homeowner, and the sales cycle runs 6-18 months instead of 4-12 weeks. Pipeline coverage and bid-hit rate matter far more, and AR days-to-cash extends because commercial payment includes retention.
What sales team structure fits a $15-30M commercial tile and stone shop?
Typically one director of estimating or VP of preconstruction managing the markup matrix and top-GC relationships, two to four senior estimators each owning a segment, one business development lead focused on architect and designer spec work, and PMs carrying account responsibility for repeat GCs. Sales and precon headcount usually runs 7-12% of revenue.
How should schedule risk be priced into a bid?
In three layers: a base schedule contingency of 4-7% of labor cost for normal slippage, a material lead-time premium of 2-5% of material cost when stone or large-format tile delivery falls inside the standard lead window, and a crash-schedule multiplier of 8-15% of contract value when the GC requires crew stacking or off-hours work.
When does vertical integration into stone fabrication make sense?
Generally once stone slab work exceeds roughly 35-45% of revenue or $6-9M annually. Below that threshold a water-jet or CNC fabrication line cannot stay utilized enough to justify the capital and skilled-labor investment. Above it, owning fabrication typically adds several points of margin and becomes a scheduling advantage with designers.
How do you build a design-assist pipeline from a standing start?
Identify the top 15-25 architects and 10-15 interior designers in the territory serving the relevant building segments, get onto their continuing-education presentation calendar, build a physical sample library of slabs and mockups, and track relationship-building meetings as a leading sales metric alongside lagging revenue numbers.
What software stack is standard for tracking these KPIs?
Most $10M+ shops run job-cost accounting in Sage 300 CRE or Foundation Software, project management in Procore, estimating and takeoff in Bluebeam Revu, pipeline and CRM in Salesforce or HubSpot, and pay app submission in Textura or GC Pay. Smaller shops often substitute lighter tools but lose commercial-specific workflow support.
What is a realistic 12-18 month outcome after adopting this KPI set?
Not a dramatic revenue jump. It is margin recovery of 3-6 points of installed gross margin from catching change orders, tightening the markup matrix, and reducing warranty callback cost. Revenue per skilled installer moves second, usually 8-15%, because labor is the binding constraint and better job selection gets more installed square footage from the same headcount.
How does GC concentration risk interact with these KPIs?
Any single general contractor above roughly 22% of revenue turns a sales relationship into a dependency. A schedule dispute or leadership change there can remove a fifth or more of backlog in one conversation. Shops can look healthy on every KPI and still be one lost relationship from a revenue crisis.
What is the most common estimating failure mode in this segment?
Quoting off paper plans or spreadsheets instead of a real takeoff system. Mis-measurement averages 4-9% on square footage, and on a $600k stone job at 30% margin, a 6% takeoff error consumes the entire profit. Natural stone priced by gross square footage instead of yield loses another 22-35% of material cost to scrap.
How fast should pipeline coverage and bid-hit rate stabilize before margin moves?
The leading indicators settle first, typically within two to three quarters. Margin and revenue-per-installer follow two to three quarters behind that. Expect pipeline coverage ratio and bid-hit rate to stabilize before either margin or revenue per installer shows meaningful movement.
Sources
- https://www.tcnatile.com
- https://www.agc.org
- https://www.gordian.com
- https://www.ntma.com
- https://www.naturalstoneinstitute.org
- https://www.construction.com
- https://www.constructconnect.com
- https://www.procore.com
- https://www.abc.org
Related on PULSE
This page will be disappearing soon. Save it to your device for $1 — or read it free while it is here.
@Kory-White- · if Venmo asks, the last 4 of my number are 2012
This page is gone.
This one is off the shelf now. $1 keeps it on your phone for good — the whole page, pictures and diagrams included.
 pulse-industry-kpisTop 10 Sales KPIs for Commercial Locksmith and Access Control in 2027
 pulse-industry-kpisTop 10 KPIs for Florists in 2027
 pulse-industry-kpisTop 10 Sales KPIs for AI Sales Coaching / Conversation Intelligence in 2027
 pulse-industry-kpisTop 10 Sales KPIs for Architectural Door & Hardware Distribution in 2027
 pulse-industry-kpisTop 10 Sales KPIs for Commercial Building Materials Distribution in 2027
 pulse-industry-kpisTop 10 Sales KPIs for Industrial Cybersecurity (OT/ICS) Services in 2027
 pulse-industry-kpisTop 10 KPIs for Roofing Contractors in 2027
 pulse-industry-kpisTop 10 Sales KPIs for Direct-to-Consumer (DTC) E-commerce Brand in 2027
 pulse-industry-kpisTop 10 KPIs for Junk Removal Companies in 2027
 pulse-industry-kpisTop 10 Sales KPIs for Industrial Laser Cutting & Waterjet Job Shops in 2027