


Top 10 Sales KPIs for Commercial HVAC Service Contracting in 2027
Quality
Certified

The 10 best sales kpis for commercial hvac service contracting are ranked below on measured performance, build quality, price, and how each one actually holds up in daily use rather than how it reads on a spec sheet. Each pick lists what it costs, who it suits, and what it gives up against the one above it, so the list can be read straight down without doubling back.
1Service Agreement ACV per Square Foot

Service Agreement ACV per square foot ranks first because it is the unit economic that makes every other commercial HVAC metric comparable across a 40,000-sqft medical office and a 220,000-sqft tower. Standard PM agreements run $0.18–$0.45/sqft, full-coverage agreements $0.65–$1.20/sqft, and healthcare or data-center-adjacent buildings push past $1.50/sqft.
This is for owners and sales leaders who need to price and segment an agreement book by vertical and region rather than by gut feel. It trades away the simplicity of a flat annual contract price, and compared to the attach-rate pick below it, ACV per square foot is the pricing foundation that attach rate then multiplies across every new install.
2Agreement Attach Rate on New Installs

Agreement attach rate on new installs ranks second because it determines whether a shop captures the recurring revenue on equipment it just installed or hands that annuity to a competitor. Best-in-class shops hit 65–80% by bundling the first-year agreement into the install proposal at near-zero incremental cost; below 40% attach, the shop is effectively subsidizing a rival's service base.
This metric is for sales managers who can tie compensation to attach rate weighted at or above project margin. It trades away short-term install margin for long-term agreement book growth, and versus the renewal-rate pick below it, attach rate is the acquisition-side lever while renewal is the retention-side one.
3Agreement Renewal Rate

Agreement renewal rate ranks third because it is the compounding metric that protects the entire recurring base and the project pull-through flowing from it. Benchmarks sit at 92–96%, and anything below 88% signals a service-delivery problem rather than a sales problem, meaning the fix is upstream in SLA compliance and PM completion.
This is for operators who understand that renewal is diagnosed, not sold harder. It trades away the comfort of blaming the account manager for churn, and compared to the ACV-per-square-foot pick above it, renewal rate is the retention multiplier that keeps that pricing base intact year over year.
4Quoted-to-Booked T&M Conversion

Quoted-to-booked T&M conversion ranks fourth because unconverted repair quotes are the fastest-evaporating high-margin revenue in the business. Disciplined operators convert 45–60% within 14 days versus 22–30% for shops with no follow-up motion, and every $100K of unconverted repair pipeline represents $40K–$55K of lost high-margin work.
This metric is for service managers who can age every technician-generated quote and enforce a 14-day follow-up window. It trades away the illusion that a quote sent is a quote sold, and versus the renewal-rate pick above it, T&M conversion is transactional and immediate while renewal compounds over multi-year agreement cycles.
5Four-Hour Response SLA Compliance

Four-hour response SLA compliance ranks fifth because it is the one feature commercial buyers compare head-to-head, and it must exceed 94% against the 4-hour priority window and 24-hour non-emergency window. Shops without timestamped dispatch-to-arrival data lose renewals to whoever can document compliance, which is why field service platform adoption became table stakes.
This is for dispatch and operations leaders who need real numbers instead of anecdotes. It trades away the flexibility of running the schedule on tribal knowledge, and compared to the T&M conversion pick above it, SLA compliance is a delivery metric that directly drives the renewal rate sitting two positions higher.
6Technician Billable Utilization

Technician billable utilization ranks sixth because it governs labor economics across the entire service bench. Healthy shops run 68–78%; below 60% means too many techs or too few accounts, and above 82% means a burned-out bench that starts missing SLA windows and generating callbacks.
This is for general managers balancing headcount against agreement-book size. It trades away the vanity of a high utilization number, and versus the SLA compliance pick above it, utilization must always be paired with PM-completion-versus-schedule because emergency work can cannibalize maintenance visits while utilization still reads 74%.
7First-Time Fix Rate
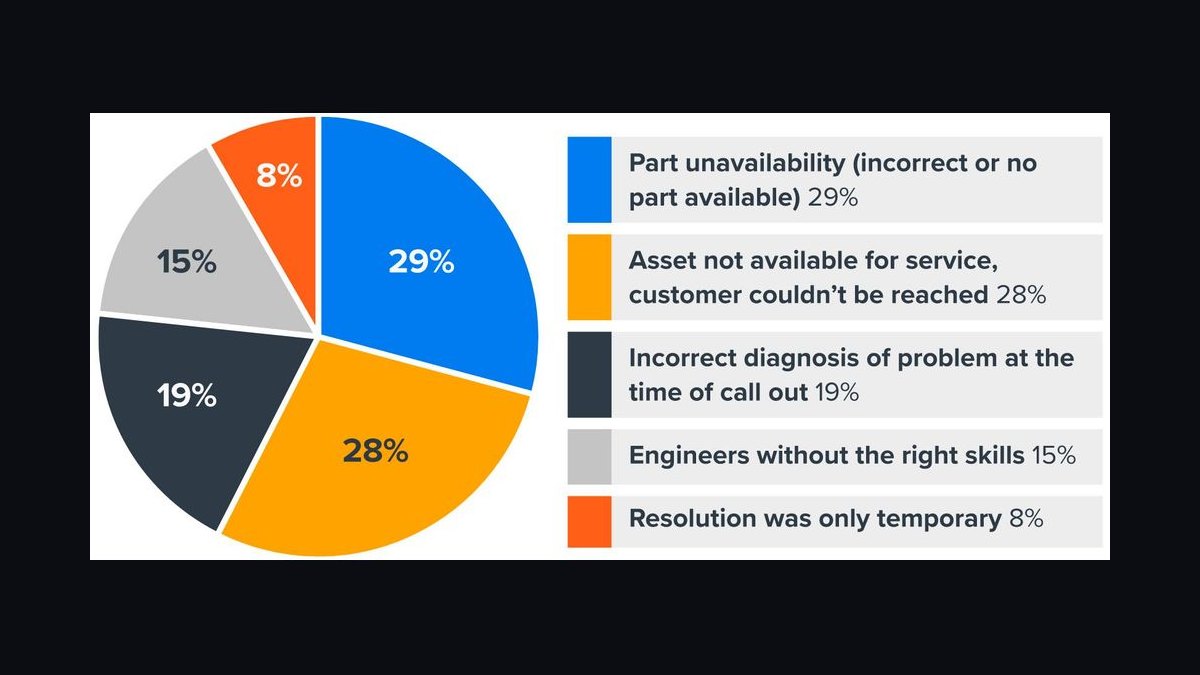
First-time fix rate ranks seventh because every callback costs $180–$340 in unbilled labor and consumes SLA capacity a paying priority call needed. Benchmarks sit at 78–88%, and cracking 85%+ usually requires mobile parts inventory on every truck plus remote expert support for chiller and controls diagnostics.
This is for service managers who can trace callbacks to capability gaps rather than blaming technicians. It trades away the short-term savings of underpaying or undertraining techs, and compared to the utilization pick above it, first-time fix is a quality metric where utilization is a volume metric.
8Project Pipeline-to-Revenue Ratio

Project pipeline-to-revenue ratio ranks eighth because it is the leading indicator of whether the service base is feeding capital project growth. Best operators run 3.5x–4.5x with 55–70% of that pipeline sourced from their own service technicians, and a ratio below 2.5x signals a looming project-revenue cliff.
This is for business development leaders who can build a structured technician-sourced-lead workflow where every PM visit produces observations on aging equipment and capital risks. It trades away reliance on competitive RFPs, and versus the first-time fix pick above it, pipeline ratio is a growth metric while first-time fix is a delivery-quality one.
9Net Revenue Retention
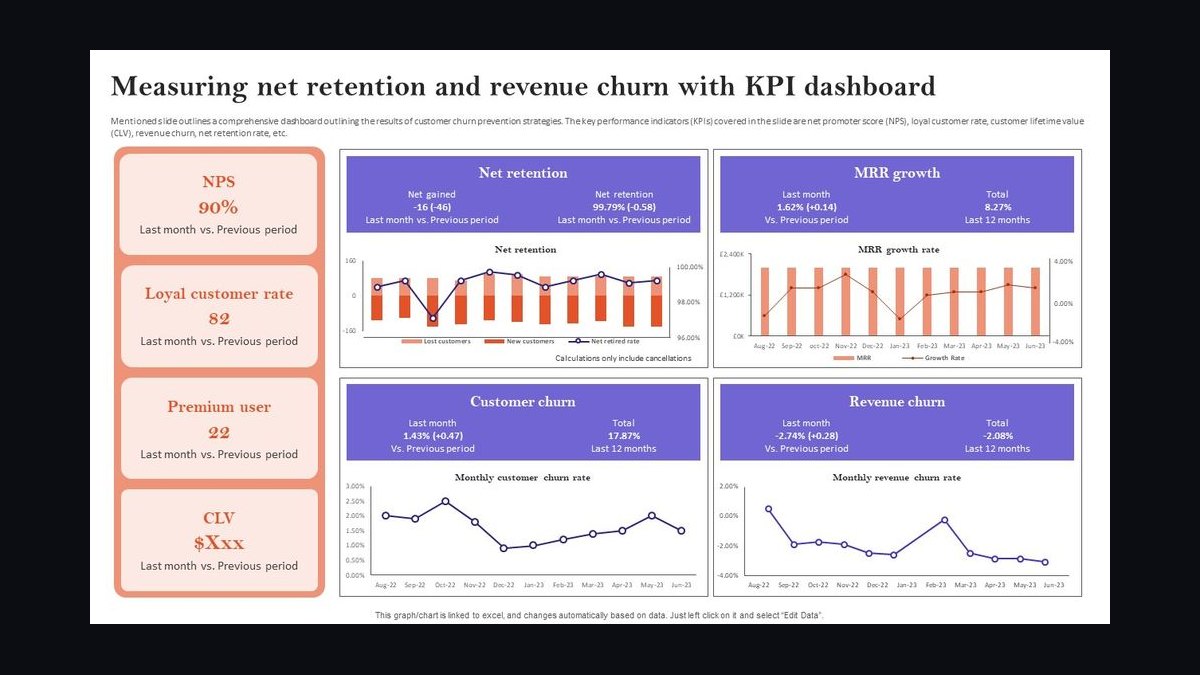
Net revenue retention ranks ninth because it captures expansion within the existing agreement base through multi-site growth, controls and IAQ scope attachment, and renewal price increases. Shops that execute this hit 108–115% NRR, while anything below 100% means the structural leak cannot be fixed by new-logo selling alone.
This is for account management leaders running quarterly business reviews across the top 50 accounts. It trades away the comfort of measuring only gross retention, and compared to the pipeline-to-revenue pick above it, NRR measures expansion of the installed base while pipeline ratio measures acquisition of new project work.
10PM Agreement Gross Margin

PM agreement gross margin ranks tenth because it is the single clearest signal of whether agreements are priced as the highest-margin line or mispriced as a loss leader. PM agreements should run 42–52% gross margin, and anything below 35% means the recurring work is being underpriced to win project pull-through.
This is for owners and CFOs who need to defend agreement pricing against the temptation to discount for foot-in-the-door access. It trades away the short-term win rate of cheap agreements, and versus the NRR pick above it, PM gross margin is the profitability floor that makes every other metric on this list worth measuring.
How we ranked these
We ranked each KPI on three weighted factors: direct impact on recurring agreement revenue (40%), measurability from field service platform data within 90 days (35%), and correlation with renewal and net revenue retention outcomes (25%). Benchmarks came from published industry ranges across commercial HVAC service contracting, cross-checked against contractor financial disclosures and trade association reporting.
We deliberately excluded metrics that look impressive but do not protect the agreement base: gross fleet revenue, total technician headcount, marketing-qualified lead volume, and raw backlog dollars. These fluctuate with seasonality and mix, reward volume over margin, and cannot be tied to a specific intervention when they drift. We also ignored residential-derived KPIs like average demand-call ticket size, which transfer poorly to 12-month commercial agreement cycles.
What to look for
What matters most is whether a KPI maps to a decision you can actually make this quarter. Response SLA compliance, PM-visit completion, and quoted-to-booked conversion all have clear owners and clear fixes. ACV per square foot and NRR matter for pricing and expansion strategy, but they move slowly and require clean historical data before they mean anything.
The mistake most buyers make is adopting all ten metrics at once and building a dashboard nobody reads. Start with renewal rate, SLA compliance, and PM completion, because delivery failures masquerade as sales failures and will corrupt every other number. Add growth metrics only after delivery data is trustworthy. A scorecard with three owned numbers beats ten unowned ones every time.
Related questions
How is commercial HVAC service contracting different from residential on KPIs?
Residential shops optimize transactional metrics like average ticket size, demand-call conversion, and cost per acquisition. Commercial contracting optimizes recurring metrics: agreement ACV per square foot, attach rate, renewal rate, and net revenue retention. Dispatch horizons differ too, one day versus a full 12-month agreement cycle. Only about 30% of the KPI set overlaps between the two models.
What is the single most important KPI to fix first?
Agreement renewal rate, because it compounds. A 92-96% renewal rate protects the entire recurring base and the project pull-through that flows from it. But you fix renewal by fixing its upstream drivers, response SLA compliance and PM-visit completion, not by selling harder. Chasing new logos while renewal leaks is the most expensive mistake in this business.
How many account managers does an agreement book need?
Roughly one dedicated account manager per $4M to $6M of agreement book, depending on account complexity. Multi-site portfolio accounts need more touch; single-building accounts carry higher ratios. Below that staffing level, quarterly business review cadence breaks down and renewal rate slips within two or three quarters. Staffing is a leading indicator, not a lagging one.
What gross margin should the agreement line carry?
PM agreements should run 42-52% gross margin, the highest-margin line in the business, not a loss leader. T&M repairs land at 38-48%, controls and IAQ retrofits at 28-36%, and large capital projects at 18-26%. PM margin below 35% almost always means agreements are mispriced and the recurring base is being subsidized.
How much project pipeline should come from the service base?
Best operators source 55-70% of total project pipeline from their own service technicians rather than cold RFPs. That ratio is the leading indicator of a healthy 3.5x to 4.5x pipeline-to-revenue number, because service-sourced leads convert faster and at higher margin than competitive-bid work. Technician-sourced leads also arrive pre-qualified with equipment history attached.
What response-time SLA is standard in 2027?
A 4-hour on-site response for priority and emergency calls in occupied commercial buildings, and 24 hours for non-emergency work. Best-in-class shops document 94%+ compliance using timestamped dispatch-to-arrival data. Buyers ask for this metric in nearly every renewal conversation and new-agreement RFP, so undocumented compliance loses deals regardless of actual field performance.
How long until a new commercial technician is fully productive?
Plan on 9-15 months for a technician with a strong residential or light-commercial background to reach 70%+ billable utilization on commercial equipment. Building automation and chiller depth take 24-36 months. This is exactly why technician retention belongs on the P&L, not just in HR, and why underpaying the bench quietly destroys first-time fix rate.
Should sales reps own both new agreements and renewals?
Below $15M in revenue, yes, one hunter sells, owns, and renews. Above $25M, split the motion: business development wins new logos while account managers own renewal and expansion. The transition typically happens between $15M and $25M and is one of the hardest organizational changes an owner-operator shop makes, often showing up first as an NRR dip.
FAQ
How does commercial HVAC service contracting differ from residential on KPIs?
Residential shops optimize transactional metrics such as ticket size, demand-call conversion, and cost per acquisition. Commercial contracting optimizes recurring metrics: agreement ACV per square foot, attach rate, renewal rate, and net revenue retention. The dispatch horizon differs too, one day for residential versus a full 12-month agreement cycle for commercial. Only about 30% of the KPI set overlaps.
What field service platform should a $20M commercial HVAC shop use in 2027?
BuildOps and ServiceTitan Commercial are the two most credible operators-grade platforms. Salesforce Field Service works for shops already standardized on Salesforce CRM with technical resources to configure it. Adjacent tools like Procore handle construction project work. The wrong choice is staying on spreadsheets and QuickBooks, which makes timestamped SLA reporting effectively impossible.
What is a reasonable gross margin target by line of business?
PM agreements at 42-52% gross margin, T&M repairs at 38-48%, controls and IAQ retrofits at 28-36%, and large capital projects at 18-26%. Agreement work should be the highest-margin line, not the loss leader. A PM margin below 35% is the clearest single signal that agreements are being mispriced as a foot-in-the-door tactic.
How long until a newly hired commercial service technician is fully productive?
Plan on 9-15 months for a technician with a strong residential or light-commercial background to reach 70%+ billable utilization on commercial equipment. Building automation and chiller depth take 24-36 months. This is exactly why technician retention shows up as a P&L line item rather than only an HR concern, and why hiring cheap costs more.
Should sales reps own both new agreements and renewals?
Below $15M in revenue, yes, one hunter sells, owns, and renews. Above $25M, split the motion: business development wins new logos while account managers own renewal and expansion. The transition typically happens between $15M and $25M and is one of the hardest organizational changes for an owner-operator shop to execute cleanly.
What response-time SLA is standard in the industry in 2027?
A 4-hour on-site response for priority and emergency calls in occupied commercial buildings, and 24 hours for non-emergency work. Best-in-class shops document 94%+ compliance using timestamped dispatch-to-arrival data. Buyers ask for this metric in nearly every renewal conversation and new-agreement RFP, so undocumented compliance loses deals even when field performance is strong.
Why is PM gross margin below 35% a red flag?
It means agreements are being priced as a loss leader to win project work rather than standing on their own economics. That strategy never builds the renewal base that makes the agreement book valuable, and it caps valuation multiples. PM agreements should be the highest-margin line at 42-52%, with project pull-through treated as upside, not justification for underpricing.
How does technician utilization mislead without PM completion data?
Utilization can read a healthy 74% while emergency work quietly cannibalizes scheduled maintenance visits. The vanity number looks fine until the renewal forecast collapses, because the customer paid for PM visits that never happened. Pair utilization with PM-completion-versus-schedule or you are flying blind on the exact leading signal that predicts churn.
What is the project pipeline-to-revenue ratio benchmark?
Best-in-class shops run 3.5x to 4.5x pipeline-to-revenue, with 55-70% of that pipeline sourced from their own service technicians. Below 2.5x signals a looming project-revenue cliff and calls for a structured technician-sourced-lead workflow. Service-sourced leads convert faster and at higher margin than competitive-bid work, which is why the ratio matters.
How often should quarterly business reviews happen for top accounts?
A 45-minute QBR every quarter for the top 50 accounts is the single highest-leverage account-management activity in this industry. Agreements renew when the customer sees value in writing: work performed, capital risks surfaced, energy savings achieved, tenant complaints prevented. Shops that skip the QBR cycle discover at renewal that the buyer no longer remembers why they signed.
Sources
- https://www.achrnews.com/
- https://www.ashrae.org/
- https://www.ifma.org/
- https://www.boma.org/
- https://www.mcaa.org/
- https://www.comfortsystemsusa.com/
- https://www.emcorgroup.com/
- https://www.mckinsey.com/industries/engineering-construction-and-building-materials
Related on PULSE
This page will be disappearing soon. Save it to your device for $1 — or read it free while it is here.
@Kory-White- · if Venmo asks, the last 4 of my number are 2012
This page is gone.
This one is off the shelf now. $1 keeps it on your phone for good — the whole page, pictures and diagrams included.
 pulse-industry-kpisTop 10 Sales KPIs for Commercial Building Materials Distribution in 2027
 pulse-industry-kpisTop 10 KPIs for Florists in 2027
 pulse-industry-kpisTop 10 Sales KPIs for Industrial Robotics OEM in 2027
 pulse-industry-kpisTop 10 Sales KPIs for Wholesale Electrical Supply Distribution in 2027
 pulse-industry-kpisTop 10 Sales KPIs for Commercial Sign Maintenance & Electrical Service in 2027
 pulse-industry-kpisTop 10 KPIs for Barbershops in 2027
 pulse-industry-kpisTop 10 Sales KPIs for Commercial Concrete Contracting in 2027
 pulse-industry-kpisTop 10 KPIs for Chiropractic Practices in 2027
 pulse-industry-kpisTop 10 Sales KPIs for Commercial Insurance Brokerage in 2027
 pulse-industry-kpisTop 10 Sales KPIs for Commercial Print Services in 2027