


Top 10 Sales KPIs for Industrial Boiler Service & Repair in 2027
Quality
Certified
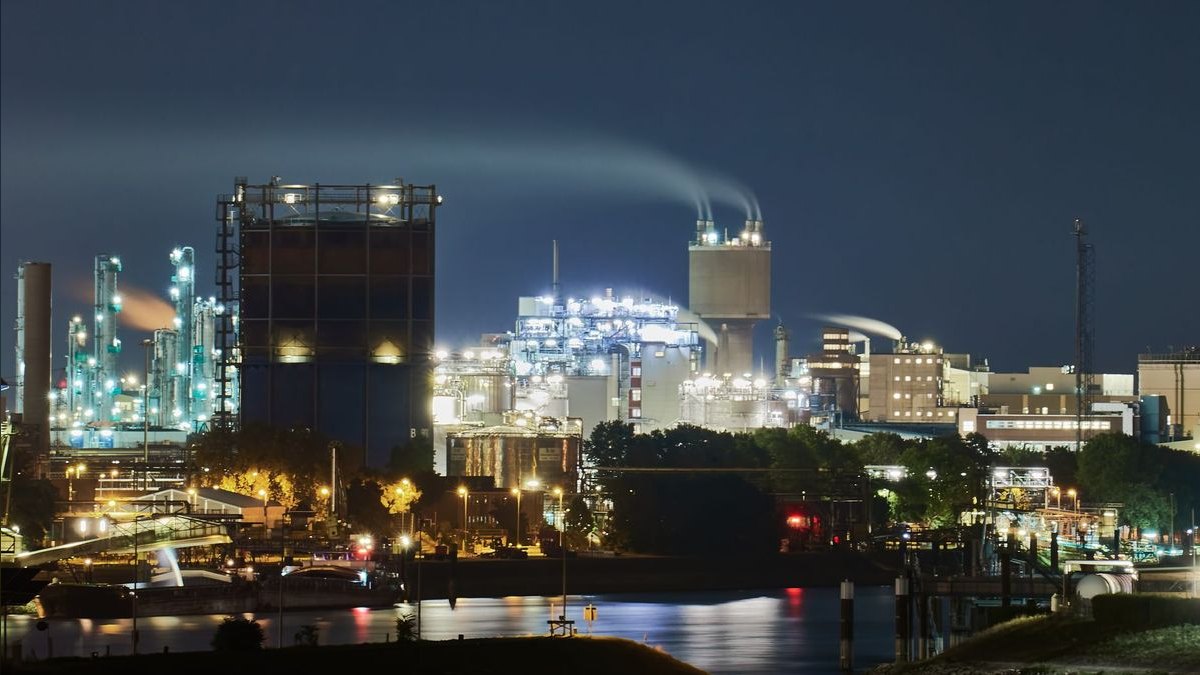
The key sales KPIs for the Industrial Boiler Service & Repair industry in 2027 are Service Contract ARR per boiler, first-time-fix rate, technician billable utilization, emergency response time, contract renewal rate, capital-project pull-through ratio, inspection-to-quote-to-job conversion, DSO on industrial receivables, and lifetime account revenue across the multi-decade asset lifecycle.
Why boiler service behaves like a regulated subscription, not a break-fix trade
From the outside, Industrial boiler work looks like commercial mechanical contracting, but the economics sit far closer to a regulated subscription book than to break-fix HVAC. The reason is code, not preference. The ASME Boiler and Pressure Vessel Code — Section I for power boilers, Section IV for heating boilers — together with National Board inspection rules obligate every commercial and industrial unit to be inspected by a commissioned inspector at least annually, and semi-annually for high-pressure water-tube designs. Only a limited set of ASME "S" Stamp authorized shops hold the legal right to perform pressure-retaining repairs, so the customer cannot lawfully operate the asset without a qualified provider on file with the state jurisdictional authority.
That regulatory floor pushes account retention into the low-to-mid 90s on mature multi-year master service agreements, well above the 70-80% typical in HVAC. The customer is not deciding whether to inspect — the law decides that — only who holds the contract. Because of this, the sales function is not chasing net-new logos every quarter; it defends an installed base, expands wallet share inside it, and converts mandatory inspections into follow-on work. Every KPI in this Service business exists to answer one of three questions: is the recurring inspection book compounding, are the technicians profitable enough to fund the next truck, and is the installed base feeding several dollars of service revenue for every dollar of new equipment sold years earlier. Any metric that does not map to one of those three questions is noise on this particular P&L, and treating this like a trades shop is the fastest way to misread the whole scoreboard. That framing is what makes the KPI set for this industry distinct from generic field-service dashboards.
The two KPI families: efficiency versus recurring revenue
The nine core KPIs split cleanly into two families that pull in opposite directions, and the entire discipline is keeping them in balance rather than optimizing one at the expense of the other.
The first family is operational-efficiency metrics — first-time-fix rate, technician billable utilization, and emergency response time. These govern whether the labor engine throws off cash. Loaded technician cost typically runs $95-$135 per hour against a $185-$245 commercial bill rate and a $245-$385 industrial-emergency rate, so a few points of utilization or first-time-fix is the difference between a healthy service gross margin and a bleeding one. Below roughly 70% billable, the fully loaded technician cannot cover the bill rate at all. Below a 78% first-time-fix rate, each callback consumes $1,200-$3,500 of unbilled labor and truck cost, and the margin line degrades inside a quarter.
The second family is recurring-revenue and lifetime-value metrics — Service Contract ARR per boiler, contract renewal rate, capital-project pull-through ratio, inspection-to-quote-to-job conversion, DSO on industrial receivables, and lifetime account revenue. These govern whether the book compounds. They move on a 90-day-to-multi-year clock rather than a daily dispatch clock, and they are exactly what a private-equity owner underwrites when buying a service roll-up in this industry.
The tension between the two families is real and constant. You can juice short-term utilization by cramming technicians onto emergency time-and-materials work, but if that starves the inspection-to-quote motion, the recurring book stops compounding and the lifetime-value metric quietly deflates. Conversely, chasing every retrofit quote while first-time-fix slides erodes the margin that funds the reinvestment cycle. The operators who win — direct-service networks, modular-fleet providers, and national-account programs alike — hold both families on the same weekly and monthly review and never trade one for the other. A useful discipline is to require that any decision improving a first-family metric be checked against its second-family cost, and vice versa, before it is approved.
Choosing which metric to lead with each cycle
Not every KPI belongs at the top of every review. The leading indicator on this Service business is inspection-to-quote-to-job conversion, because it is the only metric that predicts next quarter's recurring growth before it shows up in ARR. Of the National Board inspections you already perform under mandate, what share produce a follow-on repair or upgrade quote, and what share of those quotes convert to a booked job within 90 days? Strong energy-audit-style programs convert roughly 60-65% of inspections to quote and around 40% of quotes to job; solid distributor books run closer to the high-50s and high-30s; leaner commercial books sit near half on quote and a third on job. Below 30% quote conversion you are simply missing the economizer, condensing-retrofit, and controls-upgrade attach motion where the fastest paybacks live.
The decision logic for which lever to pull is mechanical: diagnose whether the binding constraint is capacity or demand, then read the matching metric first.
Because technician capacity, not customer demand, is the binding constraint across most of this industry — the median technician is in their mid-50s and workforce reporting has flagged a shortfall against installed-base demand in the high-20s percent — the default assumption should be that a shrinking book is a capacity problem until the efficiency metrics prove otherwise. Only when first-time-fix and utilization are both healthy do you conclude the recurring softness is a demand-side conversion miss and shift the sales team onto the attach motion. Leading with the wrong metric wastes a full review cycle: pushing reps to sell harder when the real problem is a technician who cannot get to the callback is how a branch burns a quarter chasing the wrong fix.
The benchmark bands behind each KPI
Every one of the nine KPIs has a defensible benchmark band, and knowing the band is what turns a raw number into a decision.
Service Contract ARR per boiler is recurring annual service-contract revenue divided by installed units under contract, segmented by size class. Commercial units under 50,000 lb/hr benchmark at roughly $5K-$12K per boiler; mid-industrial units at 50-150K lb/hr run about $18K-$28K; high-pressure water-tube boilers above that reach $35K-$45K. Below $5K you are selling break-fix dressed as a contract; above $45K you are bundling parts inventory or running a full operations-and-maintenance outsource, which is a different P&L to model.
First-time-fix rate is the share of calls resolved on the first truck roll with no return visit or parts back-order. Best-in-class direct-service and modular networks run 86-88%; the industry median sits around 78-82%; laggards under 75% bleed margin. The single largest lever is van stock — carrying the roughly 50-SKU controls-and-safety set (burner-management controls, standard low-water cutoffs, flame-safeguard relays) lifts most operators past 85% with no other change.
Technician billable utilization is billable hours over paid hours per certified technician per month. The band is 70-85%, with major operators anchoring 82% as the service-line floor. The discipline is decomposition: drive time, parts runs, code recertification, and warranty rework each destroy utilization differently, and only a real field-service platform attributes the loss correctly. Running this at branch level instead of per technician hides both the problem tech and the star.
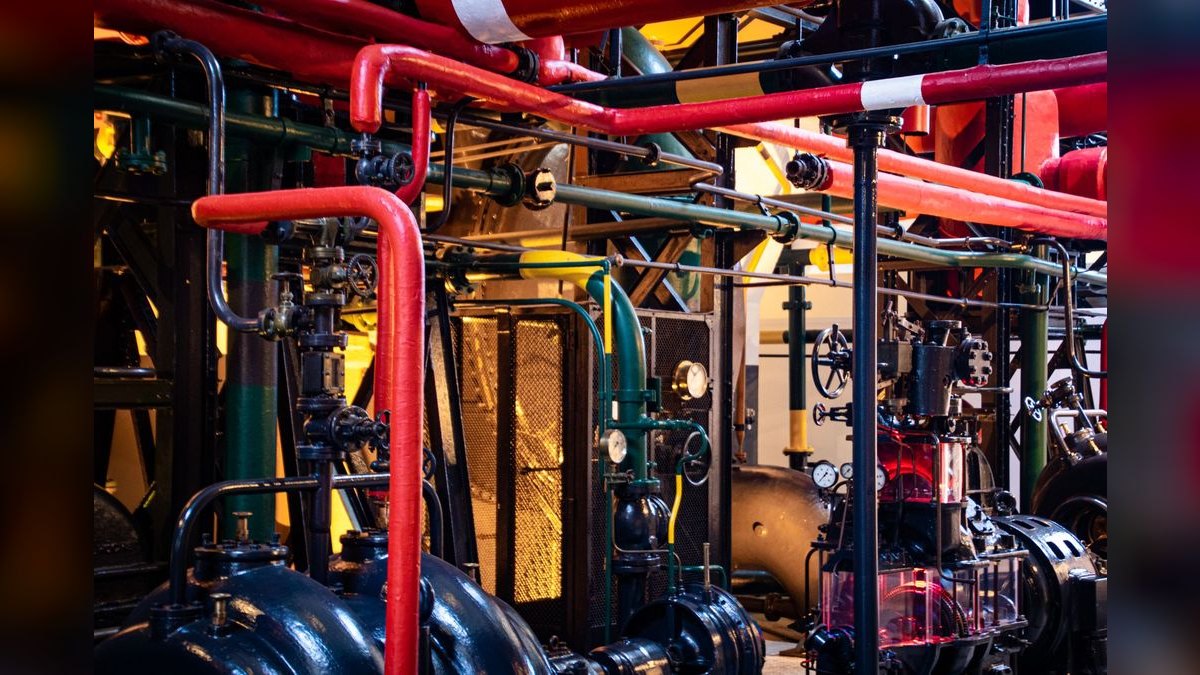
Emergency response time is hours from inbound emergency call to certified technician on-site, by contract tier. Commercial contracts guarantee 4-24 hours; critical-process industrial — pharmaceutical steam, refinery process steam, food sterilization — runs a 1-4 hour hard SLA often tied to liquidated damages. The best operators report a sub-2.5-hour median industrial response; the member median sits near 3 hours. Anything over 4 hours on a critical-process account is a renewal-risk flag for the next quarterly business review.
Contract renewal rate is the share of expiring master service agreements that renew on time by annualized contract value. Healthy is 88-94% renewal against low-to-mid 90s account retention, the gap being customers who renegotiate scope but stay. The strongest distributor and national-account programs cluster in the low 90s. Under 88% means you are losing on price, response, or technician-quality reputation — not on a customer choosing not to inspect, because they cannot.
Capital-project pull-through ratio is service-and-parts dollars per dollar of new equipment sold, on rolling 5-year and full-lifecycle windows. The 5-year benchmark is roughly $1.20-$2.10 per $1; the full-lifecycle figure runs $4-$12 per $1, driven by whether the customer also bought burner management, economizer, and water-treatment programs. Direct-service leaders land near the high single digits lifecycle; modular fleets run somewhat lower because smaller boilers carry higher inspection density per account; utility-scale work underperforms the ratio but on far larger absolute dollars.
DSO on industrial receivables typically runs 50-75 days against 30-day terms, because industrial accounts payable at chemical, refinery, and pharmaceutical sites is slow on time-and-materials invoices and requires purchase-order reconciliation before release. On a $40M service book, every 10 days of DSO improvement releases roughly $1.1M of working capital — material at a PE-owned roll-up.
Lifetime account revenue is cumulative gross revenue from a single Industrial customer across the multi-decade commercial and water-tube lifecycle, benchmarking at roughly $250K-$5M. It is driven by boiler count, steam-pressure class, and whether you captured the major retube ($50K-$500K), the controls upgrade ($45K-$180K), and the economizer retrofit ($25K-$95K). Specialty petrochemical retube books average toward the high end because retube cycles run tight on high-sulfur process steam.
Building the measurement cadence and sequencing the rollout

Instrumenting these KPIs is a sequencing problem, not a dashboard problem. The order matters because each stage depends on clean data from the one before it, and the cadence is layered: daily telemetry feeds a weekly ops review, which feeds a monthly GM review, which feeds a quarterly re-forecast.
Daily, run the emergency-dispatch board — open tickets against the SLA clock, technician location and utilization-to-date, and parts-availability flags by branch. Weekly, review first-time-fix by branch, billable utilization by technician, the inspection backlog owed in the next 30 days, and the quote-aging report on inspection-generated quotes. Monthly, review Service Contract ARR per boiler by size class, the 90-day renewal pipeline, capital-project pull-through year-to-date, DSO by customer segment, and gross margin split three ways across time-and-materials, contract, and project. Quarterly, re-forecast the service-versus-new-install mix, refresh lifetime account revenue on the top-50 accounts, roll the 5-year pull-through ratio, re-run the workforce capacity model against the flagged shortfall, and update the decarbonization-attach rate on the new-install pipeline.
The rollout itself sequences over 90 days.
The one non-negotiable in days 1-30 is instrumenting first-time-fix and utilization at the individual-technician level. Most operators run these at branch level and miss the variance that hides the actual problem tech or the actual star. Days 31-60 is about the funnel: the data usually already exists in the maintenance-management system, but without a CRM integration there is no funnel view, so mandatory inspections never become quote-opportunity records. Days 61-90 operationalizes the pull-through playbook by changing compensation — until the rep is paid on bundled recurring ARR rather than the equipment ticket, the service tail keeps leaking to competitors. This second diagram maps the same install-to-lifetime flow the KPIs measure, which is why the sequencing mirrors the metric families rather than the org chart.
Failure modes that quietly corrupt the numbers
Four failure modes recur across the industry, and each corrupts a specific metric. First, first-time-fix drift below 78%, almost always triggered by van-stock cuts during a working-capital squeeze; the fix is a forced van-stock rebuild and a parts-availability-by-technician KPI on the weekly review. Second, booking capital-project margin as recurring service revenue — a $50K-$500K retube run through the service cost center inflates service-line growth and hides flat inspection ARR; the correct decomposition keeps project, time-and-materials, and contract-recurring as three separate lines, and mixing them is how diligence finds a multi-million-dollar air pocket the year after a deal closes. Third, technician-capacity over-commitment on 1-hour critical-process SLAs signed without a dedicated on-call pool; the capacity math of technicians times shift coverage times geographic radius has to be done before signing, not after the liquidated-damages clause fires. Fourth, reporting consolidated service revenue instead of ARR per boiler, which lets a rising top line hide a shrinking installed base when pricing climbs faster than units leave — the only metric that catches it is ARR per boiler under contract, segmented by size, sitting above the gross-profit and EBITDA lines on the monthly review. Catching these early is mostly a matter of insisting the review deck shows the decomposed metric rather than the flattering aggregate.
Related questions

How many industrial boilers are actually under service contract in the US?
The US commercial-and-industrial installed base numbers in the low hundreds of thousands of boilers, and roughly 75-85% of new sales attach a service contract at signing. The un-attached 15-25% represent the tail competitors capture, which is why pull-through and attach-at-signing are the leading growth levers on this book.
Which single KPI predicts next year's revenue best?
Inspection-to-quote-to-job conversion. Because inspections are regulatory-mandated and already scheduled, the share you convert into follow-on quotes and then jobs within 90 days forecasts recurring growth a full quarter or two before it appears in ARR. Below 30% conversion signals a missed attach motion, not a demand problem.
Does decarbonization shrink the service book?
Not through 2030 on the industrial side. Steam-intensive process loads in pharma, food and beverage, and petrochemical are not electrifying their high-pressure process steam. Even electric and hydrogen-ready boilers carry pressure-side components under ASME code and require the same annual National Board inspection. The mix shifts; the mandate does not.
What technician utilization target is actually sustainable?
Around 78-82% billable is sustainable; 85% is a short-term peak-season ceiling, not a target. Above 85% you have squeezed out the training, code-recertification, and travel buffer, so the next emergency call breaks the schedule. Major operators anchor 82% as the floor that funds the reinvestment cycle without burning out the crew.
How much working capital does DSO improvement release?
On a $40M service book, every 10 days of DSO improvement releases roughly $1.1M of working capital. Most operators can pull 8-12 days out in the first year with a dedicated industrial-AR collector, purchase-order-reconciliation-linked e-invoicing, and on-site time-and-materials sign-off before the technician leaves.
FAQ
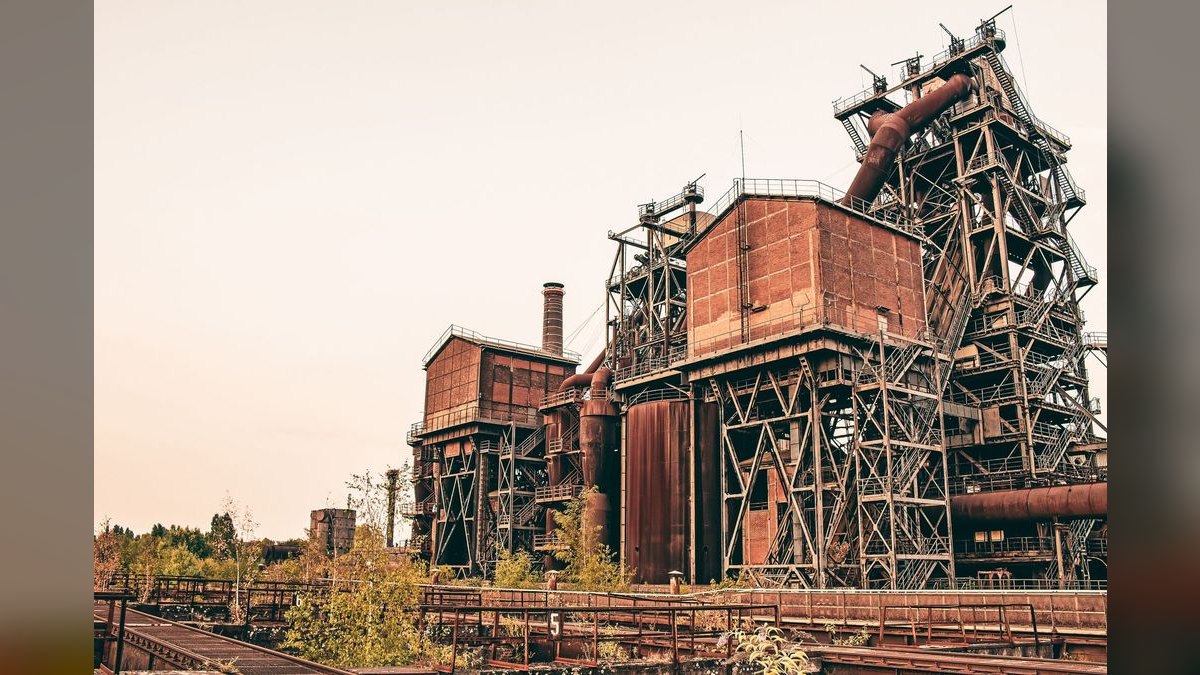
Why is account retention so high compared with other trades? Regulatory mandate. ASME code requires every commercial and Industrial Boiler to be inspected by a National Board-commissioned inspector annually, semi-annually for high-pressure units, and only a limited set of "S" Stamp shops can perform pressure-retaining repairs. The customer cannot legally operate without a qualified provider on file, so they choose who holds the contract, not whether to inspect. That floor does a large share of the retention math on its own.
How do I calculate capital-project pull-through correctly? Take every new boiler sold in a rolling window and sum all service, parts, time-and-materials, and project revenue from those specific installed assets over the same window — that is the 5-year ratio of roughly $1.20-$2.10 per $1. The lifecycle ratio of $4-$12 needs at least one full retube cycle in the data, so you model against an installed base, not a sales cohort. The common error is folding in revenue from customers who did not buy the equipment from you, inflating the ratio badly.
Is first-time-fix worth chasing above 85%? Yes, but the cost curve steepens. Moving 78% to 85% is mostly van stock and dispatch quality, paid back inside 90 days. Moving 85% to 88% requires senior-technician routing on complex calls, predictive parts-failure models, and a different scheduling system — a capital project, not a process tweak. Each point above 85% is worth roughly 60-90 basis points of service gross margin, so the ROI stays positive but the effort changes character.
What is the right emergency response SLA to sign? Tie the SLA to the account's process criticality and to your real capacity. Commercial units tolerate 4-24 hours; critical-process industrial demands 1-4 hours, often with liquidated damages. Never sign a 1-hour SLA without a dedicated on-call pool, because the first concurrent outage that forces a 6-hour response triggers the penalty clause and the account walks at renewal.
Which platforms do operators use to instrument these KPIs? Field-service dispatch and utilization typically run on a platform such as Salesforce Field Service, ServiceMax, or ServiceTitan; asset and inspection history lives in a maintenance-management system such as IBM Maximo, eMaint, Limble, or Fiix. The integration between the two — so each mandated inspection auto-creates a quote-opportunity record in the CRM — is what makes inspection-to-quote conversion a measurable metric rather than an anecdote.
How fast should DSO improve on an industrial book? Expect 50-75 days against 30-day terms as the norm. You can usually pull 8-12 days out in the first 12 months with a dedicated industrial-AR collector, purchase-order-reconciliation-linked electronic invoicing, and mandatory on-site sign-off before the technician leaves. Getting below 55 days generally requires factored receivables or bonded project work and is not always worth the cost.
Sources
- American Boiler Manufacturers Association (ABMA) — https://www.abma.com
- National Board of Boiler and Pressure Vessel Inspectors — https://www.nationalboard.org
- ASME Boiler and Pressure Vessel Code — https://www.asme.org
- U.S. Department of Energy, Industrial Efficiency and Decarbonization Office — https://www.energy.gov/eere/iedo
- Babcock & Wilcox Enterprises — https://www.babcock.com
- Spirax Sarco steam system resources — https://www.spiraxsarco.com
- McKinsey & Company industrial decarbonization research — https://www.mckinsey.com
- Wood Mackenzie North American power and industrial outlook — https://www.woodmac.com
- Salesforce Field Service — https://www.salesforce.com/products/field-service
Related on PULSE
- What are the key sales KPIs for the Industrial Cooling Tower Service & Repair industry in 2027?
- What are the key sales KPIs for the Commercial Kitchen Equipment Service & Repair industry in 2027?
- What are the key sales KPIs for the Industrial Gearbox & Drivetrain Repair Services industry in 2027?
- What are the key sales KPIs for the Industrial Heat Exchanger Manufacturing & Repair industry in 2027?
- The Best KPIs for Auto Repair Shops in 2027
- What are the key sales KPIs for the Mobile Truck & Trailer Refrigeration Repair industry in 2027?
This page will be disappearing soon. Save it to your device for $1 — or read it free while it is here.
@Kory-White- · if Venmo asks, the last 4 of my number are 2012
This page is gone.
This one is off the shelf now. $1 keeps it on your phone for good — the whole page, pictures and diagrams included.
 pulse-industry-kpisTop 10 KPIs for Barbershops in 2027
 pulse-industry-kpisTop 10 Sales KPIs for Commercial Solar Carport Construction in 2027
 pulse-industry-kpisTop 10 Sales KPIs for Industrial Tank & Silo Manufacturing in 2027
 pulse-industry-kpisTop 10 Sales KPIs for Fast Fashion Apparel in 2027
 pulse-industry-kpisTop 10 Sales KPIs for Commercial Industrial Coatings in 2027
 pulse-industry-kpisTop 10 Sales KPIs for Commercial Chiropractic Practice in 2027
 pulse-industry-kpisTop 10 Sales KPIs for Industrial Crane & Hoist Manufacturing in 2027
 pulse-industry-kpisTop 10 Sales KPIs for Medical Billing and Revenue Cycle Management in 2027
 pulse-industry-kpisTop 10 Sales KPIs for Industrial X-Ray & Non-Destructive Testing (NDT) Services in 2027
 pulse-industry-kpisTop 10 Sales KPIs for Architectural Terrazzo Flooring Installation in 2027