


Top 10 Sales KPIs for Mobile Fleet Car Wash & Detailing Services in 2027
Quality
Certified
The 10 best sales kpis for mobile fleet car wash & detailing services are ranked below on measured performance, build quality, price, and how each one actually holds up in daily use rather than how it reads on a spec sheet. Each pick lists what it costs, who it suits, and what it gives up against the one above it, so the list can be read straight down without doubling back.
1Mobile Fleet Wash Revenue per Crew-Hour
Revenue per crew-hour ranks first because it is the only metric that folds crew speed, route clustering, and pricing adequacy into one figure. Healthy operators land between $110 and $190 per paid crew-hour, computed against total paid hours including drive and setup time. The flattering version, calculated on wand-in-hand hours only, hides bad routes.
It is for owners running two or more crews who need one number to sanity-check pricing and routing decisions. It trades away simplicity, since it requires clean time capture and standardized contract data. Compared with revenue per crew per month directly below, it is more diagnostic but less useful for capacity planning.
2Mobile Fleet Wash Revenue per Crew per Month

Revenue per crew per month ranks second because it answers the single most expensive question in the business: whether to add another crew. Crews running $22,000 to $28,000 monthly have headroom to sell more density into existing routes. Crews consistently at the top of that range and turning down work justify expansion.
It suits operators weighing a van, equipment, water reclamation gear, two wages, and insurance against demand. It trades away diagnostic detail, since a strong month can mask a weak route. Compared with revenue per crew-hour above, it is a capacity decision tool rather than a pricing tool.
3Mobile Fleet Wash Route Density
Route density ranks third because geography is the cost of goods sold in a mobile operation. Target drive time under 20% of the paid day; at 35% drive time, billable capacity drops roughly 19% with no change in wages or vehicle payments. Dense metros hit this at four to seven accounts per service day.
It is for dispatchers and owners sequencing routes weeks ahead. It trades away stop-count simplicity, because stop counts flatter suburban routes and punish single-site days that are often the most profitable. Compared with contract revenue share below, it is more physical and less financial.
4Mobile Fleet Wash Contract Revenue Share
Contract revenue share ranks fourth because one-off jobs arrive at random points on the map and cannot be pre-sequenced. A book that is 75% contracted can be routed weeks out; a book at 40% is dispatched reactively, and reactive dispatch is where drive time balloons. Below 60%, lenders treat the business as project revenue.
It is for owners moving from residential detailing into fleet work who underestimate how much profit comes from routability rather than ticket size. It trades away upside from large one-off jobs. Compared with route density above, it is a leading cause rather than a measured outcome.
5Mobile Fleet Wash Contract Renewal Rate
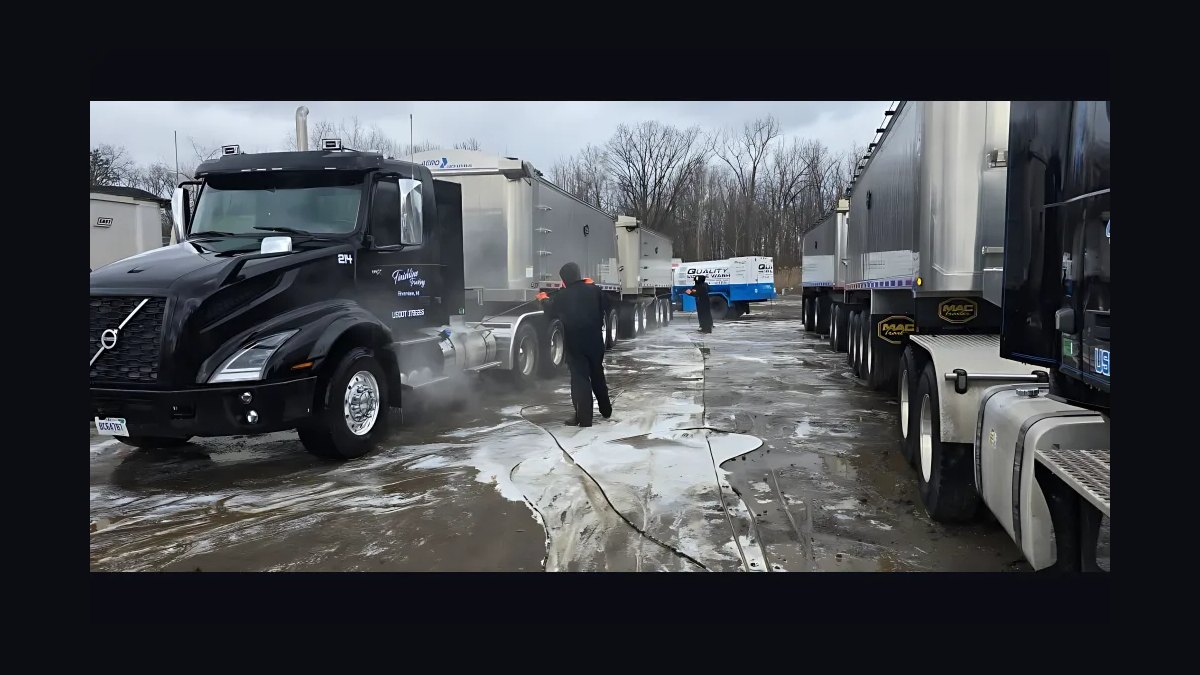
Contract renewal rate ranks fifth because losing one anchor account removes the geographic reason surrounding smaller accounts were profitable. Target 88% or higher; below 80%, investigate service consistency before price, since the complaint preceding cancellation is usually a missed visit. Declining service frequency precedes cancellation by months.
It is for operators with concentrated books where a single account exceeds 20% of a route's revenue. It trades away short-term growth focus, since retention work is invisible until it fails. Compared with contract revenue share above, it protects density rather than creating it.
6Mobile Fleet Wash Add-On Attach Rate

Add-on attach rate ranks sixth because the drive is already paid for when a crew stands in front of a truck. Selling interior detail, engine bay cleaning, or protectants adds revenue against near-zero incremental travel cost. Realistic rates cluster between 30% and 50% once tiered packages exist; below 30%, crews usually lack on-site quoting authority.
It is for operators whose crews can quote without a sales visit. It trades away base-wash simplicity, since tiered menus complicate proposals. Compared with average contract value below, it lifts revenue without adding trucks or accounts.
7Mobile Fleet Wash Average Contract Value

Average contract value ranks seventh because it segments the book into bands with completely different sales motions. Fleet accounts run $12,000 to $90,000 annually; the bottom is a contractor with six trucks on bi-weekly cadence, the top a rental operation with hundreds of units washed weekly. Segment by band before comparing.
It is for sales leaders setting quotas and cycle expectations. It trades away honesty when a single large win masks the loss of five small accounts, so pair it with account count. Compared with attach rate above, it reflects deal size rather than per-visit economics.
8Mobile Fleet Wash Vehicles per Crew per Day

Vehicles per crew per day ranks eighth because it is the raw throughput number every financial metric resolves back to. The range runs 35 to 70, almost entirely driven by service level: exterior-only maintenance washes on a tight dealership lot hit the top, while interior wipe-down, glass, and wheel work lands near 35. Full details belong in a weekly metric.
It is for crew supervisors managing daily output. It trades away meaning when averaged across mixed service levels, producing a number that describes no actual day. Compared with revenue per crew-hour above, it measures speed without pricing or routing context.
9Mobile Fleet Wash Customer Acquisition Cost

Customer acquisition cost ranks ninth because it only becomes meaningful against lifetime value. Keep loaded CAC under 10% of first-year contract value, roughly $2,000 on a $20,000 annual contract. Referral-sourced accounts come in far below that; cold enterprise pursuits blow through it and are still worth doing on five-year contracts.
It is for owners deciding how much to spend chasing enterprise fleets. It trades away simplicity, since loaded cost requires attributing sales time and marketing spend. Compared with renewal rate above, it governs growth economics rather than retention economics.
10Mobile Fleet Wash CLV to CAC Ratio
CLV to CAC ratio ranks tenth because it is the healthiest single signal in the dashboard and the one most operators never compute. Target four to one through six to one. A $30,000 annual contract surviving four years produces $120,000 of lifetime value; an $18,000 acquisition cost yields 6.7 to 1, but churn at two years drops it to roughly 3.3 to 1.
It is for operators making retention-versus-acquisition investment calls. It trades away immediacy, since it needs renewal data spanning multiple years. Compared with customer acquisition cost above, it captures relationship length rather than upfront spend.
How we ranked these
This ranking weighted nine operating metrics by their ability to predict fleet-wash profitability: vehicles per crew per day, route density (drive time share), contract revenue share, average contract value, renewal rate, revenue per crew-hour, CAC as a share of first-year value, add-on attach rate, and revenue per crew per month. Operational metrics were weighted heaviest because they are measurable from existing dispatch data and drive every downstream financial result.
Deliberately ignored: gross revenue totals, fleet size, social media following, and franchise-brand recognition. These flatter operators without revealing route-level economics, and a rising top line can mask subsidized accounts and collapsing density. Also excluded were one-off retail detailing tickets, since they cannot be routed predictably and distort crew-hour comparisons against contracted fleet work.
What to look for
What matters is whether the operator can show route-level unit economics, not a blended average. Ask for revenue per crew-hour computed against paid hours including drive and setup, plus drive-time percentage per route. An operator who tracks these can price honestly and will tell you when your site is off-route rather than quietly absorbing the cost.
The mistake most buyers make is choosing on per-vehicle price alone. A cheaper per-wash rate from a vendor whose route is thirty minutes away costs more in missed visits and inconsistent service than a higher-priced local operator. Ask about visit completion rate against schedule, crew turnover, and how they handle weather cancellations before comparing quotes.
Related questions
How often should fleet accounts be washed?
Most fleet contracts run weekly or bi-weekly. Delivery and rental fleets with brand-visibility requirements often go weekly, while contractor and utility fleets commonly sit at bi-weekly or monthly. Service frequency per vehicle is itself a leading retention indicator, since a fleet quietly reducing cadence is often preparing to leave.
What is the difference between fleet and retail detailing metrics?
Retail detailing is measured per ticket and per bay-hour, with high variance in job length. Fleet work is measured per crew-hour and per route because volume is contracted and predictable. Retail optimizes ticket size, while fleet optimizes density and renewal, so the two dashboards should never be blended.
Which metric predicts churn earliest?
Declining service frequency and rising missed-visit counts precede cancellation by months. Neither is a financial metric, which is why both get missed. Track visits completed against visits scheduled per account and flag any account running under 95% completion for a service review.
Does route density matter more than pricing?
Usually, yes. A 15-point improvement in drive-time percentage typically moves margin more than a 5% price increase, and it does not risk the account. Fix routing before repricing, then reprice only the accounts that remain structurally off-route after rescheduling.
How many crews before you need real reporting?
Two. At one crew the owner sees everything directly. At two, visibility splits and averages start hiding route-level problems. By three or four crews, aggregate numbers are actively misleading without per-route segmentation and a named owner for each metric.
What is a realistic revenue per crew-hour range?
Between $110 and $190 per paid crew-hour, computed against total paid hours including drive and setup rather than wand-in-hand time. The flattering version of this number, calculated on billable hours only, has fooled many operators into believing a badly routed day was profitable.
How long before a new metric dashboard is trustworthy?
Expect two full quarters. Data hygiene takes a quarter to settle, and the first numbers you produce will be wrong in ways you only discover by arguing with them. Operational metrics land first, sales funnel metrics second, retention and lifetime value last.
What is a healthy CLV to CAC ratio for fleet accounts?
Four to one up to six to one. A $30,000 annual contract surviving four years produces roughly $120,000 in lifetime value, so an $18,000 acquisition cost yields about 6.7 to 1. Anything under 3 to 1 signals tightening retention or abandoning that account profile.
FAQ
What is the most important sales KPI for a mobile fleet wash business?
There is no single most important metric, but revenue per crew-hour is the strongest composite signal. It folds together crew speed, route clustering, and pricing adequacy into one figure. A healthy range is $110 to $190 per crew-hour, computed against total paid hours including drive time.
How many vehicles should a crew wash per day to be profitable?
Typically 35 to 70, depending on whether the work is a basic exterior maintenance wash or includes interior and detail steps. The upper end requires tight routing, minimal drive time, and a site large enough to absorb the crew for hours rather than minutes.
What is a good contract renewal rate in this industry?
Eighty-eight percent or higher marks strong performance. Below 80%, investigate service consistency first, because missed or late visits drive more cancellations than price does. Renewal also protects route density, so a lost anchor account damages more than its own line item.
How much should a mobile fleet wash business spend to acquire a new customer?
Keep loaded CAC under 10% of first-year contract value, roughly $2,000 on a $20,000 annual contract. Judge it against lifetime value rather than first month, since a four-year relationship justifies far more acquisition spend than a single season would.
What does route density mean and why does it matter?
Route density is how many accounts a crew can serve in one day without excessive driving. Target drive time under 20% of the paid day. Every point of drive time removed converts directly into billable washing capacity without adding wages or vehicles.
How can a business increase its average contract value?
Sell tiered packages and add-ons such as interior detail, wheel and tire treatment, and protectants to vehicles the crew is already standing in front of. An attach rate above 40% lifts contract value meaningfully because the travel cost is already sunk, making add-on revenue unusually high margin.
What contract value range is typical for a fleet account?
Roughly $12,000 to $90,000 per fleet account per year. The bottom is a small contractor with six trucks on a bi-weekly cadence; the top is a rental or dealership operation with hundreds of units on a weekly schedule. Segment your book by band, because the sales motion differs completely at each end.
Why does contract revenue share matter so much?
One-off jobs arrive at random points on the map at random times, so they cannot be pre-sequenced efficiently. A book that is 75% contracted can be routed weeks ahead; a book that is 40% contracted is dispatched reactively, and reactive dispatch is where drive time balloons and margin disappears.
What is a realistic add-on attach rate?
Realistic attach rates cluster between 30% and 50% once tiered packages exist, with 40% or higher marking strong performance. Below 30%, the usual cause is that crews are not empowered to quote on site, so the upsell never reaches the fleet manager.
How does seasonality affect these metrics?
Weather-exposed markets swing roughly 15% to 30% between peak and trough months, so comparing March to November tells you about the calendar rather than the business. Use trailing-twelve-month figures for pricing and hiring decisions, and month-over-month only for operational alerts.
Sources
- https://www.carwash.org/
- https://www.bls.gov/ooh/installation-maintenance-and-repair/
- https://www.ibisworld.com/united-states/market-research-reports/car-wash-auto-detailing-industry/
- https://www.sba.gov/business-guide
- https://www.epa.gov/npdes
- https://www.nafa.org/
- https://www.statista.com/
- https://www.franchisebusinessreview.com/
Related on PULSE
This page will be disappearing soon. Save it to your device for $1 — or read it free while it is here.
@Kory-White- · if Venmo asks, the last 4 of my number are 2012
This page is gone.
This one is off the shelf now. $1 keeps it on your phone for good — the whole page, pictures and diagrams included.
 pulse-industry-kpisTop 10 Sales KPIs for Industrial Laser Cutting & Waterjet Job Shops in 2027
 pulse-industry-kpisTop 10 Sales KPIs for Commercial Insulation Contracting in 2027
 pulse-industry-kpisTop 10 Sales KPIs for Food Delivery Marketplace in 2027
 pulse-industry-kpisTop 10 Sales KPIs for Marine Sail & Rigging Loft Services in 2027
 pulse-industry-kpisTop 10 Sales KPIs for Commercial Greenhouse Produce Marketing & Brokerage in 2027
 pulse-industry-kpisTop 10 Sales KPIs for Enterprise Software License Agreement (ELA) Renewals in 2027
 pulse-industry-kpisTop 10 Sales KPIs for Industrial Crane & Hoist Manufacturing in 2027
 pulse-industry-kpisTop 10 Sales KPIs for Contract Research Organization (CRO) in 2027
 pulse-industry-kpisTop 10 Sales KPIs for Commercial Hardware Distribution in 2027
 pulse-industry-kpisTop 10 KPIs for Roofing Contractors in 2027