


Top 10 Sales KPIs for Construction Equipment Rental in 2027
Quality
Certified

The 10 best sales kpis for construction equipment rental are ranked below on measured performance, build quality, price, and how each one actually holds up in daily use rather than how it reads on a spec sheet. Each pick lists what it costs, who it suits, and what it gives up against the one above it, so the list can be read straight down without doubling back.
1Construction Equipment Rental Dollar Utilization

Dollar utilization ranks first because it is the only metric that fuses volume and price into one yield figure, and blended fleets commonly land in the mid-to-high thirties through low forties. A reading drifting under the mid thirties means the fleet is over-bought, under-priced, or both. Annualized rental revenue divided by average original equipment cost exposes rate-cutting that time utilization alone would hide.
It is for fleet committees and CFOs who must judge whether each dollar of steel earns its cost of capital. It trades away the comfort of a simple volume headline, since a yard full of moving machines can still post weak dollar utilization. Compared with time utilization directly below, it punishes both discounting and idle iron simultaneously, which is why it belongs at the center of the framework.
2Construction Equipment Rental Time Utilization

Time utilization ranks second because it is the fastest daily read on whether machines are actually moving, measured as days on rent divided by available days. General rental typically runs in the mid-to-high sixties through low seventies, while specialty categories run higher on longer customer commitments. Sustained readings below the low sixties usually mean the fleet is oversized for its market.
It is for branch managers and dispatchers who need a same-day signal on yard velocity. It trades away pricing truth, because a fleet can post strong time utilization simply by renting cheaply, which is exactly the distortion dollar utilization above corrects. Compared with dollar utilization, it is easier to game and easier to act on locally, so the two are always read together.
3Construction Equipment Rental Gross Rental Rates

Gross rental rates rank third because like-for-like year-over-year price change, isolated from mix, is the hardest of the nine metrics to compute honestly and the most damaging to get wrong. A shift toward higher-priced specialty categories makes blended rate look strong while underlying class pricing is soft. Compute rate change within class, then roll up with fixed weights.
It is for pricing leaders and regional sales directors defending margin renewal by renewal. It trades away simplicity, since honest rate tracking requires class-level discipline and monthly re-benchmarking against spot quotes and contract rates. Compared with dollar utilization above, it isolates price alone, so divergence between spot quotes and contract rates becomes an early warning that the national-account book is eroding.
4Construction Equipment Rental Ancillary Revenue

Ancillary revenue ranks fourth because delivery, damage waiver, fuel, and environmental charges typically sit at roughly a tenth to a sixth of rental revenue and carry the highest gross margin of any line in the business. Most of it is a pass-through with a markup or a risk-transfer product with low loss ratios. Attach rate by service and realization against posted schedules matter more than the total.
It is for branch operators and sales reps who can recover margin without capital or new customers. It trades away headline visibility, because branches quietly waive delivery fees to close deals and that leakage never appears in a revenue total. Compared with gross rental rates above, it is the faster margin recovery, requiring field discipline rather than a market repricing.
5Construction Equipment Rental Fleet Age
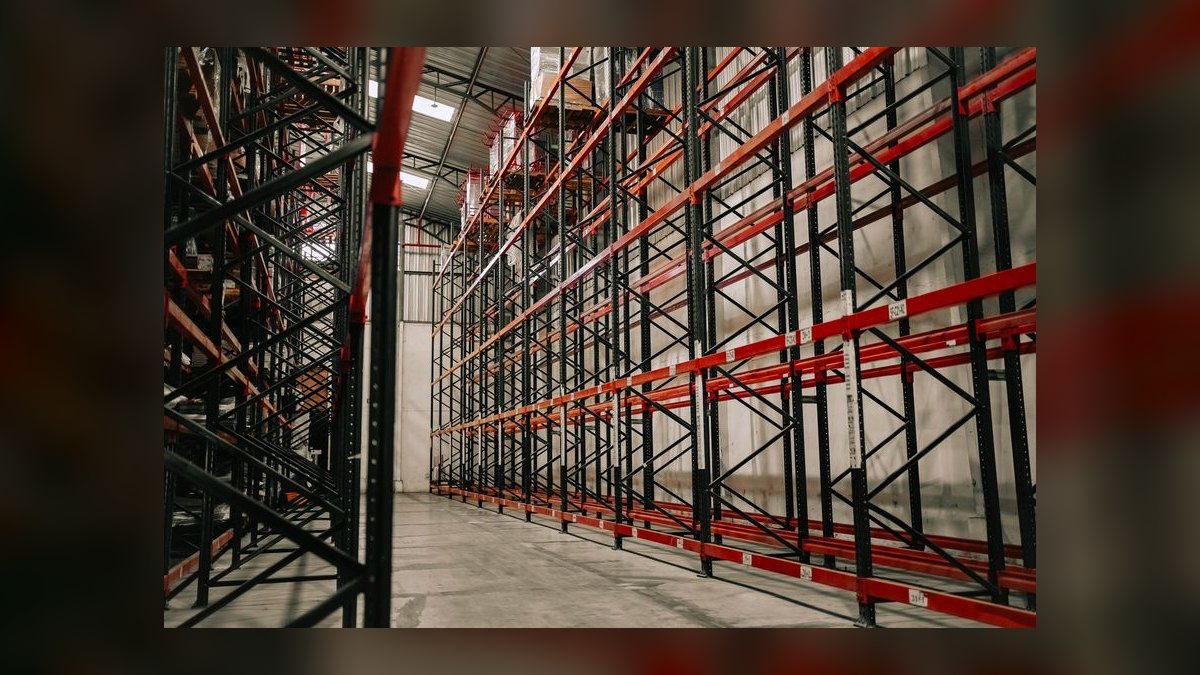
Fleet age ranks fifth because weighted average age of the active fleet, expressed in months, drives rate, maintenance cost, and residual value simultaneously. A band in the low forties to mid fifties of months is the common operating target. Age above roughly five years on a blended basis is a reliable signal of deferred investment.
It is for capital planners deciding when to rotate units into the used channel. It trades away near-term free cash flow, since a younger fleet consumes capital continuously while an older one converts to cash and then compounds against you. Compared with ancillary revenue above, it moves on a monthly clock rather than a daily one, and its damage shows up in maintenance and complaints before revenue.
6Construction Equipment Rental Specialty Mix

Specialty mix ranks sixth because specialty rental revenue divided by total rental revenue correlates strongly with margin, since engineered categories price on outcome rather than on iron. Power and climate control, trench safety and shoring, fluid solutions, and matting sustain longer terms and face less commodity competition. Moving the mix requires an engineering bench, not just inventory.
It is for operators willing to invest in technical application support over several years. It trades away speed, because specialty expansion without the staff to execute job-site outcomes converts a premium into a discount within two renewal cycles. Compared with fleet age above, it is slower to move but more durable, and it supports dollar utilization rather than merely reflecting it.
7Construction Equipment Rental National-Account Share

National-account share ranks seventh because revenue delivered under master agreements with large multi-site customers stabilizes the top line and fills fleet through soft patches. The large national platforms run this far higher than independents do. The trade is explicit: visibility, longer terms, and lower churn purchased with rate concessions and tighter service-level obligations.
It is for business-development leaders pursuing multi-site contractors and industrial owners. It trades away pricing power, since professional procurement organizations grind rate at every renewal. Compared with specialty mix above, it is faster to win but harder to defend; if national-account share climbs while gross rental rates fall and ancillary attach stays flat, the trade is going against you.
8Construction Equipment Rental OEC Fleet Size

OEC fleet size ranks eighth because it is the denominator for nearly everything else, so its integrity matters more than its level. Net fleet growth in the mid single digits per year is a steady-state posture; growth approaching double digits signals an aggressive expansion bet needing an explicit thesis. Reconcile OEC to the general ledger at least quarterly.
It is for finance and fleet operations teams who must keep the unit-level record aligned with the books. It trades away the flattering story that blended revenue reporting tells, because growth in the high single digits or better almost always means the OEC line moved too. Compared with national-account share above, it is a structural input rather than an outcome, and errors here corrupt every ratio built on it.
9Construction Equipment Rental Used-Equipment Residual Marks

Residual marks rank ninth because monthly used-equipment values feed directly into whole-life return calculations on every purchase decision, and stale assumptions approve purchases that cannot clear their cost of capital. The industry benchmarks residuals against third-party appraisal and auction datasets. Refresh marks monthly and re-run the approved-but-not-yet-delivered pipeline against the new numbers.
It is for fleet committees and capital allocators underwriting replacement and growth requests. It trades away the convenience of annual appraisal cycles, since long OEM lead times mean orders justified against old marks land in a different market. Compared with OEC fleet size above, it is a forward-looking input rather than a historical count, and it determines whether the capital-recycling loop validates its original underwriting.
10Construction Equipment Rental Rental Revenue

Rental revenue ranks tenth because it is the headline everyone reports first and the easiest to manufacture by writing purchase orders. It must be reported separately from used-equipment sales, ancillary services, and parts, since blending them flatters the story and destroys comparability. Growth in the low-to-mid single digits generally reflects rate and utilization improvement rather than fleet additions.
It is for executives and investors who need a top-line read but must pair it with the OEC denominator. It trades away diagnostic power, because a rental business can grow revenue at will simply by buying iron while yield quietly falls. Compared with residual marks above, it is a lagging outcome rather than a leading input, which is why it sits last in the framework.
How we ranked these
We ranked the nine core KPIs by how directly each one governs capital recycling in a rental fleet: rental revenue, OEC fleet size, time utilization, dollar utilization, fleet age, specialty mix, national-account share, gross rental rates, and ancillary revenue. Weighting favored metrics that fuse volume and price, penalize distortion, and tie to residual value or whole-life return rather than to headline growth.
We deliberately ignored revenue growth in isolation, branch counts, headcount, and total units on rent, because each can be expanded by writing purchase orders rather than by earning yield. We also excluded customer-satisfaction scores and safety incident rates, which matter operationally but do not discriminate between rental business models or predict capital efficiency across categories.
What to look for
Choose based on fleet category economics, not blended benchmarks. A boom-lift-heavy fleet and a power-and-climate fleet are not comparable on dollar utilization, so demand class-level reporting before trusting any vendor or platform that shows one blended number. Check whether the tool reconciles unit records to the general ledger, since every ratio depends on that integrity.
The mistake most buyers make is selecting a system that reports revenue and time utilization prominently while burying dollar utilization, rate realization, and residual marks. That configuration rewards fleet growth and punishes nothing. Insist on class-level rate change, ancillary attach and realization by branch, and monthly residual refresh before signing anything.
Related questions
What is dollar utilization and why does it matter more than time utilization?
Dollar utilization is annualized rental revenue divided by average original equipment cost. It fuses volume and price into one number, so it punishes both rate-cutting to fill the yard and hoarding units to defend price. Time utilization alone can be gamed either direction. Blended fleets commonly land in the mid-to-high thirties through low forties, with specialty categories running materially higher.
What is a healthy time utilization band for general construction equipment rental?
General rental typically runs in the mid-to-high sixties through low seventies. Sustained readings below the low sixties usually mean the fleet is oversized for the market. Sustained readings in the high seventies or above usually mean rates are too low and pricing headroom is being left on the table. Both are correctable, but they call for opposite actions.
How should fleet age be measured and what band is acceptable?
Use weighted average age of the active fleet expressed in months, not years. A band in the low forties to mid fifties of months is the common operating target. Younger fleets earn better rates and carry lower maintenance cost but demand heavy ongoing capital expenditure. Age above roughly five years blended reliably signals deferred investment.
Why is specialty mix correlated with higher rental margins?
Specialty categories such as power and climate, trench safety, pumps, and matting bundle technical application support rather than just a machine. They are priced on job-site outcome instead of on iron, which supports margin. Moving the mix is slow work because it requires an engineering bench, not just inventory. Specialty revenue divided by total rental revenue is the metric.
What is the trade-off in growing national-account revenue share?
National accounts deliver better visibility, longer terms, lower churn, and easier specialty cross-sell. Those benefits are purchased with rate concessions and tighter service-level obligations. If national-account share is climbing while gross rental rates fall and ancillary attach rates stay flat, the trade is going against you. Track spot quotes and contract rates separately to catch erosion early.
How do you compute gross rental rate change honestly?
Compute like-for-like price change within each equipment class, then roll up using fixed weights. A shift toward higher-priced specialty categories will make a blended rate look strong while underlying pricing on every individual class is soft. Track spot quotes and contract rates separately, because divergence between them is an early warning that the national-account book is eroding.
What ancillary revenue lines carry the best margin in equipment rental?
Delivery and pickup, rental protection or damage waiver, fuel and environmental charges, and related services typically sit at roughly a tenth to a sixth of rental revenue and carry the highest gross margin in the business. Most is either a pass-through with markup or a risk-transfer product with low loss ratios. Track attach rate by service and realization against posted schedules.
Why does residual value data belong in every capital approval?
Whole-life return math depends on what the machine sells for at disposal. If your fleet committee approves capital without a current residual assumption attached to each request, the return calculation is decorative. Refresh residual marks monthly and re-run the approved-but-not-yet-delivered pipeline, because long OEM lead times mean some orders were justified against stale numbers.
FAQ
What are the key sales KPIs for construction equipment rental in 2027?
Nine metrics form the core set: rental revenue, OEC fleet size, time utilization, dollar utilization, fleet age, specialty mix, national-account revenue share, gross rental rates, and ancillary revenue. Together they answer whether machines are on rent, whether each dollar of steel earns enough yield, and whether the fleet can win mega-project work. Never report revenue without the OEC denominator beside it.
Why can rental revenue grow while the business gets weaker?
A rental company can manufacture revenue growth at will by writing purchase orders. If revenue rises 7% while dollar utilization drifts from 39% to 34% and fleet age creeps from 44 to 57 months, the company bought fleet rather than making the fleet more productive. Revenue is up because capital deployed, not because yield improved. That is the most common misread in the industry.
What is the capital-recycling loop in equipment rental?
You spend original equipment cost up front, earn rental revenue against that cost across a service life measured in years, sell the asset into a secondary market for a fraction of what you paid, then redeploy recovered capital into the next vintage. Every operating metric exists to tell you whether that loop is running at a profit or quietly consuming cash.
What are the four gates of the rental capital loop?
Purchase, where OEC enters the fleet at a known number. Availability, where the machine sits in a yard accruing carrying cost whether or not anyone rents it. On-rent status, where time utilization and gross rental rates combine into revenue. Disposal, where the residual either validates or invalidates the original underwriting assumption. Each gate runs on a different clock.
Why is disposal a revenue decision rather than a disposal decision?
Most rental companies treat used-equipment sales as an afterthought handled by a separate team on a separate P&L line. Better operators run disposal as an active portfolio function: when the residual mark on a class is strong relative to forward yield, sell into strength and reinvest. When residual is weak, hold and sweat the asset. That reframing typically improves whole-life returns.
What happens when a rental company gets stuck in the weak-yield loop?
Weak yield defers fleet refresh, which raises maintenance cost and downtime, which lowers availability and forces rate concessions, which further weakens yield. Rental companies rarely die from a single bad quarter. They die from three years inside the wrong direction of that self-reinforcing loop. Strong yield runs the same mechanism in reverse, funding refresh and reliability.
How does the contractor customer's own calculus affect rental demand?
Contractors run an equipment-versus-rent decision based on their balance sheet and backlog. When contractor balance sheets are strong and project backlogs are long, ownership looks attractive and rental penetration softens. When capital is expensive and backlogs are lumpy, renting wins. Reading that neighbor is part of reading your own utilization and rate trajectory.
What is the biggest pitfall in reporting blended rental metrics?
A single blended dollar utilization figure for a fleet containing aerial platforms, earthmoving, compaction, power, and climate equipment is nearly meaningless because underlying economics differ widely. Report by class, roll up with weights, and disclose the mix. The same applies to fleet age, where a young aerial fleet paired with ancient light towers describes neither.
How should branch manager compensation be structured for rental KPIs?
If branch managers are compensated on units on rent, they will discount to fill the yard and resist disposals that shrink their count. Compensation has to reach at least partway toward dollar utilization and rate realization, or the incentive will fight the framework every week. Availability-based pay is the most common structural error in rental sales organizations.
What is ancillary leakage and how do you stop it?
Posted delivery, waiver, and fuel schedules mean nothing if the field waives them to close deals. Track realization against schedule by branch and by rep. This is usually the fastest margin recovery available in a rental business because it requires no capital and no new customers. Two sub-metrics matter: attach rate by service, and realization against posted schedules.
Sources
- https://www.ara-rental.org/
- https://www.equipmentworld.com/
- https://www.rermag.com/
- https://www.constructionequipment.com/
- https://www.irn-international.com/
- https://www.mckinsey.com/industries/capital-projects-and-infrastructure/our-insights
- https://www2.deloitte.com/us/en/pages/energy-and-resources/articles/power-and-utilities-industry-outlook.html
- https://www.bea.gov/data/industries/rental-and-leasing-services
Related on PULSE
This page will be disappearing soon. Save it to your device for $1 — or read it free while it is here.
@Kory-White- · if Venmo asks, the last 4 of my number are 2012
This page is gone.
This one is off the shelf now. $1 keeps it on your phone for good — the whole page, pictures and diagrams included.
 pulse-industry-kpisTop 10 KPIs for Florists in 2027
 pulse-industry-kpisTop 10 Sales KPIs for Commercial Industrial Coatings in 2027
 pulse-industry-kpisTop 10 Sales KPIs for Commercial Tree Care & Arboriculture in 2027
 pulse-industry-kpisTop 10 KPIs for Barbershops in 2027
 pulse-industry-kpisTop 10 KPIs for Chiropractic Practices in 2027
 pulse-industry-kpisTop 10 Sales KPIs for Commercial RV Dealership in 2027
 pulse-industry-kpisTop 10 Sales KPIs for Enterprise Software License Agreement (ELA) Renewals in 2027
 pulse-industry-kpisTop 10 Sales KPIs for Industrial Wastewater Treatment Equipment & Systems in 2027
 pulse-industry-kpisTop 10 Sales KPIs for Commercial Insurance Brokerage in 2027
 pulse-industry-kpisTop 10 Sales KPIs for Commercial Print Services in 2027