


Top 10 KPIs for Used Car Dealerships in 2027
Quality
Certified

The 10 best kpis for used car dealerships are ranked below on measured performance, build quality, price, and how each one actually holds up in daily use rather than how it reads on a spec sheet. Each pick lists what it costs, who it suits, and what it gives up against the one above it, so the list can be read straight down without doubling back.
1Total Gross per Unit

Total gross per unit ranks first because it is the single number that captures whether a dealership actually makes money on a car. It combines front-end gross with F&I gross, and best-in-class independents target $4,000-$4,800 combined PVR in 2027, while franchise used departments run $3,800-$4,400. A store can post strong front gross and still lose money if F&I attachment collapses, so the combined figure is the honest scorecard.
This KPI is for owner-operators and general managers who set compensation and pricing strategy, not for lot staff chasing unit counts. It trades away granularity: a healthy combined PVR can hide a weak front end offset by aggressive F&I product sales. Compared to front-end gross per unit directly below it, total gross is the more complete profit measure but harder to move quickly because it depends on both sales and finance departments performing.
2Front-End Gross per Unit

Front-end gross per unit ranks second because it is the purest measure of vehicle merchandising and negotiation skill, stripped of finance income. Independent retail dealers target $1,800-$2,400 per unit in 2027, while franchise used departments have compressed below $1,500 on many rooftops. Lithia Motors disclosed roughly $1,650 in used retail front gross in its most recent 10-Q, showing how thin the margin has become.
This metric is for used-car managers and buyers who control acquisition cost, recon spend, and pack. It trades away the finance picture entirely, so a store with strong front PVR but weak F&I will look healthier than it is. Compared to total gross per unit above it, front PVR is more actionable day-to-day but less complete, and it is the number that reveals whether the buying desk is acquiring inventory at the right price.
3F&I Gross per Unit

F&I gross per unit ranks third because finance and insurance income now rivals or exceeds front-end profit at many stores. Publicly traded groups generated $2,534 in F&I gross per retail unit in Q3 2025 per Haig Partners, and top-quartile independents clear $2,600. Group 1 Automotive reported F&I PVR above $2,600 in 2025 quarterly disclosures, setting the benchmark for used-only operators targeting $1,800-$2,400.
This KPI is for F&I managers and dealers who control product menus, lender relationships, and compliance. It trades away transparency: pushing chargeable products without clear disclosure inflates the number short-term and creates CFPB complaint risk. Compared to front-end gross per unit above it, F&I PVR is more controllable through training and menu design but more exposed to regulatory scrutiny, and BHPH stores structurally run lower at $400-$900 because products are bundled into the financed amount.
4Days in Inventory

Days in inventory ranks fourth because every day a unit sits on the lot costs $32-$55 in holding cost per NCM Associates and Rapid Recon benchmarks. CarMax runs a 31-day average age, Carvana sits at 43 days, and the independent retail target is under 45 days with zero units past 90 days. Cox Automotive and vAuto report national used-vehicle days supply oscillating between 37 and 49 days depending on quarter and price band.
This KPI is for buyers, sales managers, and owners who must decide when to wholesale a unit rather than let it rot. It trades away gross optimization: aged units sometimes carry higher asking prices, but the holding cost and stale-age discounts erase that advantage. Compared to inventory turn directly below it, days in inventory is the leading indicator while turn is the lagging annualized result, and the two must be read together to understand velocity.
5Inventory Turn

Inventory turn ranks fifth because it converts days-in-inventory into an annualized efficiency ratio that owners can benchmark against capital cost. Best-in-class independents run 10-12 turns per year, CarMax runs 9-10 turns, Carvana post-restructure runs roughly 7-8 turns, and NCM Associates pegs the strong-store target at 10 or more. Average independent dealers run only 6-8 turns, leaving significant capital tied up in slow-moving metal.
This KPI is for owners and general managers who manage floorplan lines and capital allocation across the store. It trades away unit-level detail: a store can hit 10 turns by dumping aged units at wholesale losses, which flatters the ratio while destroying gross. Compared to days in inventory above it, turn is the outcome measure that reflects the entire acquisition, recon, and sales process, and it is the number lenders and floorplan providers examine most closely.
6Reconditioning Cost per Unit

Reconditioning cost per unit ranks sixth because recon is the largest controllable variable between acquisition and sale. NIADA 20 Group reports BHPH recon averaging $1,100 per unit in 2022 and rising roughly $200 annually, putting 2027 BHPH recon at $1,300-$1,500, while franchise used recon runs $700-$1,100. Hendrick Automotive Group targets time-to-line of 3 days and recon cost under $900 per unit at its used-vehicle stores.
This KPI is for service managers, buyers, and recon vendors who control parts, labor, and sublet spend. It trades away speed: cutting recon cost by skipping needed work produces rough cars that damage reputation and generate comebacks.
7Lead-to-Close Conversion Rate
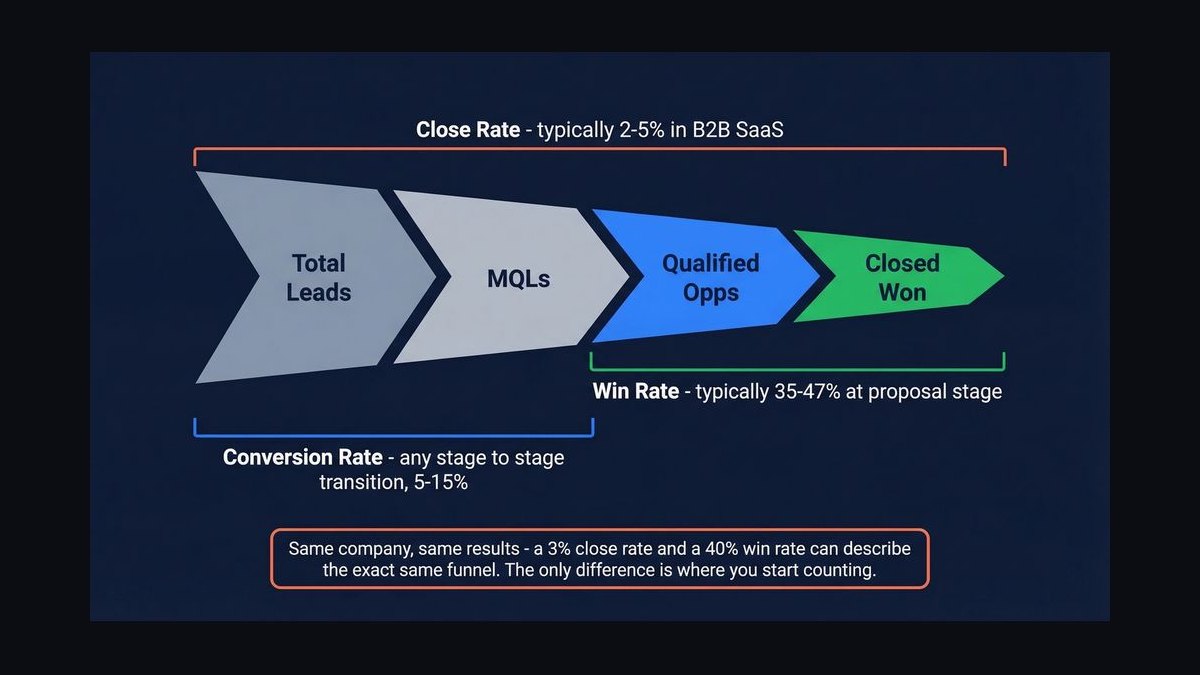
Lead-to-close conversion rate ranks seventh because digital leads are the dominant traffic source and most stores waste them through slow response. Cox Automotive and Demand Local report average lead-to-sale conversion of 8-12% with top performers at 15-20%, and Cars.com and AutoTrader leads typically close at 9-11%. Flai's 2026 speed-to-lead study found 15-minute responders close 50% more leads than slower competitors.
This KPI is for BDC managers, internet sales staff, and owners who control lead routing and follow-up cadence. It trades away lead volume: a store can hit 20% close rates on a tiny lead pool while missing total unit opportunity.
8Units Sold per Month

Units sold per month ranks eighth because it is the top-line volume measure that determines whether fixed costs are covered. NIADA data shows roughly 60,000 U.S. independent dealers sold about 12.75 million used vehicles in 2023, averaging 18 units per rooftop monthly, but a typical owner-operator targets 30-50, a strong independent runs 75-100, and top-quartile volume stores clear 150. CarMax averages roughly 2,400 units per store per year, about 200 monthly.
This KPI is for owners and sales managers who set staffing, floorplan, and marketing budgets against volume targets. It trades away profitability: chasing units through wholesale dump-outs counted as retail flatters the number while destroying gross. Compared to lead-to-close conversion above it, units sold is the output that conversion feeds into, and AutoNation USA's standalone used-only stores target 150-200 units monthly per rooftop in their 2027 expansion plan.
9BHPH Portfolio Net Charge-Off
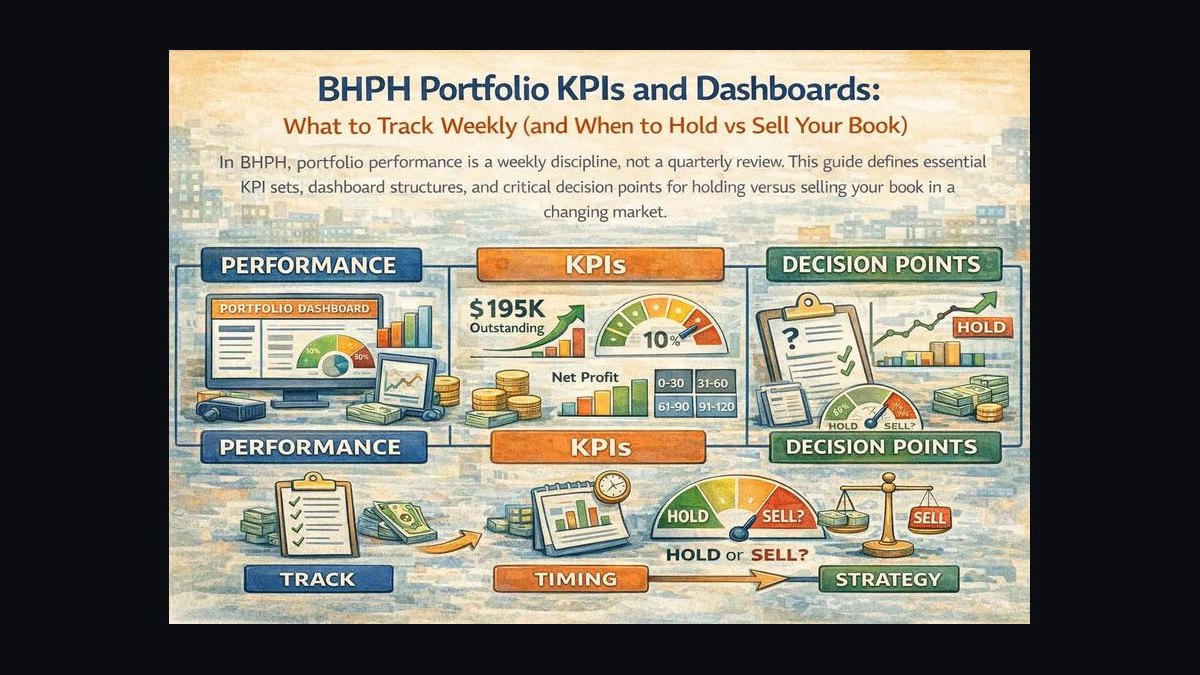
BHPH portfolio net charge-off ranks ninth because for buy-here-pay-here operators the dealership is a subprime finance company with a car lot attached. NABD benchmarks historically showed subprime BHPH net charge-offs at 30-33% pre-COVID, with a 2027 best-in-class target under 28% and median around 32-35%. America's Car-Mart disclosed net charge-offs near 27-28% of average finance receivables in recent fiscal years, well below the industry median.
This KPI is for BHPH owners and finance managers who set underwriting rules on down payment, term, and payment-to-income. It trades away unit volume: loosening origination standards to hit monthly goals balloons charge-offs 15-18 months later and can make a profitable store insolvent before the cash gap appears.
10Same-Store Sales Growth

Same-store sales growth ranks tenth because it isolates organic performance from new-store expansion and is the metric retail-only dealers use when they have no portfolio to track. Healthy retail same-store unit growth runs positive 3-6% in a good year, holding flat is acceptable in tight-supply years, and negative growth for two consecutive quarters is a red flag. It compares units and revenue against the prior period for stores open at least twelve months.
This KPI is for owners, GMs, and boards evaluating whether the operating model is actually improving or just adding rooftops. It trades away new-store contribution: a dealer opening profitable locations will show weak same-store growth while total revenue climbs.
How we ranked these
We ranked KPIs by weighting three factors: direct impact on dealership net profit (40%), measurability from standard DMS data (30%), and 2027 relevance given affordability pressure, tariff-driven supply shifts, and subprime credit tightening (30%). Each metric was scored against published benchmarks from NIADA, NCM Associates, Haig Partners, Cox Automotive, and public filings from CarMax, Carvana, and America's Car-Mart.
We deliberately ignored vanity metrics like website sessions, social followers, and raw lead volume because they don't correlate with funded deliveries. We also excluded new-car-specific metrics (factory holdback, MSRP-based gross) and macro indicators dealers can't control. BHPH portfolio metrics were weighted separately since those stores function as finance companies with a lot attached.
What to look for
The right KPI set depends on your business model. Retail-only independents should prioritize inventory turn, front PVR, and lead-to-close conversion. BHPH operators must add net charge-off and down-payment percentage, because a 2% charge-off drift can erase an entire year of front gross. Franchise used departments should weight F&I PVR and recon T2L more heavily than independents do.
The mistake most buyers make is chasing a single headline number, usually front gross per unit, while ignoring velocity. A $3,000 front-gross unit that sits 90 days loses money after holding cost, floorplan interest, and price cuts. The second mistake is copying CarMax or Carvana benchmarks without matching their scale, data infrastructure, or reconditioning throughput.
Related questions
What is a realistic days-to-sell target for an independent used car dealer in 2027?
Under 45 days average age is the working benchmark, with zero units over 90 days. CarMax runs near 31 days and Carvana near 43, but independents typically operate 37-49 days depending on price band. Anything past 60 days starts eroding front gross through holding cost and forced price cuts.
How do I calculate front-end gross per unit correctly?
Take selling price, subtract acquisition cost, recon spend, and pack, then divide by retail units delivered. Exclude wholesale dispositions entirely. Many dealers accidentally inflate the number by leaving pack out of cost of sale, which makes the store look healthier than it is and hides real per-unit losses.
Why does inventory turn matter more than front gross in 2027?
Because holding cost runs $32-55 per unit per day, and affordability pressure is compressing front gross across the board. A store turning inventory 10-12 times annually generates more total gross dollars than one holding out for higher per-unit margins. Velocity compounds; margin hoarding decays.
What F&I gross per unit should a used-only dealership target?
Independents should target $1,800-2,400 per retail unit, with top quartile reaching $2,600 or more. Public groups reported $2,534 in Q3 2025. BHPH stores run structurally lower at $400-900 because most products are bundled into the financed amount or cash-in.
How fast should a dealership respond to an internet lead?
Under 15 minutes, ideally under 5. Dealers responding within 15 minutes close roughly 50% more leads than slower responders, and leads contacted after 30 minutes convert at less than half the rate. Most stores average 45+ minutes, which is where 15-25 lost units per month hide.
What recon cost per unit is considered healthy for a used car operation?
Franchise used departments should target $700-1,100 per unit; independents and BHPH stores typically run $1,100-1,500. Time-to-line matters just as much: best-in-class is 3-5 days, while the industry average is 10-12 days, and every extra day carries holding cost.
What net charge-off rate should a BHPH dealer target in 2027?
Under 28% of average managed receivables is best-in-class, with the industry median around 32-35%. America's Car-Mart has disclosed 27-28% in recent fiscal years. Anything above 33% typically signals underwriting drift, weak down payments, or collection breakdowns.
How often should a dealership review its KPI dashboard?
Daily for aged-unit alerts, new leads, and open repair orders. Weekly for units sold, PVR by manager, T2L trend, and lead-source ROI. Monthly for full P&L, inventory turn, and BHPH portfolio summary. Quarterly for board review, vendor benchmarking, and compensation realignment.
FAQ
What is the single most important KPI for a used car dealership in 2027?
Total gross per unit, combining front-end and F&I, is the ultimate profit driver. Best-in-class dealers target $3,800-5,000 per retail unit, with BHPH operators running higher due to structural front-end margins. But total gross only matters when paired with inventory turn, since slow-moving units erode gross through holding cost.
How many used cars should a single rooftop sell monthly to be best-in-class?
A strong standalone dealership moves 75-150 units per month. The national average across roughly 60,000 independent rooftops is closer to 18 units, so most stores are far below capacity. Volume below 50 often signals weak market positioning or under-investment in lead generation and inventory sourcing.
What is a healthy days-in-inventory average for used cars in 2027?
Under 45 days is the efficiency benchmark. Cars sitting past 60 days start eroding front gross through price cuts and holding costs of $32-55 per day. Top dealers aim for 30-40 days, and CarMax runs near 31 days as the retail velocity reference point.
How much should a dealership spend on reconditioning per used car?
Best-in-class recon runs $1,100-1,400 per unit. Spending less often means selling rough cars that damage reputation and trigger comebacks. Exceeding $1,800 usually signals over-investment in vehicles that won't recoup the cost at sale, especially in the sub-$20K segment.
What is a good lead-to-close conversion rate for online used car leads?
Top performers convert 15-20% of web leads into delivered sales. Rates below 10% usually indicate slow response time, weak follow-up cadence, or pricing misaligned with market expectations. Cars.com and AutoTrader leads typically close at 9-11% across the industry.
Why do BHPH dealers need to track net charge-off separately?
Because BHPH profit depends on loan performance, not just vehicle gross. A net charge-off rate above 28% of average managed receivables can wipe out front-end gains entirely. BHPH operators watch this monthly to adjust underwriting, down-payment minimums, and collection strategy before losses compound.
Should wholesale units count toward retail KPI targets?
No. Wholesale dispositions should always be tracked on a separate line. Mixing them into retail units, front gross, or F&I PVR flatters the numbers and hides real performance problems. Most DMS platforms allow this by default, so accounting discipline is required to keep the two separate.
How does inventory turn differ from days-in-inventory?
They measure the same underlying velocity from opposite directions. Days-in-inventory is the average age of units on the lot today; inventory turn is annual retail units divided by average inventory. Best-in-class independents run 10-12 turns per year, which corresponds to roughly 30-36 days average age.
What is time-to-line and why does it matter for recon?
Time-to-line is the number of days from vehicle acquisition to retail-ready status. Best-in-class is 3-5 days; the industry average is 10-12 days. Every day past day five adds $32-55 in holding cost and roughly $50 in gross erosion, so T2L discipline directly protects front-end margin.
How should a dealership handle aged units past 60 days?
Wholesale them at 60 days without exception. Every additional day past 60 costs $32-55 in holding cost and erodes another 0.5-1% of gross. Dealers who hold aged units hoping for a retail buyer typically lose more than they would have by taking the auction hit early and redeploying capital.
Sources
- https://www.niada.com
- https://www.bhphinfo.com/industry-benchmarks
- https://www.nada.org
- https://www.haigpartners.com
- https://www.coxautoinc.com
- https://www.rapidrecon.com
- https://www.ncmassociates.com
- https://www.carmax.com
- https://investors.carvana.com
- https://www.car-mart.com
Related on PULSE
This page will be disappearing soon. Save it to your device for $1 — or read it free while it is here.
@Kory-White- · if Venmo asks, the last 4 of my number are 2012
This page is gone.
This one is off the shelf now. $1 keeps it on your phone for good — the whole page, pictures and diagrams included.
 pulse-industry-kpisTop 10 Sales KPIs for Industrial Heat Treating & Metal Finishing Services in 2027
 pulse-industry-kpisTop 10 Sales KPIs for Online Travel Agency (OTA) in 2027
 pulse-industry-kpisTop 10 Sales KPIs for Commercial Crane Rental in 2027
 pulse-industry-kpisTop 10 KPIs for Barbershops in 2027
 pulse-industry-kpisTop 10 KPIs for HVAC Contractors in 2027
 pulse-industry-kpisTop 10 Sales KPIs for Commercial Tree Care & Arboriculture in 2027
 pulse-industry-kpisTop 10 Sales KPIs for Commercial Sign Maintenance & Electrical Service in 2027
 pulse-industry-kpisTop 10 Sales KPIs for Commercial Glass and Glazing Contracting in 2027
 pulse-industry-kpisTop 10 Sales KPIs for Commercial Heavy Truck Dealership in 2027
 pulse-industry-kpisTop 10 Sales KPIs for Industrial Pump Distribution & Service in 2027