


Top 10 KPIs for Roofing Contractors in 2027
Quality
Certified

The best KPIs for roofing contractors in 2027 are average job size, insurance-versus-retail revenue mix, lead-to-close ratio, crew productivity in squares per day, supplement rate, financing attach percentage, and gross margin per job. Track each by source and per job — never blended — because top-line revenue alone hides whether the business actually survives.
The outcome you should expect
Instrumenting these KPIs correctly does not buy you "more dashboards." It buys the ability to predict cash flow, crew load, and margin *before* storm season closes, instead of discovering the damage in a year-end P&L. Two roofing companies can both post $4M in top-line revenue while one nets 16% and the other quietly loses money on a fifth of its jobs — and only per-job measurement tells them apart.
Concretely, top-quartile residential roofers in 2027 run a $13,500–$18,000 average retail job size, a 35–45% close rate on qualified inspections, 9–11 squares per crew per day, 22–28% financing attach, and 38–45% gross margin. The bottom quartile gets crushed — sub-$10,000 average job, blended close rates under 20%, single-digit financing attach, and margins that slip below 30% — largely because they measure the company in aggregate and never at the per-job level where the money actually leaks.

Roofing punishes generic KPI frameworks for structural reasons. Demand is weather-pulsed: a single hail event in Dallas–Fort Worth can compress two years of demand into nine months, so trailing-twelve-month revenue is a lying indicator without storm-mix context. Insurance pricing is dictated by carriers through Xactimate line items, not by your bid, so insurance margin is structurally lower than retail and the only real lever is the supplement. Production is bounded by crews and daylight, not by pipeline — a four-person crew physically cannot exceed roughly 10 squares a day on a standard tear-off-and-replace, so booking 200 jobs against three crews is a scheduling crisis dressed up as a sales win. When you expect these outcomes, every number below stops being a vanity figure and becomes a control lever you steer the business with.
What drives that outcome
The chain that produces net margin in roofing runs from lead source, through job type, through crew throughput. Each KPI sits at one link, and a weak link caps everything downstream. A great close rate on a channel that only produces $9,000 insurance jobs still yields thin margin. A huge average job size means nothing if crews cannot physically install the squares before the next storm chases demand to another state. The metrics are not independent scorecards — they are a sequence, and the earliest weak link sets the ceiling for all of them.
Walking the chain: lead volume splits by source, and the insurance-versus-retail fork immediately changes both close rate and job size. Insurance door-to-door canvass converts at 8–14% and lands $9,000–$12,500 jobs; referral and inbound retail convert at 45–70% and land $13,500–$18,000 jobs. On the insurance branch the supplement rate is the margin lever — top crews win an approved supplement on 70–85% of claims worth $2,400–$4,800 each. On the retail branch financing attach is the growth lever, because the average retail job now exceeds most households' liquid savings, so payment-first selling converts 18–24 points higher than cash-only. Both branches converge on gross margin per job, which is then throttled by crew productivity: revenue per crew-day is simply job value divided by how fast a crew can physically install it. Every node is a metric you can move, and moving the upstream ones compounds into net margin at the bottom.
Benchmarks and realistic ranges
These are the 2027 numbers to hold yourself against, KPI by KPI. Read each as a range with a segmentation rule, not a single company-wide average.
Average job size. Signed contract value (parts + labor + supplements) divided by jobs, segmented by type. Retail residential runs $13,500–$18,000, insurance residential $9,000–$12,500, and commercial flat roof $42,000–$190,000. Retail-focused operators bundling full systems and metal upgrades routinely push residential averages north of $24,000–$45,000. The failure mode is reporting one blended "$11,200 average" with no mix breakdown — that figure hides either a margin-crushing insurance dependency or a retail upsell process that never matured.
Insurance versus retail revenue mix. Carrier-paid claim revenue divided by total revenue. A healthy, sustainable mix is roughly 30–50% insurance / 50–70% retail. Above 70% insurance signals carrier dependency and margin compression; below 15% means you cannot capitalize on storm seasons at all. Running 90%+ insurance during a single storm year is how a business collapses the moment the hail moves on.
Lead-to-close ratio. Signed contracts divided by *qualified inspections* — not raw leads. Retail inbound closes at 45–60%, retail canvass at 18–25%, insurance door-to-door at 8–14%, and referral at 55–70%. Measuring against raw leads inflates the denominator with tire-kickers and disguises an otherwise strong qualification process as a broken sales team.
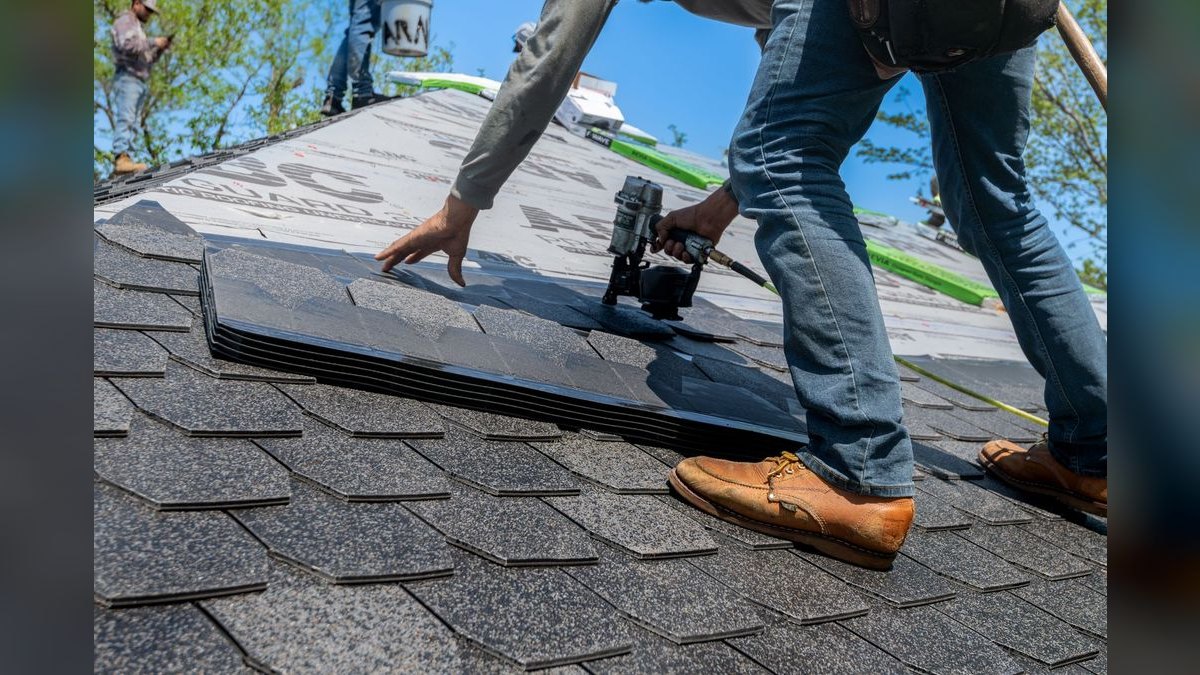
Crew productivity (squares per day). Squares installed divided by crews times working days. The industry labor standard is roughly 1.25 man-hours per square on a standard 6/12-pitch asphalt tear-off, translating to 8–10 squares per day for a four-person crew and 6–7 for a three-person crew. Under-trained crews run materially slower on tear-off, so training is a productivity input, not overhead.

Supplement rate. Share of insurance jobs with at least one approved supplement, times average supplement dollars. Top quartile hits 70–85% of jobs at $2,400–$4,800 each. Estimators not trained on code-upgrade line items — ice-and-water shield, drip edge, ridge venting, decking replacement — leave $1,800–$3,500 per job on the carrier's table.
Financing attach. Financed retail jobs divided by retail jobs. Top quartile is 22–28%, median 9–14%. The lift is real because the average retail job exceeds most households' savings; leading with monthly-payment math on every inspection is what separates the two tiers.
Gross margin per job. Revenue minus direct COGS (materials, labor, dump fees, equipment, subs), divided by revenue. Retail residential runs 38–45%, insurance residential 28–34% (compressed by Xactimate pricing), commercial 22–30%. A blended 40% gross margin is roughly the line between scaling and dying — but only when measured per job, because a healthy company average can hide the 15–20% of jobs that lose money outright.
Revenue and gross profit per crew-day. Total revenue divided by crew-days worked. Top-quartile residential is $11,000–$15,000 per crew-day, median $6,500–$8,500. Track gross *profit* per crew-day alongside it — high-revenue insurance days can be margin-negative once supplements and slow collections are modeled in.

Material waste. Ordered square footage minus installed, divided by ordered. Reasonable targets are 5% on 3-tab, 7–8% on architectural laminate, 3% on metal; best-in-class crews hit 3–4% using dimensional roof reports. A crew consistently wasting 9% on $4,200 of material bleeds about $380 per job invisibly — at 400 jobs a year that is roughly $152,000 of gross margin gone.
Risks, edge cases, and failure modes
The most dangerous failure is reporting a blended close rate. A 22% blended number could be 55% on referrals and 6% on storm canvass — two different businesses needing two different fixes. Averaging them hides which channel subsidizes the other and points every corrective action at the wrong problem.
Treating insurance jobs at retail margin assumptions is the second trap. If a contractor pencils 40% gross margin onto Xactimate-priced work without budgeting for supplements and slower payment cycles, every storm year ends in a cash crunch even though the top line looks healthy. Insurance revenue carries higher supplement potential but longer collection timelines — model it as its own line, never as discounted retail.
No financing attach measurement blinds you to the difference between a *price* objection and a *payment* objection. Those need different rebuttals: a price objection wants value framing, a payment objection wants monthly-payment math. Without tracking financing offered versus accepted, you cannot tell which one is quietly killing your retail close rate.

Crew productivity reported only at job-close is an edge case that silently wrecks schedules. A foreman who falls behind on day one and recovers by day three looks identical to a smooth crew in the post-job report. Only daily squares-installed reporting catches the slip while you can still reassign a crew or pull a job forward — after the fact, all you can do is narrate the overrun.
Ignoring material waste and not segmenting average job size by source round out the list. Door-knock storm leads and inbound referrals are not the same revenue, and blending their job sizes hides which channel is actually profitable to feed. A subtle edge case for growing contractors: chasing raw job count without watching squares-per-crew-day forces you to either subcontract at margin-zero or burn crew retention with 70-hour weeks — both surface as a churn problem months later, long after the KPI could have warned you. The through-line across every failure mode is identical — the number was measured too coarse, too late, or too blended to act on.
A practical rollout plan
Do not try to instrument all nine KPIs on day one. Sequence it over 90 days: instrument first, diagnose second, lift third. Instrumenting before you diagnose prevents the classic mistake of "fixing" a close-rate problem that is really a job-size or channel-mix problem — one of the most common and expensive missteps roofing operators make when they first get serious about metrics.

Days 1–30 — Instrument. Tag every lead in your CRM (JobNimbus, AccuLynx, or Roofr) with source plus an insurance/retail flag. Add a mandatory financing-offered toggle to every inspection. Begin daily squares-installed reporting from each foreman by SMS or app at end of day. The goal of this phase is clean data, not conclusions — resist the urge to react to noisy early numbers.
Days 31–60 — Diagnose. Run per-job gross margin reports and flag every job under 28% margin, then root-cause each (under-bid, missed supplement, crew overrun, material waste). Segment lead-to-close by source and identify the bottom two channels. Audit the last 50 insurance claims for missed supplement opportunities — this pass alone typically surfaces thousands per job in unclaimed line items.
Days 61–90 — Lift. Roll out monthly-payment-first sales scripts to raise financing attach. Set a foreman bonus tied to 9+ squares per day at under 6% waste so productivity and material discipline move together instead of against each other. Train estimators on Xactimate supplement notes and code-upgrade line items. Re-baseline all nine KPIs at day 90 and set next quarter's targets from the actuals, not from aspiration.
Cadence matters as much as the metrics themselves. Report daily on squares installed, jobs inspected, jobs sold, and leads received; weekly on lead-to-close by source, average job size by source, financing attach, and revenue per crew-day; monthly on insurance/retail mix, per-job gross margin with a bottom-quartile review, supplement rate, and material waste; and quarterly on rolling close rate by salesperson, financing approval rates, and foreman productivity ranking. A KPI reviewed on the wrong cadence is nearly as useless as one never tracked at all.
Related questions

How many KPIs should a small roofing contractor actually track?
Start with four: average job size by source, lead-to-close by source, gross margin per job, and squares per crew-day. These cover demand quality, sales effectiveness, profitability, and production capacity. Add supplement rate and financing attach once the first four are clean and reported on a reliable cadence.
Do the best KPIs differ for insurance-heavy versus retail roofers?
Yes. Insurance-heavy contractors live and die on supplement rate and claim-cycle time, since Xactimate sets the price. Retail contractors live on financing attach and average job size, since they set the price. Both still need per-job gross margin and crew productivity, which are universal.
What is a good net margin for a roofing contractor in 2027?
Well-run residential roofers land a 12–18% net margin after overhead, with top performers pushing the high end through disciplined supplementing, financing attach, and crew productivity. Net below 10% usually traces to blended reporting hiding a cluster of money-losing jobs, not to pricing.
Which KPI most often gets measured wrong?

Lead-to-close ratio. Contractors measure it against raw leads instead of qualified inspections, which stuffs the denominator with tire-kickers and makes a strong sales process look broken. Fix the definition first, then the number becomes trustworthy enough to coach against.
How does financing attach connect to average job size?
They reinforce each other. Higher financing attach lets homeowners say yes to larger scopes — metal upgrades, synthetic underlayment, full-system work — which raises average job size, which in turn makes financing more necessary. Contractors who lead with monthly-payment math tend to see both numbers climb together.
FAQ
What is the single most important KPI for a roofing contractor in 2027? There is no single magic number, but average job size and gross margin per job are the two that separate thriving contractors from those barely covering costs. Top-quartile roofers see $13,500–$18,000 per job at 38–45% gross margin; bottom-quartile operators often fall below $10,000 and 30%.
How does weather affect roofing KPIs? Weather directly drives lead volume and crew productivity, so it belongs in every forecast. A crew averaging 9–11 squares on a clear day can drop to 5–7 in rain or extreme heat, so tracking productivity over rolling 30-day windows gives a truer picture than a single week, and storm-mix context keeps revenue trends honest.
Why does the insurance versus retail revenue mix matter?

Insurance jobs carry higher supplement potential but slower payment cycles and carrier-set pricing, while retail jobs close faster with contractor-set, higher margins. A balanced mix protects cash flow; leaning too hard on either side risks a cash crunch when storms move or a stall when they do not.
What is a realistic lead-to-close ratio? Top-quartile residential roofers close 35–45% of qualified inspections; average performers see 20–30%. The ratio depends heavily on source — insurance claim leads and referrals close higher, cold retail canvass lower — which is exactly why the ratio must be segmented by channel rather than blended.
How can a contractor improve crew productivity? Reduce material waste toward the 3–6% range, standardize crew sizes and workflows, and use dimensional roof reports to pre-cut and pre-order accurately. Tracking squares per crew per day and tying a foreman bonus to a 9+ target with a waste ceiling can yield 10–20% productivity gains across a season.
What does financing attach percentage mean, and why does it matter? It is the share of retail jobs closed with consumer financing — typically 22–28% for top performers versus 9–14% at the median. Higher attach usually means larger average job sizes and fewer deals lost to upfront cost, making it one of the best leading indicators of revenue stability.
Sources
- https://www.nrca.net/
- https://www.jobnimbus.com/
- https://www.ibisworld.com/united-states/market-research-reports/roofing-contractors-industry/
- https://www.roofingcontractor.com/
- https://www.consumeraffairs.com/homeowners/roofing.html
- https://www.eagleview.com/
- https://www.hover.to/
- https://www.acculynx.com/
Related on PULSE
- What are the key sales KPIs for the Commercial Roofing Contracting industry in 2027?
- What are the key sales KPIs for the Commercial Spray Polyurethane Foam Roofing Contracting industry in 2027?
- What are the key sales KPIs for the Architectural Metal Roofing & Wall Panel Fabrication industry in 2027?
- The Best KPIs for General Contractors in 2027
- The Best KPIs for HVAC Contractors in 2027
- The Best KPIs for Electrical Contractors in 2027
This page will be disappearing soon. Save it to your device for $1 — or read it free while it is here.
@Kory-White- · if Venmo asks, the last 4 of my number are 2012
This page is gone.
This one is off the shelf now. $1 keeps it on your phone for good — the whole page, pictures and diagrams included.
 pulse-industry-kpisTop 10 Sales KPIs for Food Delivery Marketplace in 2027
 pulse-industry-kpisTop 10 Sales KPIs for Commercial Electrical Contracting in 2027
 pulse-industry-kpisTop 10 Sales KPIs for Commercial Medical Device Sales in 2027
 pulse-industry-kpisTop 10 Sales KPIs for Commercial Paving Contracting in 2027
 pulse-industry-kpisTop 10 Sales KPIs for Wholesale Electrical Supply Distribution in 2027
 pulse-industry-kpisTop 10 Sales KPIs for Commercial Marketing Agency in 2027
 pulse-industry-kpisTop 10 Sales KPIs for Medical Billing and Revenue Cycle Management in 2027
 pulse-industry-kpisTop 10 Sales KPIs for Specialty Lumber & Millwork Distribution in 2027
 pulse-industry-kpisTop 10 KPIs for Florists in 2027
 pulse-industry-kpisTop 10 Sales KPIs for Architectural Hardware Specification Consulting in 2027