


Top 10 KPIs for Landscaping Companies in 2027
Quality
Certified

The 10 best kpis for landscaping companies are ranked below on measured performance, build quality, price, and how each one actually holds up in daily use rather than how it reads on a spec sheet. Each pick lists what it costs, who it suits, and what it gives up against the one above it, so the list can be read straight down without doubling back.
1Recurring Maintenance Revenue Percentage

Recurring maintenance revenue percentage ranks first because it determines how much of next season's revenue is already contracted before spring, and it is the single metric buyers underwrite most heavily. Strong landscaping operators run 65–75% of trailing-twelve-month revenue from contracted, multi-visit agreements. Below 50%, lenders and acquirers value the business like a construction company rather than a route-based annuity.
The classification discipline matters more than the target. Spring cleanups and one-time mulch jobs repeat annually but are not contracted — the customer decides each March whether to buy, which makes them seasonal repeat rather than recurring. This KPI is for owners preparing for diligence or financing. It trades away nothing operationally, but it can be gamed by discounting mowing contracts to inflate the percentage while gross profit dollars stay flat.
2Revenue Per Labor Hour

Revenue per labor hour ranks second because labor is the product in landscaping, and this metric exposes whether paid hours actually convert to billable work. Divide net service revenue by paid productive field hours, including drive, load, and shop time. A $75–$95 range is a reasonable 2027 target for maintenance crews; below roughly $65 the math stops covering wages, burden, fuel, and fleet depreciation.
Compute it per crew, not just company-wide — the spread between your best and worst crew is usually the largest single improvement opportunity on the board. This KPI is for operators who suspect their estimating and payroll systems disagree on what an hour costs. It trades away the comfort of billed-hour reporting, which flatters results by roughly the amount of windshield time crews actually spend.
3Gross Margin By Service Line

Gross margin by service line ranks third because blended gross margin is the most common reporting failure in the green industry, hiding which division is actually profitable. Maintenance typically runs in the low-to-high fifties, install and design-build in the low-to-high twenties, irrigation service higher, tree care in between, and enhancements in the forties. A blended 31% can mean healthy maintenance quietly funding a losing install division.
This KPI is for owners who cannot answer what their install margin actually is. It requires splitting the chart of accounts by service category before the season starts, not at year end, which takes a bookkeeper a few days. Compared with revenue per labor hour above, it is the metric that tells you where to aim improvement effort rather than how efficiently you are running.
4Route Density

Route density ranks fourth because it is upstream of every labor metric and the only lever that improves revenue and cost simultaneously. Six to eight maintenance stops per crew per day is a solid residential and small-commercial target; four to six is roughly the profitability floor at 2027 labor costs. Average drive time between stops under ten minutes is where the economics get comfortable.
This KPI is for operators running multiple crews across a spread-out customer base. Recovering ninety minutes of windshield time per crew per day across eleven crews is roughly equivalent to adding a crew without adding a truck, trailer, insurance, or two W-2s. It trades away growth-at-any-cost, since the fastest density improvement is repricing or firing worst-located customers.
5Customer Retention At Season Open

Customer retention at season open ranks fifth because it determines how much of the route you keep, and it must be measured at renewal rather than mid-season. Mid-to-high eighties is common; low nineties is top-quartile; below 80% you are on a treadmill. The replacement cost of a maintenance customer — sales time, estimating, onboarding, first-visit inefficiency — takes more than a full season to repay.
This KPI is for owners who know they picked up new customers but not how many they replaced. A customer who let you mow all year and then did not renew is churn, regardless of how clean the visit-completion report looks. It pairs directly with recurring mix above: high retention with low recurring mix means loyal customers buying discretionary work, which is fragile in a soft year.
6Burdened Labor As Percentage Of Revenue

Burdened labor as a percentage of revenue ranks sixth because wages alone are a fiction — payroll taxes, workers' comp, general liability, and benefits stack on top, pushing the loaded multiplier meaningfully above 1.2. High thirties to mid forties is the working band for well-run shops. Above roughly 48%, nothing is left to fund equipment replacement, and the business begins financing itself by aging its fleet.
This KPI is for owners whose estimating template still prices at wage times 1.2. Workers' comp is the swing factor, varying widely by state and experience modification rate, which means safety program investment shows up in this number within two policy years. It sits underneath revenue per labor hour above — if your estimating system and payroll system disagree on hourly cost, every bid is quietly wrong.
7Days Sales Outstanding
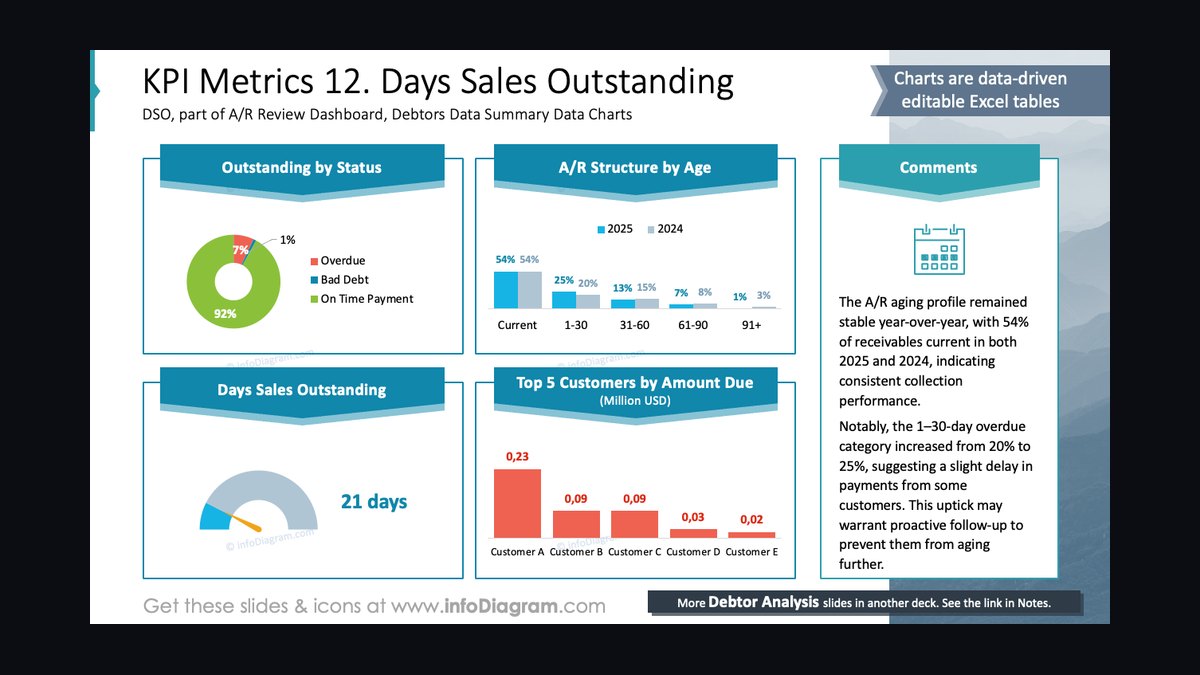
Days sales outstanding ranks seventh because it converts gross margin into actual cash, and residential, HOA, and commercial property management accounts behave very differently. Residential on auto-pay collects in a couple of weeks; national property-management accounts stretch longest. A blended target under about 35 days is reasonable for a mixed book.
This KPI is for owners whose operating account runs thin in February despite a profitable prior year. If a large commercial account pushes DSO past 55 days, that is a financing cost and belongs in the renewal price rather than the owner's line of credit. It supports the recurring mix metric above by revealing whether contracted revenue actually converts to cash on schedule.
8Equipment Utilization

Equipment utilization ranks eighth because it distinguishes producing assets from idle capex, and it is the strongest argument against buying another machine. Primary mowing assets should run above 90% of available hours in peak season; trucks somewhat lower. Specialty equipment like aerators and stump grinders legitimately runs at 40–60% because it earns by displacing rental cost, not by staying busy.
This KPI is for owners considering fleet expansion or replacement. Consistently low utilization on a primary asset usually signals a scheduling or routing problem rather than a capacity problem — buying a second skid-steer while the first sits at 45% is a scheduling problem wearing a capex costume. It trades away resilience if optimized too hard: high utilization with no spare capacity means one June breakdown cascades into missed stops.
9Seasonal Revenue Mix

Seasonal revenue mix ranks ninth because it determines whether winter payroll can carry retained crew leaders through February. Non-snow operators typically see the heaviest quarter around 30–32% of annual revenue and the lightest around 18–20%. Snow-belt operators with real plowing books invert the winter quarters, which smooths cash but adds liability and weather-dependent margin.
This KPI is for owners weighing winter service lines against seasonal layoffs. The visible winter payroll savings from laying off crew leaders in November hide the March cost of rehiring, retraining, and losing trained leaders to competitors. It trades away simplicity — snow smooths seasonal mix and retains leaders, but ties up trucks and carries meaningful liability exposure that some northern operators find close to break-even after equipment wear.
10Install To Maintenance Conversion Rate

Install to maintenance conversion rate ranks tenth because it decides whether the install division feeds the maintenance route or should be subbed out or exited. Most landscaping shops have never measured it, yet it determines whether weak install margin is worth fixing through estimating and crew productivity, or whether narrowing the install book makes more sense.
This KPI is for owners whose design-build division clears only the high teens in gross margin. If install is not feeding your maintenance route, subcontracting or exiting it is a legitimate answer — subbing lowers gross margin percentage on that work while removing labor, equipment, and risk from your books. It sits below gross margin by service line because that metric tells you install is weak, while this one tells you whether to fix it or leave it.
How we ranked these
We ranked KPIs by weighting three factors: (1) predictive power for next year's cash flow, based on diligence models used in route-based service acquisitions; (2) actionability, meaning a landscaper can move the number within one season; (3) data availability from common platforms like LMN, Aspire, or Service Autopilot. Recurring maintenance revenue percentage, revenue per labor hour, and service-line gross margin earned the heaviest weights. Retention and route density followed closely. Equipment utilization and DSO received moderate weights.
We deliberately ignored metrics that look impressive but do not predict cash: total revenue growth, customer count, visit completion rate, and blended gross margin. We excluded social media engagement, website traffic, and generic small-business benchmarks because landscaping labor is the product and maintenance customers are multi-year annuities. We also excluded any metric that cannot be computed from existing payroll and field service data without new software.
Finally, we ignored vanity operational numbers that can be gamed without raising gross profit dollars.
What to look for
When choosing between KPI systems or dashboards, prioritize whether the tool can classify revenue by service line and reconcile paid hours against billed hours. Most landscaping software already stores this data, but generic dashboards built for transactional businesses will average maintenance and install margin into one useless number. Demand a demo using your own chart of accounts and your own payroll exports, not sample data.
The mistake most buyers make is purchasing automation before fixing data classification. A beautiful dashboard fed by unclassified revenue and unreconciled hours reports beautiful nonsense. Spend the first month computing six numbers on paper. Only then evaluate software. Also avoid tools that benchmark you against consolidated public operators with different service mixes. Your best benchmark is your own trailing twelve months, segmented by service line.
Related questions
What is a good recurring maintenance revenue percentage for a landscaping company?
Strong operators run roughly 65–75% contracted maintenance revenue as a share of trailing-twelve-month total. Below 50%, lenders and acquirers treat the business as a construction company, which earns a lower valuation multiple. The key discipline is classification: contracted means the customer signed an agreement, not that the work happens to repeat annually.
How do I calculate revenue per labor hour correctly?
Divide net service revenue by paid productive field hours, not billed hours. Billed hours flatter the number by excluding drive time, loading, fueling, and equipment swaps. A reasonable 2027 target is $75–$95 for maintenance crews. Below $65, the math cannot cover wages, burden, fuel, and fleet replacement simultaneously. Compute it per crew, not just company-wide.
Why should gross margin be split by service line?
Maintenance, install, irrigation, tree care, and snow have structurally different cost stacks. Maintenance is labor-heavy and material-light, carrying the highest margin. Install is material- and sub-heavy, with margin set at bid time. Blending them averages one number you can fix with one you cannot, producing a figure that tells you nothing useful about where profit actually comes from.
What is route density and why does it matter most?
Route density is billable stops per crew per productive day, weighted by service type. It sits upstream of every labor metric because it determines how much paid time converts to billable time. Recovering ninety minutes of daily windshield time across eleven crews equals adding a crew without adding a truck, trailer, or insurance. That is why density is the highest-leverage operational number.
How should retention be measured for landscaping customers?
Measure renewal at season open against the eligible prior-year base, not mid-season visit completion. Mid-to-high eighties is common; low nineties is top-quartile. Below 80% you are on a treadmill replacing churned customers. A customer who let you mow all year and did not renew counts as churn, regardless of how clean field service reports look.
What percentage of revenue should burdened labor cost represent?
High thirties to mid forties is the working band for well-run shops. Above roughly 48%, there is nothing left to fund equipment replacement, and the business begins financing itself by aging its fleet. Workers' compensation is the swing factor, varying widely by state and experience modification rate. Safety program investment shows up in this KPI within two policy years.
Which KPI should I fix first if I can only fix one?
Fix gross margin by service line first, because it reveals where profit actually comes from and prevents maintenance profit from silently subsidizing an unprofitable install division. Once margin is visible by line, revenue per labor hour becomes actionable. Rebuilding the chart of accounts takes a bookkeeper a few days and permanently changes what you charge for install work.
Do these KPIs work for a two-crew landscaping operation?
Yes, and they matter more. A small shop feels a single off-route customer or one underpriced install immediately in cash. Track them on a spreadsheet because the arithmetic is identical to enterprise software. The smaller the business, the faster a density fix or a pricing correction shows up in the operating account.
FAQ
How often should a landscaping owner review these KPIs?
Daily for stops completed and labor hours versus estimate, owned by foremen. Weekly for revenue per labor hour by crew, density, and AR over 30. Monthly for service-line margin, DSO, and utilization. Quarterly for recurring mix, retention, and pricing review. The cadence matters as much as the metric because landscaping decisions happen weekly during peak season.
What is a good days sales outstanding target for a landscaper?
A blended target under about 35 days is reasonable for a mixed residential and commercial book. Residential on auto-pay collects in a couple of weeks. HOA and commercial property management stretch longer. If a large commercial account pushes DSO past 55 days, that financing cost belongs in the renewal price, not your line of credit.
How many maintenance stops per crew per day is profitable?
Six to eight stops per crew per day is solid for residential and small-commercial routes. Four to six is roughly the profitability floor at 2027 labor costs. Above nine, check quality because scopes may be too thin. Average drive time between stops under ten minutes is where the economics become comfortable and density pays off.
Should I include snow removal in my KPI dashboard?
Yes, but track it as its own service line with its own margin. Snow smooths seasonal mix and retains crew leaders through winter, which carries real value. It also ties up trucks, adds liability exposure, and delivers weather-dependent revenue. Judge it on retained-crew-leader value as much as on profit, because some northern operators find it close to break-even.
What is a good equipment utilization rate for mowing assets?
Primary mowing assets should run above 90% of available hours in peak season. Trucks somewhat lower. Specialty equipment like aerators and stump grinders legitimately runs at 40–60% because they earn by displacing rental cost. The classic mistake is buying a second skid-steer while the first sits at 45%, which is a scheduling problem wearing a capex costume.
How do I avoid underpricing by ignoring labor burden?
Have your bookkeeper compute actual loaded cost per field hour from last year's payroll, payroll taxes, workers' comp premiums, general liability, and benefits. The loaded multiplier is meaningfully above 1.2. Shops pricing at wage times 1.2 are systematically underbidding. Put the true loaded number into your estimating template before next season's bids go out.
Why is blended gross margin a dangerous metric?
Blended margin averages maintenance, which is labor-heavy and high-margin, with install, which is material-heavy and often thin. A healthy 31% blended margin can hide a maintenance division in the low fifties quietly funding an install division barely clearing the high teens. Split the chart of accounts by service line before the season starts, not at year end.
What seasonal revenue mix should a landscaping company expect?
Non-snow operators typically see the heaviest quarter around 30–32% of annual revenue and the lightest around 18–20%. Snow-belt operators with real plowing books invert winter quarters. The risk to watch is a combined Q1 and Q4 too thin to carry payroll for retained crew leaders through February. Build winter service lines rather than laying off trained leaders.
How do I improve route density without firing customers?
Define a service polygon per route and price anything outside it at a premium covering windshield time. Let the customer decide. Most shops discover a handful of edge customers consume more gross profit in drive time than they generate. Repricing either fixes the economics or removes the problem, and both outcomes are acceptable for density.
What is the biggest mistake in building a KPI dashboard?
Building the dashboard before fixing data classification. If revenue is not classified by service line and hours are not split into productive and non-productive, a beautiful dashboard reports beautiful nonsense. Sequence the work: clean classification first, then a five-number weekly scoreboard on paper, then automation. Ninety days, no new software required.
Sources
- https://www.lmn.com/blog/
- https://www.aspiresoftware.com/blog/
- https://www.serviceautopilot.com/blog/
- https://www.realgreen.com/blog/
- https://www.nalsa.org/
- https://www.landcarenetwork.org/
- https://www.bls.gov/ooh/building-and-grounds-cleaning/grounds-maintenance-workers.htm
- https://www.irs.gov/publications/p15
- https://www.osha.gov/landscaping
Related on PULSE
This page will be disappearing soon. Save it to your device for $1 — or read it free while it is here.
@Kory-White- · if Venmo asks, the last 4 of my number are 2012
This page is gone.
This one is off the shelf now. $1 keeps it on your phone for good — the whole page, pictures and diagrams included.
 pulse-industry-kpisTop 10 Sales KPIs for Commercial Chiropractic Practice in 2027
 pulse-industry-kpisTop 10 Sales KPIs for Online Travel Agency (OTA) in 2027
 pulse-industry-kpisTop 10 Sales KPIs for Commercial Crane Rental in 2027
 pulse-industry-kpisTop 10 Sales KPIs for Industrial Tank & Silo Manufacturing in 2027
 pulse-industry-kpisTop 10 Sales KPIs for Modular Data Center Manufacturing in 2027
 pulse-industry-kpisTop 10 Sales KPIs for Commercial Insurance Brokerage in 2027
 pulse-industry-kpisTop 10 KPIs for Pressure Washing Companies in 2027
 pulse-industry-kpisTop 10 Sales KPIs for Marine Sail & Rigging Loft Services in 2027
 pulse-industry-kpisTop 10 Sales KPIs for Commercial RV Dealership in 2027
 pulse-industry-kpisTop 10 Sales KPIs for Commercial Electrical Contracting in 2027