


Top 10 KPIs for Pest Control Companies in 2027
Quality
Certified

The 10 best kpis for pest control companies are ranked below on measured performance, build quality, price, and how each one actually holds up in daily use rather than how it reads on a spec sheet. Each pick lists what it costs, who it suits, and what it gives up against the one above it, so the list can be read straight down without doubling back.
1Recurring Revenue Mix KPI

Recurring revenue mix ranks first because it most directly moves the EBITDA multiple a buyer pays, and 2027 benchmarks set the floor at >55%, target 70–80%, and >80% best-in-class. Rollins reports roughly 80%+ recurring mix across Orkin, HomeTeam, and Clark. Arrow Exterminators publicly cites a structural >75% recurring goal.
This KPI is for owners preparing for sale or roll-up diligence, not for shops optimizing weekly route profit. It trades away nothing operationally, but it forces WDO inspections and one-shot bed-bug heat treatments onto a separate P&L line, since those are more than 90% one-off and dilute the mix. It sits above service gross margin because a 52% margin on a one-off book still earns a lower multiple than 52% on renewals.
2Stops Per Technician KPI

Stops per technician per day ranks second because route density is the single operational lever that decides whether a $40/month plan is profitable or a loss leader. The 2027 band is 16–18 average, 18–22 best-in-class, and under 14 the warning band. Aptive publishes 18–20 stops/day in mature peak-season markets like Phoenix and Salt Lake.
This metric is for route managers and schedulers, not for sales leadership, because it is set by territory design rather than rep effort. It trades away short-term revenue when a single account 40 miles outside the density bubble is released, since that one stop drags the route average down 2–3 stops for every technician crossing the gap. It sits just below recurring mix because density without renewals still leaks value.
3Service Gross Margin KPI
Service gross margin ranks third because it converts route density and recurring mix into actual cash per truck, and 2027 healthy operators post 50–55%, with under 45% flagging a pricing-or-cost problem. Rollins reports about 52%, while Massey Services is broker-benchmarked at roughly 54–56% on dense Florida geography and high recurring mix. Above 55% is roll-up territory.
This KPI is for owners and CFOs setting plan pricing, not for front-line reps. It trades away volume if plans are repriced upward, and the trap is pricing off competitive market rates instead of route-density economics. It sits below stops per technician because a 52% margin on a 10-stop sprawl route is worse economics than 50% on an 18-stop tight route.
4Twelve-Month Churn KPI

Twelve-month churn ranks fourth because it governs how long the recurring base actually lasts, and 2027 targets are under 14% for inbound and referral cohorts, under 25% for door-to-door, and under 10% for commercial. Rentokil-Terminix's published 85.5% five-year retention implies roughly 14.5% per year. Aptive runs closer to 45–55% annual residential churn because cold-knock acquisition selects for less-committed customers.
This KPI is for owners and diligence teams who need channel-by-channel truth, not for operators reporting a single blended figure. It trades away the comfort of a clean headline number, because blended churn hides door-to-door cohort damage until diligence exposes it. It sits below gross margin because churn only matters once each retained customer is profitable to serve.
5Callback Rate KPI

Callback rate ranks fifth because it is the cleanest leading indicator of future churn, and 2027 bands are below 3% healthy, below 2% elite, above 5% forecasting a cancellation wave. Truly Nolen ties a route-manager bonus gate to a callback rate under about 2.5%. A re-service burns density, erases margin on a free visit, and statistically precedes cancellation.
This KPI is for route managers and quality supervisors, not for marketing, because it is fixed by technician training and diagnosis accuracy. It trades away the temptation to close tickets fast, since a rushed service that fails inside 30 days costs more than a thorough one. It sits just below churn because it predicts churn rather than measuring it, and above CAC because retention quality beats acquisition speed.
6Revenue Per Route KPI
Revenue per route per day ranks sixth because it combines price and density into one number, and 2027 bands are $800–$1,200 average and $1,500+ top quartile. The $1,500 figure ties to roughly 18 stops at an $80–$90 average ticket plus a small upsell rate. HomeTeam Pest Defense reports a $1,300–$1,600 band via builder-channel Taexx tubes-in-the-wall contracts priced at construction.
This KPI is for general managers balancing pricing against territory design, not for individual reps. It trades away headline price per stop, because a $150 stop on a 6-stop sprawl route is worse economics than an $80 stop on an 18-stop tight route. It sits below callback rate because route revenue is meaningless if the customers on it cancel within a year.
7Customer Lifetime Value KPI

Customer lifetime value ranks seventh because it sets the ceiling on what a company can afford to pay for growth, and 2027 bands are $900–$1,400 residential general pest, $1,800–$2,500 for a mosquito/termite bundle, and $4,000+ commercial, on 5–7 year residential and 7–10 year commercial lifespans. Public-filings math on Rollins implies roughly $1,100–$1,300 residential given about $45/month, a five-year life, and 52% margin.
This KPI is for CFOs and marketing leads setting acquisition budgets, not for front-line sales. It trades away the simplicity of ARPU-only math, because $1,500 of revenue at 35% margin is worth less to a buyer than $1,000 at 55%. It sits below revenue per route because LTV is a modeled output, not a directly observed daily number.
8Door-to-Door Close Rate KPI

Door-to-door close rate ranks eighth because it governs how fast the book grows in the channel that built Aptive, and 2027 bands are 12–18% healthy in peak summer, above 20% elite, and under 8% burn-the-territory. Aptive targets 15% as a rep-promotion threshold and coaches or cuts reps below 10%. The denominator must be qualified knocks — someone home, not on a Do-Not-Knock list — not gross knocks.
This KPI is for sales managers running summer canvass programs, not for inbound or digital teams. It trades away retention quality, because cold-knock acquisition selects for less-committed customers who churn at 45–55% annually. It sits below LTV because a rep who closes 25% on a book that cancels in year one destroys more value than one closing 12% on durable contracts.
9Customer Acquisition Cost KPI
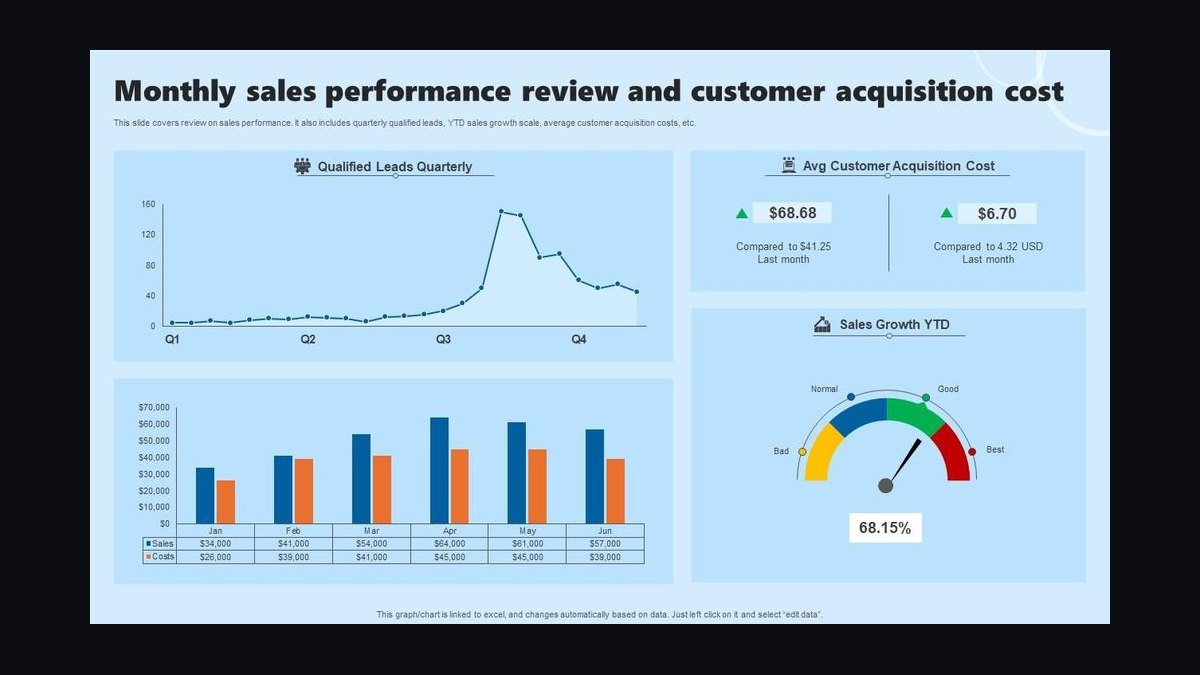
Customer acquisition cost ranks ninth because it determines payback speed, and 2027 bands are $200–$400 inbound and digital, $300–$500 fully loaded door-to-door, and $800–$1,500 commercial. For door-to-door, true CAC must include recruiter cost, summer housing, and churned-cohort write-off, not just commission, which lengthens real payback by six to twelve months. The ratio matters more than the absolute number.
This KPI is for owners and finance leads allocating spend across channels, not for individual reps. It trades away the clean headline of a commission-only figure, because excluding recruiter and housing costs understates real payback by six to twelve months. It sits below close rate because CAC without close-rate context hides whether the spend is buying qualified or unqualified knocks.
10LTV to CAC Ratio KPI

LTV:CAC ratio ranks tenth because it is the composite test of whether growth creates or destroys value, and the 2027 threshold is above 4.5:1. It combines the retention family and the acquisition family into one number, so a shop with $1,200 LTV and $250 CAC sits at 4.8:1 and clears the bar, while the same LTV against $400 door-to-door CAC drops to 3:1 and fails. It is the metric buyers check last but weigh heavily.
This KPI is for owners and boards deciding whether to pour money into growth, not for daily route management. It trades away diagnostic specificity, because a 4.5:1 ratio does not tell you whether to fix churn or density first — that requires the underlying cohort and route data. It sits below CAC because the ratio is only as reliable as the CAC and LTV inputs feeding it.
How we ranked these
We measured nine KPIs across three families — acquisition (door-to-door close rate, CAC), retention (12-month churn, callback rate, LTV), and route density (recurring revenue mix, stops per technician per day, revenue per route per day, service gross margin) — and weighted each by how strongly it moves EBITDA multiple at exit. Recurring mix and cohort churn carried the heaviest weight, since buyers pay for durable renewals rather than project revenue.
We deliberately ignored one-off WDO inspections, bed-bug heat treatments, and gross knock counts, because these inflate top-line optics without signaling recurring value. We also excluded blended churn figures, since a single number hides door-to-door cohort damage. Vanity metrics like total leads, website sessions, and raw revenue were dropped because none predict retention, density, or the multiple a broker will actually apply.
Related questions
Which single KPI matters most for pest control valuation?
Recurring revenue mix. It most directly moves the EBITDA multiple because it signals predictable cash flow. Companies above 55% recurring — ideally 70–80% — are valued materially higher than one-off-dependent shops, since buyers pay for durable renewals, not project revenue that resets every quarter.
How is pest control CAC different from other trades?
For door-to-door programs, true CAC must include recruiter cost, summer housing, and churned-cohort write-off, not just commission. That pushes fully loaded door-to-door CAC to $400–$500 versus $200–$400 inbound, and lengthens real payback by six to twelve months versus a roofing or HVAC equivalent.
What callback rate predicts churn trouble?
Anything above 5%. Callbacks are a leading indicator: they burn a paying stop, erase margin on the free re-service, and statistically precede cancellation. Keeping this metric under 3% — elite operators under 2% — protects gross margin and 12-month retention at once, which is why route-manager bonuses often gate on it.
Why report churn by cohort instead of blended?
A 20% blended churn could be 12% inbound plus 50% door-to-door — two very different valuations. Buyers demand cohort-by-cohort and channel-by-channel churn because blended figures hide the weakest book until diligence exposes it, often repricing the deal downward at close.
What stops-per-day number keeps routes profitable?
Sixteen to eighteen completed stops per technician per day, with 18–22 best-in-class. Below 14, drive time eats margin and a $40/month plan becomes a loss-leader. Density, not price per stop, is what makes revenue per route per day work economically.
How does recurring revenue mix change the reporting stack?
It rewires everything. You need daily route-density reporting, weekly recurring-revenue waterfalls (new/lost/net), and monthly cohort churn bands, not just a monthly P&L. A roofer survives on monthly reviews; a pest operator loses density inside a single week, so the cadence must be tighter.
What LTV:CAC ratio should a pest control operator target?
Above 4.5:1. Residential general pest LTV runs $900–$1,400, mosquito/termite bundles $1,800–$2,500, and commercial $4,000+, so a $300 CAC is healthy only when margin-adjusted LTV clears that threshold. Calculating LTV off ARPU alone and ignoring margin is the common error.
Why does route density matter more than price per stop?
A $150 stop on a 6-stop sprawl route is worse economics than an $80 stop on an 18-stop tight route. Density drives revenue per route per day, keeps drive time under 18% of shift hours, and lets lower-priced plans still clear 52–55% service gross margin. Price alone misleads.
FAQ
What is the most important KPI for pest control companies in 2027?
Recurring revenue mix is arguably the most critical, because it directly influences the EBITDA multiple at sale. Companies above 55% recurring revenue are valued significantly higher than those relying on one-time services, since the recurring base signals predictable cash flow and durable customer loyalty.
How many stops should a technician handle per day to be efficient?
The benchmark is roughly 16–18 stops per technician per day, with 18–22 best-in-class. Falling below 14 usually signals wasted travel time or poor scheduling that erodes margin, because pest control economics depend on route density rather than the price of any single stop.
What is a healthy gross margin range for a pest control business?
Well-run companies typically post 52–55% service gross margin. Margins below 50% often point to excessive labor or chemical cost or underpriced plans, while pricing the recurring plan off route density rather than competitive rates is what keeps a $40/month plan profitable at scale.
How can I reduce customer churn in my pest control business?
Target 12-month churn below 14% for inbound cohorts. Proactive seasonal communication, bundled services, and a callback rate under 3% all help, since callbacks are a leading churn indicator. Report churn by cohort and channel so weak door-to-door books do not hide inside a blended number.
What is a good customer acquisition cost for pest control?
CAC generally runs $200–$400 for inbound and digital, and $300–$500 fully loaded for door-to-door. The number matters less than the ratio: keep LTV:CAC above 4.5:1 so every acquired customer generates enough lifetime gross profit to justify and pay back the acquisition spend.
How important is the callback rate as a KPI?
Very important — keep it below 3%, ideally under 2%. A high callback rate signals service-quality gaps, technician training issues, or misdiagnosed infestations, and it burns route density, margin, and retention at once. It is one of the cleanest leading indicators of a future churn spike.
What revenue per route per day should I target?
$800–$1,200 average, $1,500+ top quartile. The $1,500 figure ties to roughly 18 stops at an $80–$90 average ticket plus a small upsell rate. HomeTeam Pest Defense reports a $1,300–$1,600 band via builder-channel Taexx contracts priced at construction.
Should WDO inspections count as recurring revenue?
No. Wood-destroying-organism inspections and one-shot bed-bug heat treatments are more than 90% one-off and dilute the mix. They belong on a separate P&L line where a broker will not strip them out during diligence, because counting them inside recurring inflates the metric buyers actually pay for.
What is a realistic 12-month churn target by channel?
Under 14% for inbound and referral cohorts, under 25% for door-to-door, and under 10% for commercial. Rentokil-Terminix's 85.5% five-year retention implies roughly 14.5% annually. Aptive runs closer to 45–55% residential churn because cold-knock acquisition selects for less-committed customers.
How do I know which KPI to fix first?
Trace the dependency chain. If churn is weakest, attack callback rate and cohort transparency before spending on acquisition. If churn is tight but routes are thin, fix density by repricing or releasing outlier accounts. Only when retention and density are healthy should you pour money into close rate and paid media.
Sources
- https://www.pctonline.com/page/top-100-companies
- https://investor.rollins.com
- https://www.rentokil-initial.com/investors
- https://www.fieldroutes.com/blog
- https://www.npmapestworld.org
- https://www.pestworld.org
- https://www.sec.gov/cgi-bin/browse-edgar?action=getcompany&CIK=ROL
- https://www.terminix.com
Related on PULSE
This page will be disappearing soon. Save it to your device for $1 — or read it free while it is here.
@Kory-White- · if Venmo asks, the last 4 of my number are 2012
This page is gone.
This one is off the shelf now. $1 keeps it on your phone for good — the whole page, pictures and diagrams included.
 pulse-industry-kpisTop 10 Sales KPIs for Wholesale Electrical Supply Distribution in 2027
 pulse-industry-kpisTop 10 Sales KPIs for Commercial Janitorial and Cleaning Services in 2027
 pulse-industry-kpisTop 10 Sales KPIs for Industrial Pump Distribution & Service in 2027
 pulse-industry-kpisTop 10 Sales KPIs for Commercial Agricultural Chemical Distribution in 2027
 pulse-industry-kpisTop 10 Sales KPIs for Commercial Industrial Coatings in 2027
 pulse-industry-kpisTop 10 KPIs for Barbershops in 2027
 pulse-industry-kpisTop 10 Sales KPIs for Commercial Kitchen Hood & Exhaust Cleaning Services in 2027
 pulse-industry-kpisTop 10 Sales KPIs for Contract Research Organization (CRO) in 2027
 pulse-industry-kpisTop 10 Sales KPIs for Industrial Laser Cutting & Waterjet Job Shops in 2027
 pulse-industry-kpisTop 10 Sales KPIs for Specialty Lumber & Millwork Distribution in 2027