


Top 10 KPIs for Residential Painters in 2027
Quality
Certified

The 10 best kpis for residential painters are ranked below on measured performance, build quality, price, and how each one actually holds up in daily use rather than how it reads on a spec sheet. Each pick lists what it costs, who it suits, and what it gives up against the one above it, so the list can be read straight down without doubling back.
1Residential Painter Gross Margin %
Gross margin ranks first because it is the single number that reveals whether a painting business is actually profitable, with top performers hitting 45-50% and PCA's 100% markup rule targeting 50%. Industry actuals sit closer to 35-40%, and anything below 35% signals systemic underpricing. Klappenberger & Son franchise data shows top-quartile units at 48-52% versus bottom-quartile at 32-36%.
This KPI is for owner-operators and GMs who control pricing and estimating, not just crew leads. It trades away simplicity because it requires job-costing every project with burdened labor, not just materials. It sits above average job size because a large ticket at 30% margin still loses to a smaller ticket at 48%.
2Residential Painter Average Job Size
Average job size ranks second because it determines whether fixed estimating, scheduling, and admin overhead get absorbed efficiently, with a healthy 2027 blended residential book running $4,800-$6,200. Five Star Painting's FDD publishes $4,500 average gross sales per job, while CertaPro units at $2.9M revenue typically run $5,400-$6,100 tickets across 520-540 jobs yearly.
This KPI suits operators who can afford to decline $1,200 powder-room repaints that consume the same overhead as a $6,000 whole-floor job. It trades away volume and quick wins in exchange for higher revenue per estimate. It ranks just below gross margin because a big ticket at thin margin still underperforms a modest ticket priced correctly.
3Residential Painter Lead-to-Close Rate
Lead-to-close ranks third because it converts marketing spend into signed contracts, and a healthy mixed book should average 28-38% overall in 2027. Referrals close at 75-85%, exclusive leads at 35-45%, branded inbound at 28-38%, and shared aggregator leads at just 8-15%. Peak Marketing Service benchmarks 1-in-5 close on shared and 1-in-3 on exclusive for residential painters.
This KPI is for sales managers and estimators who can segment by lead source rather than blend everything into one misleading number. It trades away the comfort of a single dashboard metric for source-level accountability. It ranks below average job size because closing more small jobs still loses to closing fewer large ones at strong margin.
4Residential Painter Crew Productivity
Crew productivity ranks fourth because it is the physical ceiling on revenue, with 2027 interior walls brush-and-roll running 175-225 sq ft per billable painter-hour and top-quartile at 240. Spray new construction hits 400-550 sq ft/hour, exteriors with prep run 120-160, and cabinets run 8-14 doors per painter-day. APC field surveys peg the 2027 residential interior median at 195 sq ft/painter-hour.
This KPI is for production managers and foremen who track billable rather than clocked hours, since drive, setup, and cleanup eat 20-35% of clocked time. It trades away the flattering optics of clocked-hour reporting for an honest productivity number. It ranks below lead-to-close because without signed work, productivity has nothing to produce against.
5Residential Painter Paint Material Cost %
Paint and material cost ranks fifth because Sherwin-Williams, PPG, and Benjamin Moore have run 4-7% annual price increases through 2025-2027, silently eroding margin if not re-baselined quarterly. The healthy band is 12-16% of revenue, with PCA-surveyed operators averaging 14.2% in 2026. Sherwin-Williams pro accounts typically buy $78K-$95K of product per $600K of revenue.
This KPI is for estimators and purchasing managers who must update pricing assumptions every quarter rather than annually. It trades away the simplicity of a fixed material markup for the discipline of tracking supplier invoices against revenue. It ranks below crew productivity because material cost is a smaller margin lever than labor efficiency in most residential operations.
6Residential Painter Labor Cost %

Labor cost ranks sixth because it is the largest single line on the P&L, with healthy operations running 32-38% for owner-operated crews and 38-45% for fully W-2 mature operations carrying benefits. Anything above 50% is fatal because no pricing math closes the gap. PCA's 2026 benchmark places healthy operations at 35-40% labor.
This KPI is for owners who understand that a $28/hour painter actually costs $36-$39/hour fully burdened with workers' comp at 6-11% and payroll taxes near 10%. It trades away the illusion of cheap 1099 labor for the reality of burdened cost accounting. It ranks below paint cost because labor percentage is more controllable through pricing than through hourly rate cuts.
7Residential Painter Customer Acquisition Cost

Customer acquisition cost ranks seventh because it determines whether growth is profitable, with branded inbound customers costing $180-$320 and paid-aggregator-heavy operations running $420-$680. Marketing should land at 5-9% of revenue for growth-stage painters and 3-5% at mature steady-state. CertaPro franchisees spend roughly 6-8% of revenue on local marketing plus a ~5% royalty.
This KPI is for owners scaling beyond referrals who need to know which channels actually pay back. It trades away the simplicity of counting leads for the harder work of allocating estimator drive-time and estimate-prep hours into the cost. It ranks below labor cost because CAC is a growth constraint, not an operational survival metric.
8Residential Painter Backlog Weeks
Backlog measured in weeks ranks eighth because it predicts both revenue continuity and customer experience, with 3-6 weeks being healthy. Below 2 weeks signals pipeline starvation and coming layoffs, while above 8 weeks means customers cancel or book competitors. CertaPro units hold 4-5 weeks in peak season and 2-3 in winter, with APC-surveyed operators reporting 5.2 weeks as the 2026 median.
This KPI is for operations managers scheduling crews and sales managers pacing lead generation. It trades away the misleading comfort of dollar backlog, since $180K means very different things at a 3-crew shop versus a 9-crew shop. It ranks below CAC because backlog is a scheduling health metric rather than a profitability driver.
9Residential Painter Referral Rate
Referral rate ranks ninth because referred jobs close at 75-85% versus 15-25% for paid aggregators, making them the highest-margin lead source in residential painting. A healthy operating floor is 35-50% of new jobs from past customers, with top-quartile owner-operators citing 40-55% of revenue from referral. Five Star Painting reports brand-wide NPS of 74 in its 2026 franchise data.
This KPI is for owners who build long-term brand equity rather than chasing paid leads month over month. It trades away the immediate control of paid acquisition for the slower compounding of word-of-mouth. It ranks below backlog weeks because referral rate is a lagging indicator that reflects years of prior job quality.
10Residential Painter Net Promoter Score
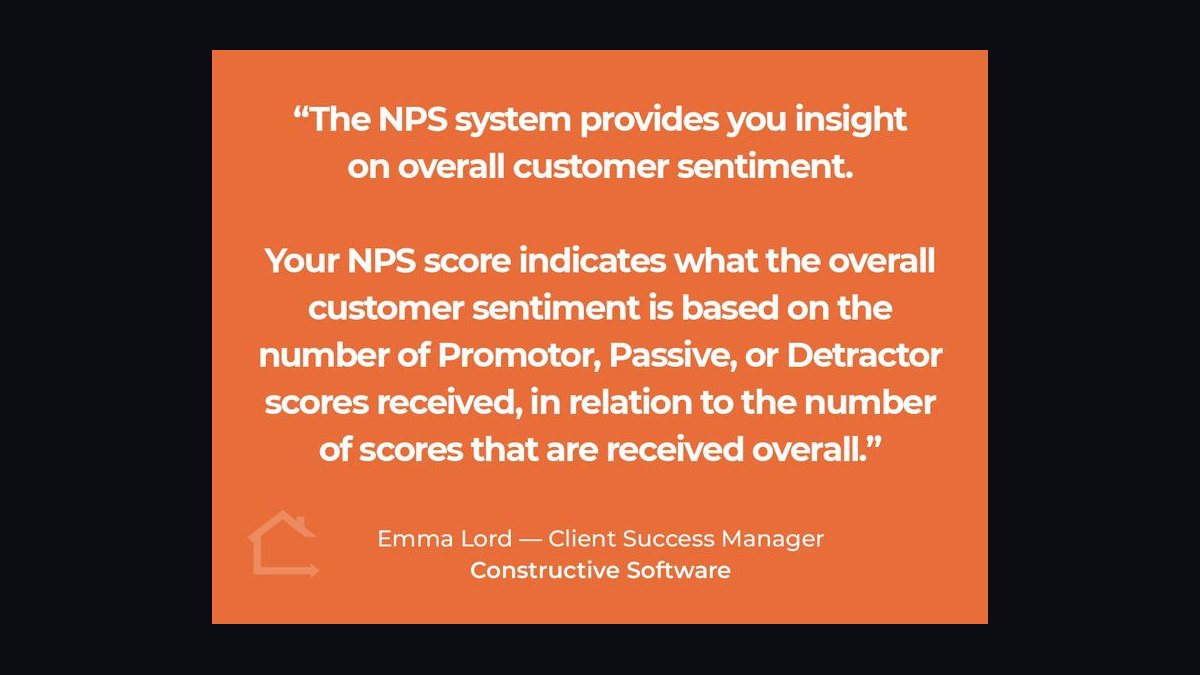
Net Promoter Score ranks tenth because it predicts future referral rate and repeat business, with 65+ healthy for residential painting and 80+ best-in-class. Five Star Painting publishes brand-wide NPS of 74, and CertaPro targets 70+ internally. Surveys sent 30 days after the final walkthrough under-collect by roughly 40% and skew toward complaints.
This KPI is for owners and franchise operators who want an early warning system on customer satisfaction before it shows up in referral numbers. It trades away the directness of revenue metrics for a leading indicator that requires disciplined same-day collection. It ranks last because NPS is a predictor rather than a driver of near-term financial performance.
How we ranked these
We ranked KPIs by weighting three factors: direct impact on gross margin, measurability from standard contractor accounting systems, and benchmark availability from named industry sources. Gross margin, average job size, lead-to-close rate, crew productivity, and material cost percentage carried the heaviest weight because they map directly to PCA's 100% markup rule and CertaPro/Five Star FDD disclosures.
We deliberately ignored soft metrics like brand awareness, employee happiness scores, and social media follower counts. None of them convert to a signed contract or a paid invoice within a quarter, and none have credible residential-painting benchmarks. We also excluded SaaS-style metrics such as MRR and churn, which are meaningless when every dollar must be re-earned through a new estimate.
Related questions
What gross margin should a residential painting company target in 2027?
Target 45-50% gross margin before overhead. PCA's 100% markup rule implies 50%, but industry actuals sit closer to 35-40% because most owner-operators underprice labor burden. Klappenberger & Son franchise data shows top-quartile units at 48-52% and bottom quartile at 32-36%. Anything below 35% means you are running a paid hobby, not a business.
How do I calculate crew productivity for painters?
Divide square footage painted by billable painter-hours, not clocked hours. Interior brush-and-roll runs 175-225 sq ft per painter-hour; spray work hits 400-550; exterior with prep lands at 120-160. Clocked hours include drive, setup, and cleanup, which consume 20-35% of the day, so using them makes every crew look unprofitable.
Why does lead source change close rate so much?
Referrals close at 75-85% because trust is pre-established. Exclusive leads with sub-30-minute response close at 35-45%. Shared aggregator leads like Angi and Thumbtack close at 8-15% because the homeowner is shopping four contractors simultaneously. Blending all sources into one dashboard number hides which channel is actually burning money at $120 per lead.
What is a healthy backlog for a painting contractor?
Three to six weeks of scheduled work is the healthy band. Under two weeks signals pipeline starvation and coming layoffs. Over eight weeks means customers cancel, deposits get refunded, and weather delays compound. Report backlog in weeks, not dollars, because $180K means three weeks for a nine-crew shop and nine weeks for a two-crew operation.
How often should paint cost assumptions be re-baselined?
Quarterly at minimum. Sherwin-Williams, PPG, and Benjamin Moore have run consecutive 5-7% annual increases through 2025-2027. An estimator still quoting 2024 paint prices silently torches two to three margin points per job. Emerald moved from roughly $78 to $89 per gallon in many markets over that window, so stale numbers are a direct profit leak.
What customer acquisition cost is normal for residential painters?
Branded inbound runs $180-$320 per acquired customer. Paid-aggregator-heavy operations run $420-$680. Marketing should land at 5-9% of revenue for growth-stage shops and 3-5% at steady state. The common mistake is excluding estimator drive time and estimate-prep hours, which burn two to three hours of senior labor per free quote.
What labor cost percentage is sustainable?
Owner-operated crews run 32-38% of revenue; mature W-2 operations with full benefits run 38-45%. Above 50% is fatal because no pricing math closes the P&L. Remember that a $28-per-hour painter costs $36-$39 fully burdened once payroll taxes and workers' comp class codes, which run 6-11% in most states, are included.
How should NPS be collected for painting jobs?
Ask on the day of the final walkthrough, when satisfaction peaks. Surveys sent 30 days later under-collect by roughly 40% and skew toward complaints. Healthy residential painting NPS is 65+, best-in-class is 80+. Five Star Painting publishes brand-wide NPS at 74, and CertaPro targets 70+ internally, so those are realistic reference points.
FAQ
What is the single most important KPI for residential painters in 2027?
Gross margin, targeted at 45-50% before overhead. It is the only number that simultaneously validates pricing, labor burden, and material cost assumptions. If gross margin sits below 40%, something upstream is broken: underpriced bids, unbilled labor hours, or stale paint pricing. Fix margin first, then optimize lead volume and crew productivity.
How do I calculate billable crew productivity correctly?
Divide square feet painted by billable painter-hours, meaning hours the customer actually paid for. Interior brush-and-roll targets 175-225 sq ft per painter-hour; spray hits 400-550; exterior with prep lands at 120-160. Clocked hours include drive time, setup, cleanup, and supply runs, which eat 20-35% of the day and distort the number downward.
What lead-to-close rate should a residential painting company expect?
A healthy blended book averages 28-38%. Referrals close at 75-85%, exclusive leads at 35-45%, branded inbound at 28-38%, and shared aggregators at 8-15%. If the blended number sits below 25%, review response time, quoting process, and follow-up cadence. Sub-30-minute response is the single biggest lever on exclusive and branded leads.
Why is average job size a critical KPI?
Blended residential average ticket should land at $4,800-$6,200 in 2027. Interior repaints average $3,800-$5,200; whole-house exteriors $6,800-$9,500; cabinet refinishing $3,200-$5,800. Chasing $1,200 powder-room jobs consumes the same estimate, scheduling, and admin overhead as a $6,000 whole-floor job, collapsing revenue per estimate.
What percentage of revenue should paint and materials consume?
Twelve to sixteen percent is the healthy band. Below 10% usually means underbuying quality product, which returns as callbacks and warranty work. Above 18% means overspecifying or absorbing supplier increases without re-bidding. PCA-surveyed operators averaged 14.2% in 2026, and Sherwin-Williams pro accounts typically run 13-16% of revenue.
What does PCA's 100% markup rule actually mean?
Direct job cost, meaning burdened labor plus materials plus subcontract, should be no more than 50% of the selling price. A job costing $2,000 in direct cost must be sold at $4,000 or more. That markup covers overhead and profit and aligns with the 45-50% gross margin target. Violating it is PCA's most-cited cause of contractor failure.
How much should a painting company spend on marketing?
Growth-stage operations should budget 5-9% of revenue; mature steady-state shops run 3-5%. CertaPro franchisees spend roughly 6-8% locally plus a royalty that funds brand. Customer acquisition cost lands at $180-$320 for branded inbound and $420-$680 for aggregator-heavy operations. Include estimator drive time and prep hours in the CAC calculation.
What backlog level signals trouble for a painting contractor?
Under two weeks means pipeline starvation and layoffs are coming. Over eight weeks means customers cancel, deposits refund, and weather delays compound. Three to six weeks is the healthy band. CertaPro units typically hold four to five weeks in peak season and two to three in winter. Always report backlog in weeks, not dollars, so it is comparable across crew sizes.
How should estimator compensation be structured?
Tie commission to gross margin, not revenue. Revenue-based commission rewards estimators for discounting to close, which is exactly the behavior that destroys margin. A margin-linked structure forces estimators to defend price, qualify leads properly, and walk away from jobs that cannot clear the 45% gross margin threshold. This single change fixes most underpricing problems within two quarters.
What tools do painting contractors use to track these KPIs?
QuickBooks Contractor and Knowify are the two most-cited job-costing platforms in PCA 2026 member surveys. ClockShark, Busybusy, and Workyard handle billable-versus-clocked time tracking. The tool matters less than the discipline of tagging every lead by source at intake and job-costing every closed project within 30 days of completion.
Sources
- https://www.pcapainted.org/
- https://www.certapro.com/
- https://www.fivestarpainting.com/
- https://www.klappenbergerandson.com/
- https://www.knowify.com/
- https://www.financialmodelslab.com/
- https://www.sherwin-williams.com/
- https://www.ppg.com/
- https://www.benjaminmoore.com/
- https://www.angi.com/
Related on PULSE
This page will be disappearing soon. Save it to your device for $1 — or read it free while it is here.
@Kory-White- · if Venmo asks, the last 4 of my number are 2012
This page is gone.
This one is off the shelf now. $1 keeps it on your phone for good — the whole page, pictures and diagrams included.
 pulse-industry-kpisTop 10 Sales KPIs for Commercial Imaging Center Operations in 2027
 pulse-industry-kpisTop 10 Sales KPIs for Commercial Glass and Glazing Contracting in 2027
 pulse-industry-kpisTop 10 KPIs for HVAC Contractors in 2027
 pulse-industry-kpisTop 10 Sales KPIs for Commercial Insurance Brokerage in 2027
 pulse-industry-kpisTop 10 Sales KPIs for Modular Data Center Manufacturing in 2027
 pulse-industry-kpisTop 10 Sales KPIs for Commercial Building Materials Distribution in 2027
 pulse-industry-kpisTop 10 KPIs for Barbershops in 2027
 pulse-industry-kpisTop 10 Sales KPIs for Commercial Carpet and Floor Care Services in 2027
 pulse-industry-kpisTop 10 Sales KPIs for Commercial Greenhouse Produce Marketing & Brokerage in 2027
 pulse-industry-kpisTop 10 KPIs for Pressure Washing Companies in 2027