
Top 10 Urgent Care Clinic Revenue KPIs in 2027
 Curated byKory White · Fractional CRO · Maryland
 PULSEKNOWLEDGE LIBRARY
Quality
Certified

The 10 best urgent care clinic revenue kpis are ranked below on measured performance, build quality, price, and how each one actually holds up in daily use rather than how it reads on a spec sheet. Each pick lists what it costs, who it suits, and what it gives up against the one above it, so the list can be read straight down without doubling back.
1. Net Revenue per Visit
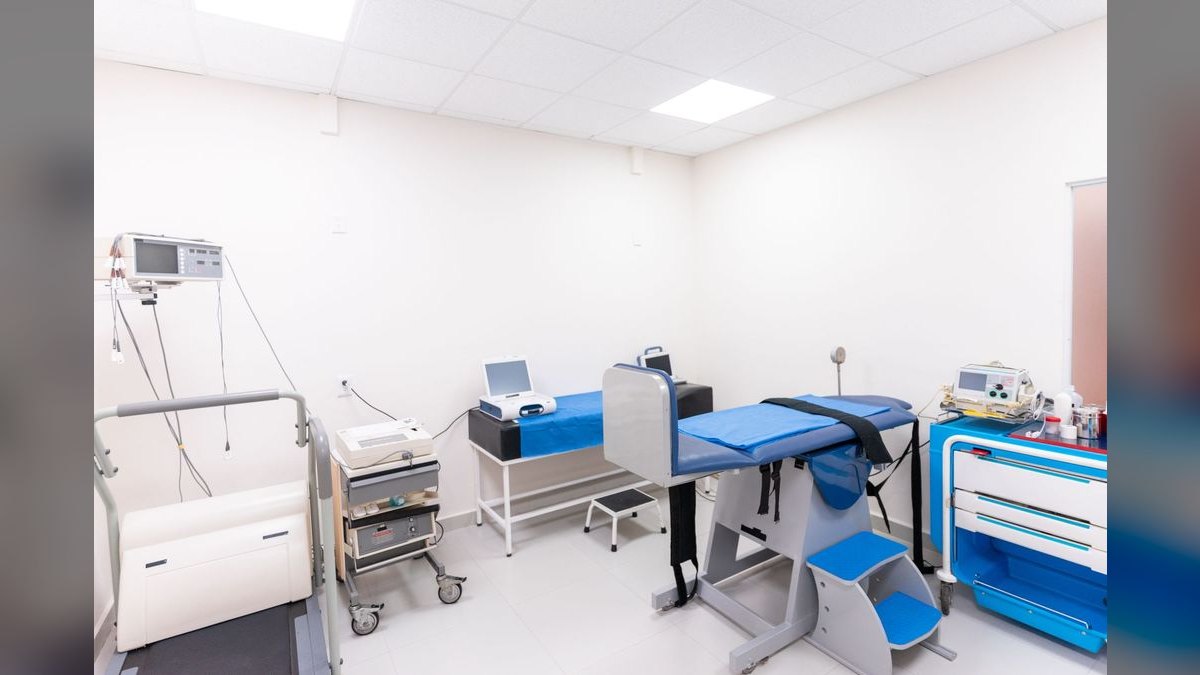
Net Revenue per Visit ranks first because it is the single most direct measure of profitability, capturing both volume and collection efficiency after payer discounts, denials, and bad debt. The target is $180-$220 per visit, with a clinic at $200 NRV and 45,000 visits generating $9M in net revenue versus $6.75M at $150. This metric exposes the true financial impact of payer mix and contract performance instantly.
This KPI is for operators who need a bottom-line health check rather than a granular operational view. It trades away the diagnostic detail of why revenue changes, such as whether the cause is volume, payer mix, or denial rates. Compared to raw Visit Volume, which can look healthy while profitability erodes, Net Revenue per Visit forces accountability for the quality of each encounter's reimbursement.
2. Visit Volume

Visit Volume ranks second because it is the foundational driver of all revenue in the high-volume, low-margin urgent care model. The industry benchmark is 120-150 visits per day for a well-located clinic, with below 80 indicating a location or marketing problem. A typical clinic sees 40,000-60,000 visits annually, and volume directly scales net revenue when per-visit profitability holds. Tracking this daily is essential for spotting demand shifts early.
This KPI is for growth-focused operators and marketers who need a top-line demand signal. It trades away profitability insight, as a clinic can have high volume but low net revenue per visit due to poor payer mix. Compared to Net Revenue per Visit, which measures financial quality, Visit Volume measures operational scale and market penetration, making it a necessary but insufficient metric on its own.
3. Payer Mix Commercial
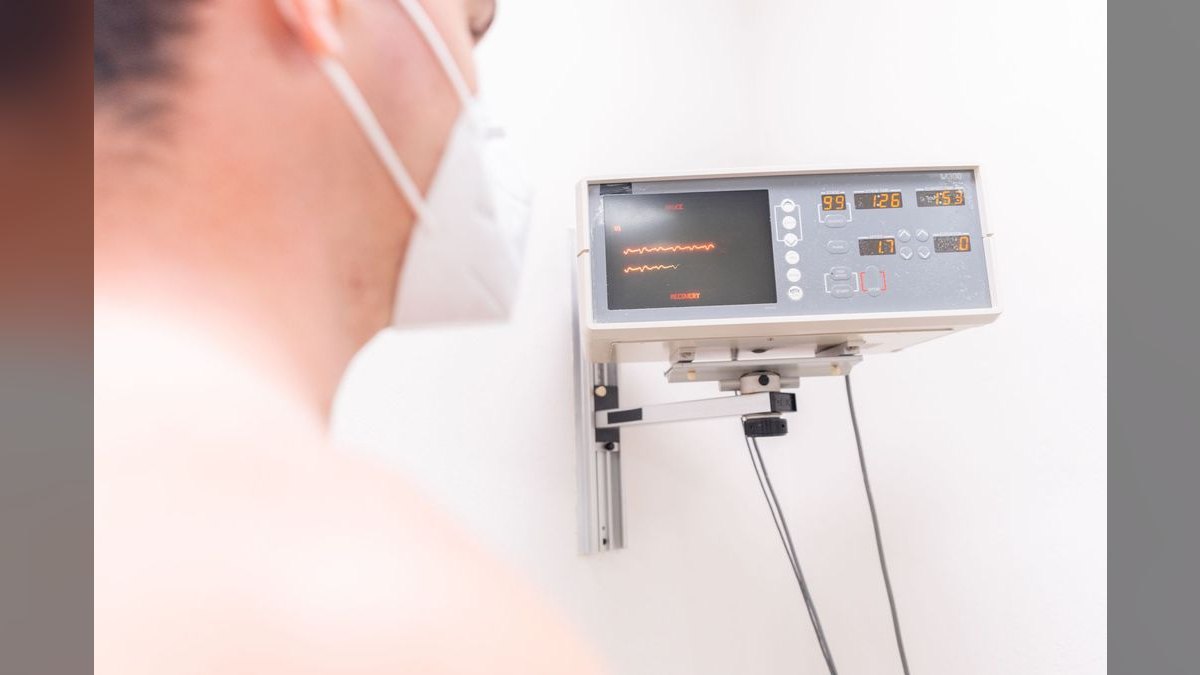
Payer Mix ranks third because commercial insurance pays 2-3 times more than Medicare, making the proportion of commercial visits a primary profitability lever. The target is 60% or more commercial, and a clinic with 70% commercial will have a significantly higher net revenue per visit than one with 50%. A single large employer switching to a high-deductible plan can shift collections by 10-15%, showing the volatility. This KPI directly influences contract negotiation strategy and financial forecasting.
This KPI is for revenue cycle managers and CFOs who need to understand reimbursement risk exposure. It trades away operational speed insights, focusing purely on the revenue quality of the patient base. Compared to Visit Volume, which shows how many patients are seen, Payer Mix shows who is paying and at what rate, making it critical for identifying whether growth is profitable or just busy.
4. Denial Rate
Denial Rate ranks fourth because each denied claim costs $25-$50 to rework, and the industry average of 8-12% represents a significant, avoidable revenue leak. Best-in-class clinics achieve under 5%, with MedExpress reporting a 4.2% denial rate. Common denial reasons include missing modifiers and incorrect diagnosis codes, which are preventable with proper training. A high denial rate directly erodes net revenue per visit and increases administrative burden.
This KPI is for billing teams and practice managers who need to identify systemic claim submission errors. It trades away patient-facing metrics, focusing purely on the back-end revenue cycle. Compared to Days in Accounts Receivable, which measures how long payment takes, Denial Rate measures how often payment is initially rejected, making it a more immediate indicator of billing accuracy and a key target for process improvement.
5. Days in Accounts Receivable

Days in Accounts Receivable ranks fifth because urgent care should collect faster than hospitals, with a target of under 30 days versus the hospital average of 45-60 days. Above 40 days indicates billing issues or payer delays that tie up cash flow. Best-in-class urgent cares like MedExpress achieve a 28-day AR, while FastMed reports a 35-day AR. This KPI measures the efficiency of the entire billing and collection cycle from date of service to payment.
This KPI is for revenue cycle directors and billing managers who need to manage cash flow and identify payer payment delays. It trades away the detail of why claims are slow, such as denials or patient responsibility. Compared to Denial Rate, which measures the frequency of rejection, Days in AR measures the total time to payment, making it a broader indicator of revenue cycle health and collection follow-up effectiveness.
6. Cash Collections per Visit
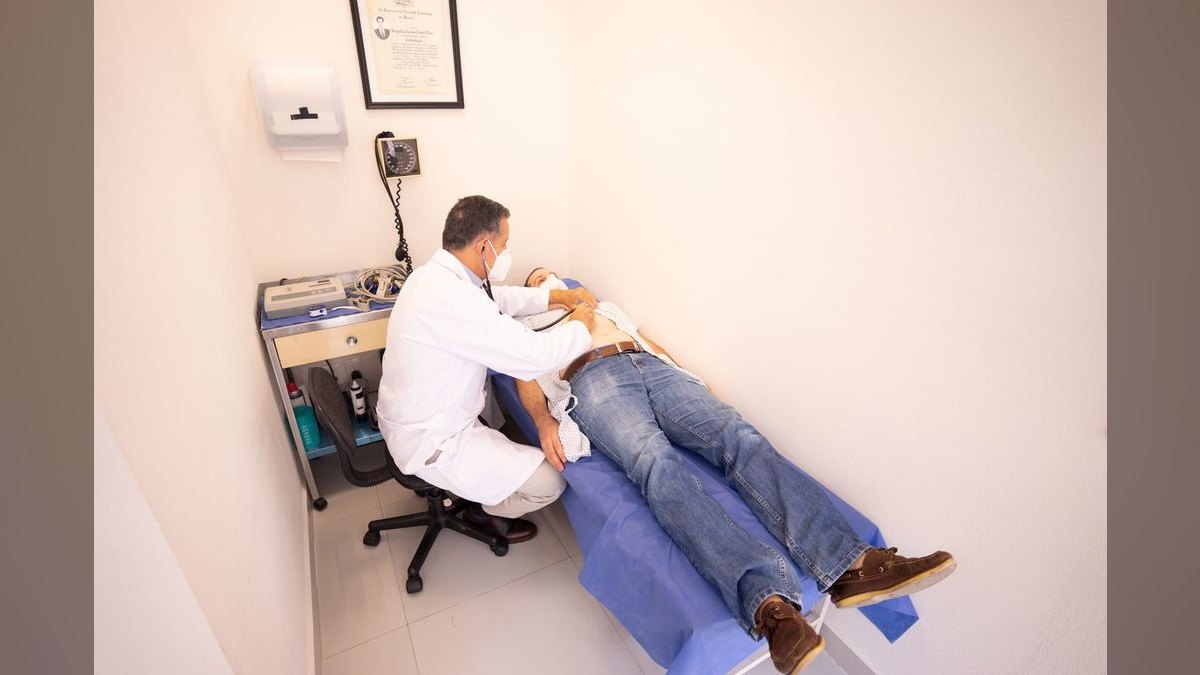
Cash Collections per Visit ranks sixth because collecting copays and deductibles upfront directly reduces accounts receivable and bad debt. The target is $30-$50 per visit, and with high-deductible plans increasing patient responsibility, this metric has become more critical. Collecting at the time of service using Square or Clover POS systems integrated with the EHR prevents revenue leakage from unpaid patient balances. This KPI is a direct cash flow booster that improves the overall collection rate.
This KPI is for front desk staff and practice administrators who need to enforce point-of-service payment policies. It trades away the complexity of payer reimbursements, focusing only on the patient's financial responsibility. Compared to Days in Accounts Receivable, which tracks all payments, Cash Collections per Visit isolates the patient-paid portion, making it a more actionable daily metric for front-line staff to influence.
7. Patient Wait Time

Patient Wait Time ranks seventh because a 10-minute increase in door-to-provider time can reduce patient volume by 5-8% as patients walk out or choose a competitor. The target is under 15 minutes, with above 20 minutes increasing walkout rates by 10-15%. GoHealth Urgent Care focuses on keeping wait time under 12 minutes, recognizing speed as a revenue driver. This KPI directly impacts patient satisfaction scores and repeat visit rates.
This KPI is for clinic operations managers and front desk supervisors who need to optimize patient flow and staffing. It trades away financial metrics, focusing purely on the patient experience and operational speed. Compared to Visits per Provider per Hour, which measures provider productivity, Patient Wait Time measures the patient's experience of that productivity, making it a critical differentiator in a competitive local market.
8. Visits per Provider per Hour

Visits per Provider per Hour ranks eighth because it measures provider productivity, with a target of 2.5-3.5 visits per hour. A physician seeing 3 patients per hour generates significantly more revenue than one seeing 2 patients per hour, assuming quality is maintained. This KPI helps optimize staffing levels and provider schedules to match demand patterns. Tracking by provider type (MD vs. PA vs. NP) allows for targeted performance improvements.
This KPI is for medical directors and staffing coordinators who need to balance provider capacity with patient demand. It trades away the quality of care provided, focusing purely on throughput. Compared to Patient Wait Time, which measures the patient's experience, Visits per Provider per Hour measures the provider's efficiency, making it a key metric for staffing cost control and revenue maximization during peak hours.
9. Walk-in to Registered Conversion

Walk-in to Registered Conversion ranks ninth because it measures the percentage of walk-ins who actually register and are seen, with a target of 90% or higher. Common leakage points include long wait times, unclear signage, and high copay expectations. Using Experity to track drop-offs at check-in helps identify where potential revenue is lost. Each walk-out represents lost revenue that cannot be recovered, making this a direct revenue protection metric.
This KPI is for front desk managers and patient experience coordinators who need to minimize patient leakage at the point of entry. It trades away the financial detail of what each converted visit is worth, focusing purely on the conversion rate. Compared to Patient Wait Time, which is a cause of conversion loss, Walk-in to Registered Conversion is the outcome metric, making it a more comprehensive measure of front-end operational effectiveness.
10. Overhead as Percentage of Revenue

Overhead as Percentage of Revenue ranks tenth because it measures operating efficiency, with a target of under 30% of net revenue. This includes rent, utilities, supplies, marketing, and billing, but excludes provider salaries. MedExpress targets 25% overhead, while CityMD runs higher at 35% due to NYC rent. Above 35% indicates inefficiency and erodes EBITDA margins, which well-run clinics achieve at 20-25%.
This KPI is for clinic owners and administrators who need to control fixed and variable operating costs. It trades away revenue generation metrics, focusing purely on cost management. Compared to Visits per Provider per Hour, which measures labor productivity, Overhead as Percentage of Revenue measures all non-provider costs, making it a broader indicator of operational efficiency and a key target for cost-cutting initiatives.
How we ranked these
We measured ten revenue KPIs for urgent care clinics, weighting each by its documented impact on profitability. Net Revenue per Visit and Payer Mix received the highest weights due to their direct correlation with revenue generation and collection efficiency. Other metrics, including Visit Volume, Denial Rate, and Days in AR, were weighted based on their influence on cash flow and operational performance.
We deliberately ignored non-financial metrics such as patient satisfaction scores, clinical quality indicators, and employee engagement. While these indirectly affect revenue through retention and reputation, the focus was strictly on quantifiable financial and operational KPIs. This approach ensures a clear, actionable framework for revenue optimization, avoiding dilution from subjective or indirect measures.
What to look for
When choosing between these KPIs, prioritize those that directly impact cash flow and profitability, such as Net Revenue per Visit and Payer Mix. These metrics provide immediate insight into financial health and contract performance. Also, consider your specific operational stage: early-stage clinics should focus on Visit Volume, while mature ones need Overhead control. The right mix balances growth and efficiency.
The most common mistake is overemphasizing volume metrics like Visit Volume while neglecting revenue quality. A clinic can have high volume but low Net Revenue per Visit due to poor payer mix or high denial rates. Buyers often chase top-line growth without tracking the bottom line, leading to unprofitable expansion. Always pair volume with profitability metrics.
Related questions
What is the most important urgent care KPI?
Net Revenue per Visit (NRV) is the most critical KPI. It directly measures profitability after accounting for payer discounts, denials, and bad debt. A clinic with high volume but low NRV (e.g., $150) is less profitable than one with moderate volume but high NRV ($220). Tracking NRV by payer class helps identify contract performance issues.
How do I improve my denial rate?
Focus on the top three denial reasons: missing modifiers, incorrect diagnosis codes, and insurance eligibility issues. Use Athenahealth or Kareo to run weekly denial reports. Train front desk staff to verify insurance at check-in using Experity or Zocdoc. Implement a denial management workflow to rework claims within 15 days.
What is a good patient wait time for urgent care?
Under 15 minutes door-to-provider is the target. Above 20 minutes, walkout rates increase by 10-15%. Use Press Ganey to track wait times and Experity to adjust staffing in real-time. Reducing wait time by 5 minutes can improve patient satisfaction scores by 10 points.
How much should I spend on marketing?
Spend 5% of net revenue on marketing. For a $1M clinic, that's $50,000/year. Allocate 60% to Google Ads, 20% to local SEO, and 20% to community events. Underinvesting in marketing (less than 3%) leads to declining volume, as urgent care is a local business.
What is the average AR days for urgent care?
Under 30 days is best-in-class. 30-40 days is average. Above 45 days indicates billing issues. Use Kareo or Raintree to track AR and follow up on claims older than 30 days. Urgent care should collect faster than hospitals because most claims are straightforward.
How do I calculate net revenue per visit?
Divide total net collections (after payer discounts, denials, and bad debt) by total visits. Example: $9M net collections / 45,000 visits = $200 NRV. Track NRV by payer class (commercial, Medicare, Medicaid, self-pay) to identify underperforming contracts.
What tools do urgent cares use for KPI tracking?
Common tools include Experity for scheduling and volume, Athenahealth for EHR and billing, Kareo for billing and denial management, Raintree Systems for revenue cycle, Press Ganey for patient satisfaction, and Tableau for dashboards. These tools provide real-time data to monitor KPIs.
How often should I review KPIs?
Review volume and wait time daily. Review NRV, denial rate, and visits per provider weekly. Review AR and overhead monthly. Review payer mix and contract renegotiation quarterly. Create a weekly dashboard in Tableau or Power BI to review with clinic managers every Monday.
FAQ
What is the most important urgent care KPI?
Net Revenue per Visit (NRV) is the most important KPI. It captures both volume and collection efficiency. A clinic with high volume but low NRV (e.g., $150) is less profitable than one with moderate volume but high NRV ($220). Tracking NRV by payer class helps identify contract performance issues.
How do I improve my denial rate?
Focus on the top three denial reasons: missing modifiers, incorrect diagnosis codes, and insurance eligibility issues. Use Athenahealth or Kareo to run weekly denial reports. Train front desk staff to verify insurance at check-in using Experity or Zocdoc. Implement a denial management workflow to rework claims within 15 days.
What is a good patient wait time for urgent care?
Under 15 minutes door-to-provider is the target. Above 20 minutes, walkout rates increase by 10-15%. Use Press Ganey to track wait times and Experity to adjust staffing in real-time. Reducing wait time by 5 minutes can improve patient satisfaction scores by 10 points.
How much should I spend on marketing?
Spend 5% of net revenue on marketing. For a $1M clinic, that's $50,000/year. Allocate 60% to Google Ads, 20% to local SEO, and 20% to community events. Underinvesting in marketing (less than 3%) leads to declining volume, as urgent care is a local business.
What is the average AR days for urgent care?
Under 30 days is best-in-class. 30-40 days is average. Above 45 days indicates billing issues. Use Kareo or Raintree to track AR and follow up on claims older than 30 days. Urgent care should collect faster than hospitals because most claims are straightforward.
How do I calculate net revenue per visit?
Divide total net collections (after payer discounts, denials, and bad debt) by total visits. Example: $9M net collections / 45,000 visits = $200 NRV. Track NRV by payer class (commercial, Medicare, Medicaid, self-pay) to identify underperforming contracts.
What tools do urgent cares use for KPI tracking?
Common tools include Experity for scheduling and volume, Athenahealth for EHR and billing, Kareo for billing and denial management, Raintree Systems for revenue cycle, Press Ganey for patient satisfaction, and Tableau for dashboards. These tools provide real-time data to monitor KPIs.
How often should I review KPIs?
Review volume and wait time daily. Review NRV, denial rate, and visits per provider weekly. Review AR and overhead monthly. Review payer mix and contract renegotiation quarterly. Create a weekly dashboard in Tableau or Power BI to review with clinic managers every Monday.
What is the biggest revenue leak in urgent care?
Ignoring payer contract renegotiation is the #1 revenue leak. Most urgent cares sign initial contracts and never renegotiate. A 5% increase in commercial reimbursement (e.g., from $200 to $210 per visit) adds $90,000 to a 45,000-visit clinic. Renegotiate annually.
How can I reduce overhead as a percentage of revenue?
Target overhead under 30% of net revenue. Review non-essential subscriptions and redundant software. Use workforce optimization tools like Kronos or Shiftboard to match staffing to demand. MedExpress targets 25% overhead. Above 35% indicates inefficiency.
Sources
- https://www.urgentcareassociation.org/benchmarking
- https://www.optum.com/business/medexpress.html
- https://www.gohealthuc.com/patient-experience
- https://www.athenahealth.com/solutions/urgent-care
- https://www.kareo.com/urgent-care-billing
- https://www.experityhealth.com/urgent-care-software
- https://www.raintreeinc.com/urgent-care
- https://www.pressganey.com/patient-experience/urgent-care
- https://www.urgentcareassociation.org/denial-rate
- https://www.hcahealthcare.com/urgent-care
Related on PULSE
This page will be disappearing soon. Save it to your device for $1 — or read it free while it is here.
@Kory-White- · if Venmo asks, the last 4 of my number are 2012
This page is gone.
This one is off the shelf now. $1 keeps it on your phone for good — the whole page, pictures and diagrams included.
 pulse-industry-kpisTop 10 Cruise Line Revenue KPIs in 2027
 pulse-industry-kpisRevenue per Brewery Barrel: Craft Beer Production and Wholesale Pricing in 2027
 pulse-industry-kpisYield Per Acre as a Core KPI for Precision Agriculture Companies in 2027
 pulse-industry-kpisLoan-to-Deposit Ratio as a Liquidity and Revenue Metric for Credit Unions in 2027
 pulse-industry-kpisTop 10 Dental Practice Revenue KPIs in 2027
 pulse-industry-kpisAverage Revenue Per User in SaaS: Monthly Recurring Revenue vs. Annual Contract Value in 2027
 pulse-industry-kpisTop 10 Banking Return on Assets and Net Interest Margin KPIs in 2027
 pulse-industry-kpisTop 10 RIA Wealth Management Revenue KPIs in 2027
 pulse-industry-kpisTop 10 Dialysis Center Revenue KPIs in 2027
 pulse-industry-kpisTop 10 Banking Net Interest Margin Revenue KPIs in 2027