


How do you calculate fuel cost per block hour for a low-cost carrier in 2027?
Quality
Certified
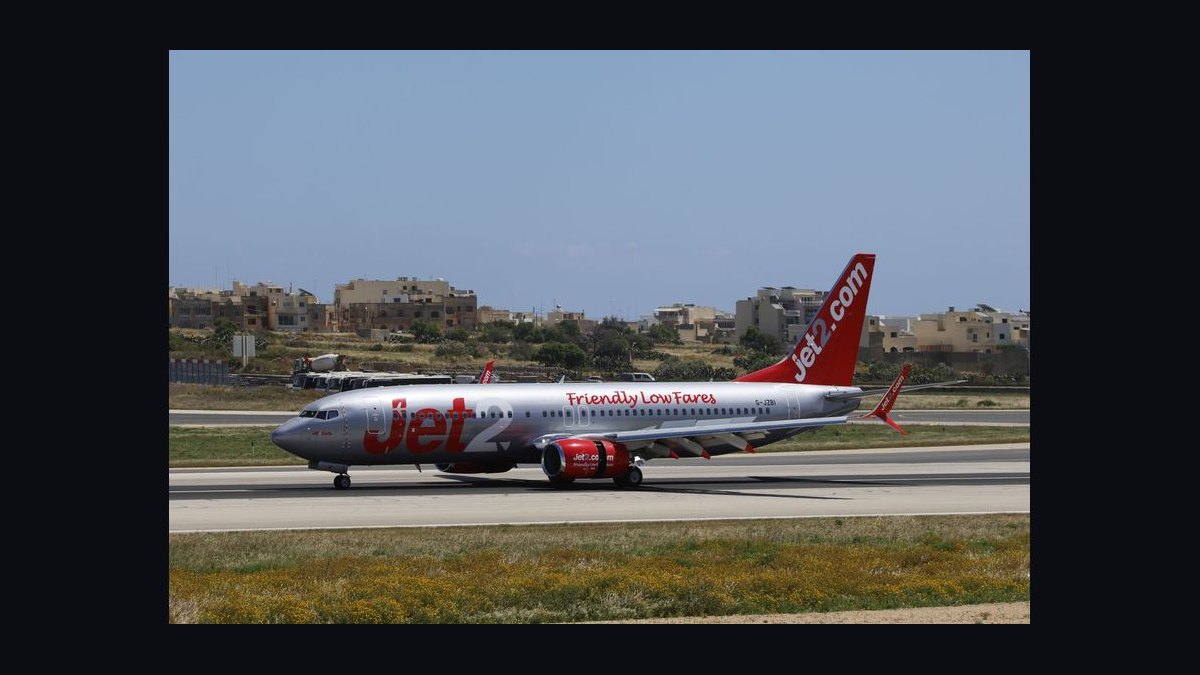
To calculate fuel cost per block hour for a low-cost carrier in 2027, divide total flight fuel cost by total actual block hours for the same fleet and period. Equivalently, multiply gallons burned per block hour by the all-in delivered price per gallon, including into-plane fees, taxes, and hedge settlements. A narrowbody typically burns 600–850 gallons per block hour.
The outcome you should expect
When you calculate this correctly, you should end up with a single number — dollars of fuel per block hour — that sits somewhere in the $1,700 to $2,800 range for a narrowbody low-cost carrier, depending on aircraft type, stage length, and the jet fuel price environment in the period you are measuring. That range is not a target you steer toward; it is a sanity band. If your answer lands at $900 or $4,500, you almost certainly have a denominator problem, a fleet-mix problem, or a fuel-invoice scope problem, and you should stop and audit before you publish the metric to anyone.
The reason the number matters more to a low-cost carrier than to a legacy network carrier is structural. A legacy carrier can dilute fuel exposure across premium cabins, cargo, loyalty program revenue, and corporate contracts that reprice. A low-cost carrier sells a commodity seat at a price the market sets, so its margin is essentially the spread between average fare plus ancillary revenue and its cost per available seat mile. Fuel is typically the single largest line item inside that cost structure, competing with labor for the top spot depending on the fuel price environment. When crude moves, the low-cost carrier feels it in the P&L within one fuel-purchase cycle, and there is very little revenue-side shock absorber.
Block hour is the correct denominator because it is the unit that airline operations actually schedules, staffs, and pays against. Block time runs gate-to-gate: from the moment the aircraft pushes back and the parking brake releases at the origin gate, to the moment it sets the brake at the destination gate. It includes taxi-out, takeoff, climb, cruise, descent, approach, landing, and taxi-in. It does not include time at the gate between flights. Flight hours — wheels-up to wheels-down — are a different and smaller number, and mixing block hours into a numerator built on flight-hour fuel burn is the most common way this calculation goes wrong.

The practical output of the exercise is three numbers, not one. You want fuel dollars per block hour, gallons per block hour, and the effective delivered price per gallon you paid. The first is the headline. The second isolates operational efficiency, which you control. The third isolates market and procurement, which you mostly do not control but can partially hedge. Reporting only the headline dollar figure makes it impossible to tell whether a bad month was a bad market or a bad operation, and that ambiguity is exactly what kills accountability inside a fuel program.
Expect the number to be seasonal. Winter operations in northern hubs add deicing-related ground time and longer taxi queues, inflating block hours faster than they inflate fuel burn in some cases and slower in others. Summer heat reduces engine efficiency and raises required thrust settings on departure. A carrier that reports a single annual figure and treats it as a constant will consistently misforecast quarterly. Build the metric monthly at minimum, and weekly if your operations control center is mature enough to act on it.
What drives that outcome
Two independent variables multiply together to produce the result: gallons consumed per block hour, and dollars paid per gallon. Everything that moves the metric moves one of those two, and confusing which lever you are pulling is the single most common analytical error inside airline finance teams.

On the consumption side, the dominant driver is stage length. A low-cost carrier flying 500-mile hops burns proportionally more fuel per block hour than one flying 1,400-mile segments, because takeoff and initial climb are the most fuel-intensive phases of any flight and short segments amortize that burn across fewer block hours. Climb to cruise altitude can consume a disproportionate share of a short flight's total fuel while representing a much smaller share of its block time. Lengthen the average segment and the metric falls even if nothing about the aircraft or the crew changed. This is why comparing your fuel cost per block hour to a competitor with a materially different route network is close to meaningless without normalizing for stage length.
Aircraft type is the second consumption driver. Current-generation narrowbodies with newer engine technology burn meaningfully less fuel per hour than the prior generation of the same airframe family. If your fleet is mid-transition — part old generation, part new — your blended number will drift downward month over month purely from delivery timing, and you must decompose fleet mix out of the trend before you claim an efficiency win. Report by subfleet as well as blended, always.
Weight is the third. Every additional pound carried costs fuel to lift and hold. This is why fuel programs obsess over potable water loading, unnecessary catering, excess contingency fuel, cabin equipment, and even the weight of seat-back hardware. Carrying extra fuel that you do not burn — tankering — is only economic when the price differential between stations exceeds the cost of burning fuel to carry fuel, and that calculation needs to be run per-route with live prices, not set as a standing policy.
Operational discipline covers the rest: single-engine taxi where the aircraft type and conditions permit, cost-index optimization on the flight plan, reduced-thrust takeoffs where runway length allows, auxiliary power unit discipline at the gate with ground power used wherever available, and route optimization against actual winds rather than filed defaults. Individually each of these is a small percentage. Compounded across a full network for a full year, a disciplined fuel program can move consumption a few percentage points, and a few percent of the largest cost line is a material number.

On the price side, the delivered cost per gallon is never just the posted jet fuel index. It is the index price plus the refining margin embedded in the jet fuel product, plus differentials for the specific delivery location, plus into-plane fees charged by the fueling agent at each station, plus throughput and infrastructure fees at the airport, plus applicable federal, state, and local taxes, plus any environmental or emissions-related charges that apply in the jurisdiction. Then you apply hedge gains or losses if the carrier runs a hedging program. A carrier that builds the metric off spot index alone will systematically understate its true cost by a meaningful margin, and the gap is not constant across stations.
Station mix therefore matters as a price driver. A network that concentrates uplift at a few high-throughput stations with negotiated volume pricing will pay less per gallon than a network that spreads thin across many stations with no leverage. This is one of the underappreciated advantages of the point-to-point-but-concentrated model many low-cost carriers run: it produces fuel purchasing leverage as a byproduct of network design.
Benchmarks and realistic ranges
Start with consumption benchmarks, because they are the more stable of the two inputs. A current-generation single-aisle narrowbody in typical low-cost carrier configuration burns in the neighborhood of 600 to 750 gallons per block hour. The prior generation of comparable airframes runs higher, commonly in the 750 to 900 gallon range depending on variant, engine, and typical operating weight. Larger, higher-density variants of the same families sit at the upper end because they carry more passengers and more weight, though their per-seat efficiency is better, which is precisely why low-cost carriers favor them.

Those bands are wide on purpose. Your actual figure depends on your specific engine variant, your winglet or sharklet configuration, your typical takeoff weight given your seating density and load factor, and your average segment length. Do not adopt a published industry number as your own. Derive yours from your own fuel uplift records and your own block hour records, then compare the derived number to the band as a reasonableness check.
On price, the realistic approach is to build the number as a stack rather than to guess a single figure. The jet fuel spot price is the base. The crack spread — the refining margin between crude and jet fuel — sits on top and has historically been volatile independent of crude, sometimes moving several times its normal range during refinery outages or demand shocks. Into-plane fees are typically a small per-gallon charge, cents rather than dollars, but they vary substantially by station and by fueling agent contract. Taxes vary by jurisdiction and by whether the flight is domestic or international. Sum the stack and you have your delivered price.
Multiply the two and the arithmetic is straightforward. Seven hundred gallons per block hour at a delivered price of $2.60 per gallon gives $1,820 per block hour. The same aircraft at $3.40 delivered gives $2,380. That $560 swing on a single aircraft flying roughly 3,000 block hours in a year is over $1.6 million of annual cost per aircraft, from price alone, with zero change in how the airline operates. Scale that across a fleet of a hundred aircraft and you have the reason airline CFOs care about fuel procurement as much as they care about revenue management.
For a cross-check, convert to fuel cost per available seat mile and compare against your total unit cost. Fuel commonly represents a substantial share of a low-cost carrier's operating cost — the exact percentage swings dramatically with the fuel price environment, running lower when crude is cheap and climbing toward or past the labor line when crude spikes. If your derived fuel share of total cost lands far outside what your own historical range has been, recheck the calculation rather than accepting the result.

Another useful cross-check is fuel cost per departure. Divide total fuel spend by total departures and compare the ratio of that number to your fuel-per-block-hour number. That ratio should approximate your average block time per departure. If it does not, one of your two denominators is contaminated — usually block hours, which are frequently pulled from a scheduling system that reports scheduled block rather than actual block. Scheduled block and actual block diverge, sometimes by a material margin during irregular operations, and using scheduled block in the denominator while using actual uplift in the numerator produces a metric that is quietly wrong in both directions depending on the month.
Establish an internal band and defend it. Most mature carriers know their expected gallons per block hour by subfleet to within a couple percent and treat deviations outside that band as an operational signal worth investigating — a maintenance issue, a route mix shift, a weight creep problem, or a data error. That band is worth more than any external benchmark, because it is measured on your own aircraft flying your own network.
Risks, edge cases, and failure modes
The denominator is where most of the damage happens. Block hours, flight hours, and scheduled block hours are three different numbers, and every airline system reports at least two of them. Fuel uplift is recorded by fueling event, not by flight, so the numerator is naturally organized around aircraft-and-station while the denominator is organized around flights. Reconciling those two into the same period, for the same fleet, requires deliberate work. Pull block hours from the same operational system of record that the flight operations team uses for crew pay and aircraft utilization, and document which field you used.

Uplift versus burn is the second trap. Fuel uplifted at a station is not fuel burned on the next flight. Aircraft depart with fuel remaining from prior segments, tanker fuel between stations, and carry mandatory reserves that land unburned. Over a long enough period — a full month across a full fleet — uplift and burn converge closely, because the fuel in the tanks at period start and period end roughly cancels. Over a week, or on a single tail, they can diverge substantially. If you need weekly or per-tail precision, you must adjust for tank inventory at period boundaries, which means capturing fuel-on-board readings at the start and end of the window.
Hedging accounting is the third trap and the one most likely to make the metric misleading rather than merely imprecise. If your carrier hedges, the cash paid at the pump and the effective economic cost after hedge settlement differ. Report both. A page that shows only pre-hedge fuel cost per block hour during a period of rising prices makes the operation look worse than the economics actually were, and a page that shows only post-hedge cost during a falling market hides the fact that the hedge is costing money. The two-line presentation is standard practice for a reason.
Fleet-mix contamination is a chronic problem during transitions. A carrier taking delivery of new-generation aircraft while retiring older ones will see its blended gallons-per-block-hour decline steadily, and it is tempting for the fuel program to claim credit. Decompose it. Compute the metric per subfleet, hold subfleet mix constant at a base-period weighting, and report the mix effect separately from the same-fleet efficiency effect. Without that decomposition you cannot tell whether your fuel initiatives are working.
Irregular operations distort everything. A week of severe weather adds diversions, holding, extended taxi times, and cancelled flights. Cancellations remove block hours from the denominator while some fuel costs — APU running, repositioning flights, ferry legs — remain in the numerator. Diversions add both, but not proportionally. A single bad operational week can move a monthly figure noticeably. Flag irregular-operations periods explicitly rather than letting them silently contaminate a trend line.

Currency exposure applies to any carrier fueling outside its reporting currency. Jet fuel is priced in dollars globally, so a carrier reporting in another currency carries both a commodity exposure and an FX exposure, and the two can partially offset or compound. Decide whether your metric is reported at spot FX, at a budgeted rate, or at hedged rate, and be consistent.
Finally, watch for scope drift in the numerator. Ground support equipment fuel, ground vehicle fuel, and fuel for maintenance engine runs are all real costs but are not flight fuel. If they land in the same general ledger account and nobody separates them, your fuel cost per block hour is inflated by costs that have nothing to do with flying. Define the account scope in writing and reconcile it at least quarterly.
A practical rollout plan
Build this as a repeatable pipeline, not a spreadsheet exercise someone redoes each month. The first step is defining scope in a written document that finance and flight operations both sign: which general ledger accounts count as flight fuel, which operational system supplies actual block hours, which fleet groupings you will report, whether the reporting period is calendar month or accounting period, and whether the headline figure is pre-hedge or post-hedge.
Then wire the data. Fuel invoices from suppliers and into-plane agents, reconciled against fueling tickets from stations. Block hours from the operations system, using actual out-off-on-in times rather than schedule. Fleet assignment by tail number so subfleet decomposition is possible. Hedge settlements from treasury. All four sources keyed to the same period definition and the same tail-number list.
Run the first calculation on a closed historical period where you already know the total fuel spend from audited financials. If your bottoms-up build does not tie to the audited number within a small tolerance, you have a scope problem, and finding it on a historical period is far cheaper than finding it on a live one. This tie-out step is the one most teams skip and the one that most often saves the project.

Once it ties, publish three views on a fixed cadence. The blended headline for executive reporting. The subfleet breakdown for the fuel program and flight operations. The price-versus-efficiency decomposition for the CFO, showing explicitly how much of the month-over-month change came from market price movement, how much from operational efficiency, and how much from fleet mix. That third view is what turns the number from a scorecard into a management tool.
Assign a named owner to each component. Procurement owns delivered price per gallon and is measured against index plus a negotiated differential, not against absolute price, because absolute price is not theirs to control. Flight operations owns gallons per block hour by subfleet, normalized for stage length. Network planning owns stage length and station mix. Treasury owns hedge performance. When one number has four owners, nobody owns it; when the number is decomposed and each piece has one owner, variance reviews become productive rather than defensive.
Finally, automate the refresh and set alert thresholds. If gallons per block hour on any subfleet moves outside its established band for two consecutive weeks, someone should get a notification, because that pattern usually indicates a real operational or maintenance issue rather than noise. The point of building the metric is not to have the number. It is to shorten the time between something going wrong and somebody noticing.
Related questions
What is the difference between block hours and flight hours?
Block hours measure gate-to-gate time, from brake release at pushback to brake set at arrival, including taxi. Flight hours measure wheels-up to wheels-down. Block hours are always larger. Airline scheduling, crew pay, and aircraft utilization all use block hours, which is why cost metrics normalize to them.
Should I use uplift or burn in the numerator?
Over a full month across a full fleet, uplift approximates burn closely enough because start-and-end tank inventory largely cancels. For weekly or per-tail analysis, adjust for fuel-on-board at period boundaries, or the tankering and reserve effects will distort the result meaningfully.
How do I compare my number to a competitor's?

Normalize for stage length and fleet generation first, or the comparison is noise. A competitor with longer average segments will always show a lower fuel cost per block hour regardless of operating discipline. Compare gallons per block hour by comparable subfleet at comparable stage length instead.
Does hedging change the calculation itself?
No — it changes which price you use. Compute the metric twice: once at cash delivered price, once after applying hedge settlements. Report both lines. The pre-hedge line measures procurement and operations; the gap between the two lines measures the hedge program.
Why does the metric move when nothing operational changed?
Usually price, fleet mix, or stage length. Market price moves independently of anything you control. New aircraft deliveries shift blended burn. Schedule changes shift average segment length. Decompose the variance into those three effects before investigating operations.
FAQ
What formula do I actually use?
Total flight fuel cost for the period divided by total actual block hours for the same fleet and period. Equivalently, gallons burned per block hour multiplied by all-in delivered price per gallon. The second form is preferable because it separates the operational variable from the market variable, letting you attribute changes correctly instead of reporting a single blended figure nobody can act on.
What counts as "all-in" delivered price?

Jet fuel product cost including the refining crack spread, plus location differentials, plus into-plane and throughput fees charged at the station, plus applicable federal, state, local, and environmental taxes. Then optionally apply hedge settlements for the economic view. Using only the posted spot index systematically understates true cost, and the understatement varies by station.
How often should a low-cost carrier calculate this metric?
Monthly at minimum, aligned to the accounting close, so it ties to audited financials. Weekly is better for operational management if your data pipeline supports it, with the caveat that weekly figures need tank-inventory adjustment to avoid uplift-versus-burn distortion. Daily is generally noise unless you are running a specific short-term experiment.
Why is fuel cost per block hour more important to a low-cost carrier than to a legacy carrier?
A legacy network carrier spreads fuel exposure across premium cabins, cargo, loyalty revenue, and repricing corporate contracts. A low-cost carrier sells a commodity seat at market price with thin margins, so fuel — typically its largest or second-largest cost line — flows almost directly to the bottom line when prices move.
What is a realistic gallons-per-block-hour figure for a narrowbody?
Current-generation single-aisle aircraft commonly land in the 600 to 750 gallon range per block hour; prior-generation equivalents run higher. The actual figure depends on engine variant, winglet configuration, seating density, typical takeoff weight, and average stage length. Derive yours from your own records rather than adopting a published band.
What is the single most common mistake in this calculation?
Mismatching numerator and denominator scope. Using scheduled block hours with actual fuel uplift, mixing flight hours into a block-hour denominator, or letting ground support equipment fuel sit in the flight fuel account. Tie your bottoms-up build to audited total fuel spend on a closed historical period before trusting any live number.
Sources
- https://www.iata.org/en/publications/economics/fuel-monitor/
- https://www.eia.gov/dnav/pet/pet_pri_spt_s1_d.htm
- https://www.transtats.bts.gov/fuel.asp
- https://www.faa.gov/data_research/aviation_data_statistics
- https://www.icao.int/environmental-protection/Pages/fuel-efficiency.aspx
- https://www.eurocontrol.int/publication/eurocontrol-fuel-efficiency-and-flight-operations
- https://www.iata.org/en/programs/environment/fuel-efficiency/
- https://www.bts.gov/topics/airlines-and-airports
Related on PULSE
- How do you model cost per available seat mile for a narrowbody fleet?
- What drives unit cost differences between low-cost and legacy carriers?
- How do you build a fuel hedging policy without over-hedging?
- How do you measure aircraft utilization in block hours per day?
- What is the right way to attribute cost variance to price versus efficiency?
- How do you normalize airline cost benchmarks for stage length?
This page will be disappearing soon. Save it to your device for $1 — or read it free while it is here.
@Kory-White- · if Venmo asks, the last 4 of my number are 2012
This page is gone.
This one is off the shelf now. $1 keeps it on your phone for good — the whole page, pictures and diagrams included.
 pulse-industry-kpisTop 10 Sales KPIs for Commercial Solar Carport Construction in 2027
 pulse-industry-kpisTop 10 Healthcare Revenue Cycle Management Benchmarks in 2027
 pulse-industry-kpisTop 10 Sales KPIs for Industrial X-Ray & Non-Destructive Testing (NDT) Services in 2027
 pulse-industry-kpisTop 10 Sales KPIs for Industrial Heat Treating & Metal Finishing Services in 2027
 pulse-industry-kpisHotel Management: RevPAR vs. TRevPAR — Which Metric Drives Profitability Decisions in 2027?
 ikTop 10 Restaurant Revenue Per Table Turnover Benchmarks in 2027
 pulse-industry-kpisTop 10 Sales KPIs for Architectural Door & Hardware Distribution in 2027
 pulse-industry-kpisTop 10 Higher-Ed Advancement Revenue KPIs in 2027
 pulse-industry-kpisTop 10 Airline Revenue per Available Seat Mile and Load Factor Metrics in 2027
 pulse-industry-kpisTop 10 Sales KPIs for Commercial Medical Device Sales in 2027