


What is the average cost per passenger for airport ground handling services in 2027?
Quality
Certified

Airport ground handling in 2027 typically costs roughly $8 to $18 per departing passenger at mainline airports, with low-cost carriers at efficient bases landing near $5 to $9 and complex hub or long-haul turns exceeding $25. The figure varies more by aircraft size, turn time, and scope than by geography alone.
A regional carrier walks into a cost review
The number in the headline question hides a definitional trap, and the trap is where most cost reviews go wrong. Picture a regional carrier operating 62 daily departures across eleven stations, all of them handled under third-party contracts. Finance pulls the total ground handling spend for the trailing twelve months, divides it by enplaned passengers, and gets $11.40. That single figure gets reported to the board as the airline's ground handling cost per passenger. It is arithmetically correct and analytically close to useless, because it blends four things that behave completely differently.
The first component is the turnaround fee itself — the bundled per-turn charge covering ramp handling, baggage loading and unloading, marshalling, pushback, and cabin readiness. This is priced per aircraft movement, not per passenger, which means the per-passenger figure moves inversely with load factor. Fill an Embraer 175 to 88 percent instead of 72 percent and the same $420 turn fee drops from $5.83 to $4.77 per passenger without a single negotiation, a single process change, or a single dollar of savings. Nothing improved. The denominator moved.
The second component is passenger services — check-in agents, gate agents, boarding, special assistance coordination, and lost baggage desks. This one genuinely scales with passenger count, though in a step function rather than a smooth line. You do not hire 0.3 of an agent. A station staffs to peak-hour departures, so the marginal passenger in an off-peak bank costs essentially nothing while the marginal passenger that pushes a bank past a staffing threshold costs a full shift.

The third is de-icing, which in this carrier's northern stations concentrates 70 percent of its annual cost into roughly 40 operating days. Averaged across the year it looks like $1.10 per passenger. In February at one particular station it is $9 per passenger. The annual average is a real number that describes no actual month.
The fourth is what the contract calls "additional services" and what operations calls "everything that goes wrong" — extra ground power because the APU is deferred, water and lavatory service outside the standard turn, additional headcount for a delayed inbound, wheelchair volumes above the contracted ratio, and cargo handling billed separately. At this carrier these ran 14 percent of total spend and were almost entirely invisible in the budget because they arrived as line items on monthly invoices rather than as a rate in the contract.
The useful exercise is not computing one average. It is decomposing the average into a per-turn fixed block, a genuinely per-passenger variable block, a seasonal block, and an exception block — then benchmarking each one against something comparable. A carrier that does this typically discovers its real negotiating leverage sits in the exception block, which nobody priced, rather than in the headline turn rate everybody argued about.
How the mechanism actually works
Ground handling pricing is built from the aircraft outward, not from the passenger inward. Understanding that inversion explains nearly every counterintuitive result in the data.

A handler prices a station by first estimating the equipment and labor it must have standing by. A narrowbody turn at a mainline station requires, at minimum, a pushback tractor, a belt loader or two, a ground power unit or access to fixed power, an air start if the aircraft needs it, baggage tugs and carts, and a crew of typically four to eight ramp agents depending on turn time and bag volume. Whether the aircraft carries 90 passengers or 180, that equipment set is nearly identical. Baggage volume scales, so loading time scales, but the crew size is driven by the turn clock — a 25-minute turn requires more simultaneous bodies than a 50-minute turn moving the same bags.
This is why per-passenger cost falls so sharply with gauge. The same crew that turns an A320 with 150 seats turns an A321neo with 230 seats using perhaps one additional loader. The per-turn cost rises maybe 12 percent while capacity rises 53 percent. Fleet up-gauging has quietly been one of the largest ground handling cost-per-passenger reduction levers of the last decade, and it required no negotiation at all.
The contract structure then layers on top. Three shapes dominate. A per-turn flat rate is the most common for narrowbody scheduled service: one price covers a defined scope within a defined turn window, with everything outside that scope billed separately. A cost-plus or open-book model appears at stations where a carrier has enough volume to effectively fund a dedicated team; the carrier sees the labor cost stack and pays a management fee, typically 6 to 12 percent. A self-handling model means the carrier employs its own ramp staff, which usually only pencils above roughly 15 to 25 daily departures at a station, below which equipment capital and management overhead swamp the labor savings.
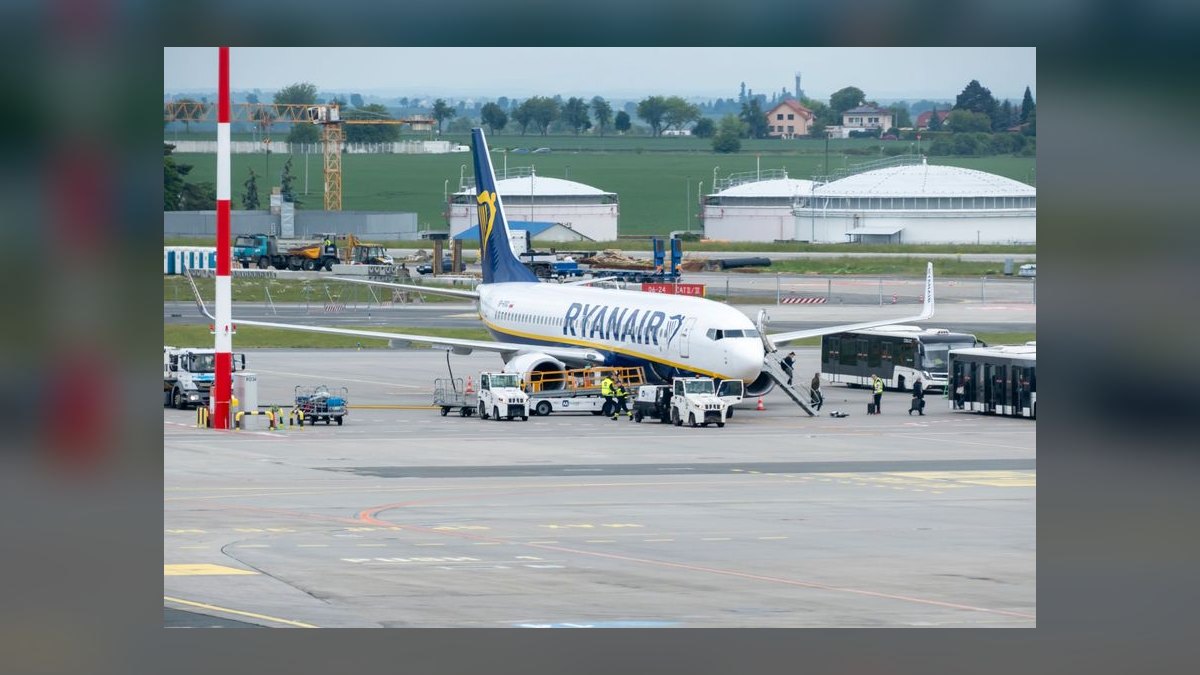
The per-passenger figure emerges as an output of all of this rather than an input to any of it. Which means when someone asks what ground handling "should" cost per passenger, the honest answer requires knowing the aircraft type, the turn time, the daily frequency, the local labor market, the scope boundary, and the load factor. Change any one and the number moves by a wide margin.
The diagram makes the core problem visible: two of the three inputs feeding the final division — load factor and gauge — are commercial decisions with no relationship to handling efficiency. A ground handling cost-per-passenger metric that moves because the network team added seats is measuring the network team, not the handling operation.
Real numbers, ranges, and benchmarks
Working from the structure above, here is how the ranges actually distribute. These are directional bands for planning, not quoted rates, and any specific station can sit outside them for defensible reasons.
By aircraft category, per turn. Regional jets in the 70 to 90 seat class typically carry turn rates in the $250 to $500 range at mainline stations. Narrowbodies from the A320 and 737 families run roughly $500 to $1,100 for a standard scope turn. Widebodies handling international operations frequently exceed $2,500 and can reach $6,000 or more at congested hubs with long turn windows, multiple loading positions, and full cabin service. Divide by realistic loads and the regional jet lands near $4 to $7 per passenger, the narrowbody near $4 to $8, and the widebody often near $8 to $20 depending on whether the turn is a quick transit or a full overnight service.
By carrier model. An ultra-low-cost carrier operating a single fleet type, 25-minute turns, minimal checked bag volume, self-service check-in, and a concentrated base can drive all-in ground handling toward $5 to $9 per departing passenger. A full-service network carrier at a connecting hub, with bag transfer volumes, interline handling, premium cabin service, and higher special-assistance ratios, commonly runs $12 to $22. The gap is mostly scope and complexity, not vendor pricing.

By geography. Labor cost dominates, and labor is local. Handling in high-wage Western European and North American markets sits at the upper end of every band above. Stations in lower-wage markets can price 40 to 60 percent below equivalent Western European stations for identical scope, though equipment availability and reliability sometimes offset the savings through delay costs. Highly regulated or single-handler airports — where competition is limited by concession — routinely price above open markets regardless of local wages.
Cost composition. A reasonable decomposition of total ground handling spend at a typical mainline station: ramp and baggage handling 45 to 55 percent, passenger services 20 to 30 percent, de-icing 0 to 15 percent depending on climate, and out-of-scope or additional services 8 to 18 percent. That last band is the one most carriers underestimate. If your budget assumed 5 percent and actuals run 15 percent, you have found a 10-point variance that looks like a rate problem and is actually a scope problem.
Direction of travel into 2027. Two forces pull in opposite directions. Labor cost inflation and persistent ramp staffing shortages in developed markets have pushed handler rates up through the mid-2020s, with escalators in multi-year contracts commonly indexed to local wage measures rather than general inflation. Pulling the other way: continued fleet up-gauging, higher structural load factors, electrification of ground support equipment reducing fuel and maintenance cost, and automation in check-in and bag drop reducing passenger services headcount. The net for a carrier that does nothing is usually a modest real increase. The net for a carrier actively up-gauging and automating can be flat or down in per-passenger terms even as its per-turn rates rise.
A sanity-check calculation. Take a station with 20 daily narrowbody departures, an $800 average turn rate, 165 average passengers per departure, and out-of-scope running 12 percent of the base. Base spend is $16,000 daily, plus $1,920 out-of-scope, on 3,300 passengers — $5.43 per passenger for ramp scope. Add passenger services at roughly 25 percent of the ramp figure and you are near $6.80. Add a de-icing allocation of $0.90 annualized and the station benchmark lands near $7.70. If your actual is $13, the variance is real and worth a station-level audit. If it is $8.10, you are within noise and your effort belongs elsewhere.
Trade-offs and alternatives
Every lever that reduces this metric has a cost somewhere else on the P&L, and the discipline is in pricing the offset honestly rather than claiming the gross saving.
Self-handling versus third-party. Self-handling removes the handler's margin, typically 8 to 15 percent, and gives direct control over staffing quality and turn reliability. It also puts ground support equipment on your balance sheet, requires station management overhead, exposes you to local labor relations, and eliminates the flexibility to exit a station cheaply. The threshold where it pencils depends less on a departure count than on network stability: a station you are confident about for five years is a different case from one you might drop next schedule.
Single-source versus multi-vendor. Consolidating all stations with one global handler buys volume pricing, one contract to manage, and consistent service standards. It also concentrates risk — a handler insolvency or a labor action becomes a network event rather than a station event — and removes competitive tension at renewal. Multi-vendor costs more in management overhead and produces inconsistent service levels, but preserves the ability to move volume as leverage.
Rate reduction versus scope expansion. In a renegotiation you can push the turn rate down or pull additional services into the base scope. Pushing the rate down produces a visible win that finance can book. Pulling scope in often produces a larger real saving, because out-of-scope work is billed at unnegotiated rates with no volume discipline. A handler will frequently trade a wider scope for a modest rate increase — and that trade is usually favorable to the carrier if out-of-scope has been running above 10 percent.

Turn time versus handling cost. Compressing a turn from 40 to 30 minutes buys aircraft utilization, which is worth real money in fleet cost. It also requires more simultaneous ramp staff, raising the turn rate, and it reduces schedule buffer, raising delay risk. The aircraft utilization gain typically dominates for high-frequency short-haul operations and typically does not for long-haul, where the turn is a small fraction of the block time.
Automation versus service level. Automated bag drop and kiosk check-in reduce passenger services headcount meaningfully, often 20 to 35 percent of check-in labor at a station that fully adopts it. The offsets are capital cost, a slower transition than vendors project, and a service floor — you still need staffed positions for special assistance, irregular operations, and passengers the automation fails. Carriers that cut staffing to the automated-state assumption before adoption matured have reliably created their own irregular-operations disasters.
Common pitfalls and how to avoid them
Comparing your number to someone else's without normalizing scope. This is the dominant failure. A published or peer-shared figure of $9 per passenger might exclude de-icing, exclude passenger services, exclude cargo, or count only departing passengers while yours counts enplaned and deplaned. Before any comparison, write down four things: which cost categories are in the numerator, whether the denominator is departing passengers or total passengers, whether it is all stations or a subset, and whether it includes out-of-scope billing. Two figures that differ by 2x frequently agree once normalized.
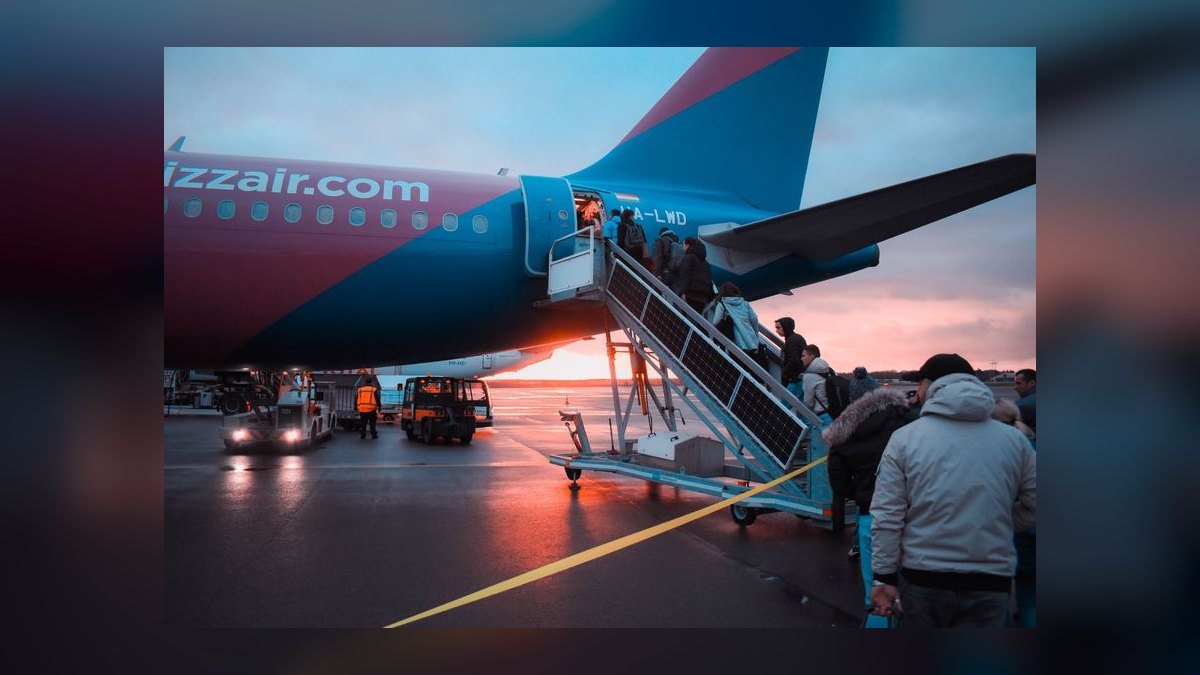
Using enplaned plus deplaned as the denominator. A turn serves both an arrival and a departure. If you divide station spend by all passengers touching the station, you roughly halve your number relative to a carrier dividing by departures. Neither is wrong, but they are not comparable. Departing passengers is the more common convention because it maps one-to-one with turns.
Treating the annual average as a planning number for any specific month. De-icing, peak-season staffing premiums, and holiday overtime concentrate cost into narrow windows. A station that averages $8 per passenger might run $6 in September and $14 in January. Budget monthly with a seasonal curve, not by dividing the annual figure by twelve.
Missing the delay cost that cheap handling causes. The lowest bid at a station sometimes wins because it is staffed to the median day rather than the peak. The resulting cost surfaces in departure delays, misconnected bags, and crew duty overruns — none of which land in the ground handling line. Track on-time departure performance and mishandled bag rate alongside the cost metric and evaluate the pair. A handler that is $1.20 per passenger cheaper and drives 3 additional delay minutes per departure is usually not cheaper.
Letting load factor flatter the number. As noted, a rising load factor lowers cost per passenger without any operational improvement. If you are reporting this metric to management, report cost per turn alongside it. Per-turn cost is what your handling decisions actually control; per-passenger is what those decisions plus commercial performance produce together. Showing both prevents the operations team from taking credit for the revenue team's work, and prevents them from taking blame when loads soften.
Auditing rates and never auditing invoices. The negotiated rate card is a fraction of the story. Systematic invoice audit — checking that billed turns match actual movements, that out-of-scope charges have documented authorization, that de-icing fluid volumes are plausible against aircraft type and conditions — commonly recovers 2 to 5 percent of spend at carriers that have never done it. This is unglamorous and it works.
Ignoring the special assistance ratio. Contracts typically assume a wheelchair and special assistance volume as a percentage of passengers. Actual volumes have trended upward across the industry, and when actuals exceed the contracted assumption the excess bills at a premium rate. Check your realized ratio against the contracted one annually; a drift of one percentage point can move a station's total meaningfully.
Building the metric without a station-level cut. A network average conceals everything. A carrier with a $10 average may have eight stations at $7 and two at $22, and all the recoverable money sits in the two. Always compute per-station and rank; the distribution is nearly always long-tailed, and the tail is the work list.
Related questions
Does cost per passenger or cost per turn matter more?
Cost per turn measures what the handling operation controls. Cost per passenger measures handling plus commercial performance. Use per-turn to manage handlers and negotiate contracts; use per-passenger for unit-cost reporting and network comparisons. Reporting only one invites misattributed credit and blame.
Why is my de-icing cost per passenger so volatile?
Because de-icing is weather-driven and concentrated into a small number of operating days. Annual averaging produces a figure that describes no real month. Budget it separately with a seasonal curve and a weather-severity assumption, and track fluid volume per event rather than cost per passenger.
At what point does self-handling beat contracting out?
Typically above roughly 15 to 25 daily departures at a station, and only where network presence is stable enough to amortize ground support equipment. Below that, equipment capital and station management overhead usually exceed the handler margin you are trying to eliminate.
How much of ground handling spend is usually out of scope?
At most carriers, 8 to 18 percent of total spend arrives as additional services billed outside the contracted turn rate. If your figure exceeds 10 percent, expanding contracted scope at renewal is generally a larger saving than pushing the base rate down.
Does aircraft up-gauging really lower cost per passenger?
Yes, substantially. The equipment set and most of the crew are driven by the turn, not the seat count. Moving from a 150-seat to a 230-seat narrowbody typically raises the turn rate by roughly a tenth while raising capacity by half, mechanically lowering the per-passenger figure.
FAQ
What is a reasonable planning figure for 2027 if I have no station data?
For a narrowbody short-haul operation at mainline stations in developed markets, $8 to $14 per departing passenger all-in is a defensible planning band. Adjust down toward $6 for a low-cost single-fleet operation with minimal bag volume and short turns; adjust up past $18 for connecting hub operations with heavy transfer bags and premium service. Treat any single number as a starting hypothesis to be replaced with station-level actuals within one budget cycle.
Should the denominator be departing passengers or total passengers?
Departing passengers, in most cases. A turn maps to one departure, so departing passengers keeps the ratio interpretable and makes it comparable across carriers using the same convention. Whichever you choose, state it explicitly every time you publish the number — the two conventions differ by roughly a factor of two, and undocumented denominators are the single most common source of nonsense in cross-carrier comparison.
What should be included in the numerator?
At minimum: ramp handling, baggage handling, passenger and gate services, and out-of-scope additional services. Whether to include de-icing, cargo handling, and aircraft cleaning depends on your reporting convention — include them, but break them out as separate lines so the metric can be reconstructed for comparison against peers who exclude them. Consistency across periods matters more than which convention you pick.
How often should this metric be reviewed?
Monthly at station level for variance detection, quarterly at network level for trend, and annually as a full contract and invoice audit. Monthly review catches invoice errors and out-of-scope drift while the evidence is still fresh. Annual review is where you renegotiate scope and rank stations for intervention. Weekly reporting on this particular measure produces noise, not signal.
Do airport-imposed fees belong in this number?
Generally no — keep airport charges, passenger service charges, and security fees in a separate airport-cost line. Ground handling should measure what you pay handlers for handling services. Mixing in airport fees makes the metric move with the airport's pricing decisions rather than yours, and makes benchmarking impossible because fee structures vary enormously by airport.
What is the fastest way to find recoverable savings?
Rank stations by cost per turn, not per passenger, and audit the top decile. Then audit twelve months of invoices at those stations against actual movement records and contracted scope. Between station-level outliers and invoice errors, this sequence typically surfaces the majority of the recoverable money before any renegotiation begins.
Sources
- IATA — Ground Handling
- IATA Airport Handling Manual (AHM) and IGOM
- Airports Council International
- ICAO — Air Transport Economic Analyses
- Airline Services Ground Handling Association (ASA)
- U.S. Bureau of Transportation Statistics — Air Carrier Financial Reports
- Eurocontrol — Aviation Data and Performance Review
- U.S. Bureau of Labor Statistics — Support Activities for Air Transportation
- FAA — Airport Compliance and Rates and Charges
Related on PULSE
- How do airlines calculate cost per available seat mile (CASM)?
- What drives aircraft turnaround time at hub versus point-to-point airports?
- How should airlines structure multi-station ground handling contracts?
- What is the real cost of a departure delay per minute?
- How do fleet up-gauging decisions change airline unit costs?
- What belongs in an airline's station-level operating cost audit?
This page will be disappearing soon. Save it to your device for $1 — or read it free while it is here.
@Kory-White- · if Venmo asks, the last 4 of my number are 2012
This page is gone.
This one is off the shelf now. $1 keeps it on your phone for good — the whole page, pictures and diagrams included.
 pulse-industry-kpisWhat are the key cost per available seat mile (CASM) benchmarks for airline operations in 2027?
 pulse-industry-kpisTop 10 Fast Food Chain Revenue KPIs in 2027
 pulse-industry-kpisTop 10 Sales KPIs for Oilfield Services in 2027
 pulse-industry-kpisTop 10 Sales KPIs for Commercial Kitchen Hood & Exhaust Cleaning Services in 2027
 pulse-industry-kpisTop 10 Sales KPIs for Industrial Cybersecurity (OT/ICS) Services in 2027
 pulse-industry-kpisTop 10 Sales KPIs for Architectural Terrazzo Flooring Installation in 2027
 pulse-industry-kpisTop 10 Management Consulting Revenue KPIs in 2027
 pulse-industry-kpisTop 10 KPIs for Pressure Washing Companies in 2027
 pulse-industry-kpisTop 10 Energy Production Cost per MWh and Revenue per Barrel Metrics in 2027
 pulse-industry-kpisTop 10 Sales KPIs for Commercial Medical Device Sales in 2027