


How do you benchmark cost per block hour for regional airline fleets in 2027?
Quality
Certified
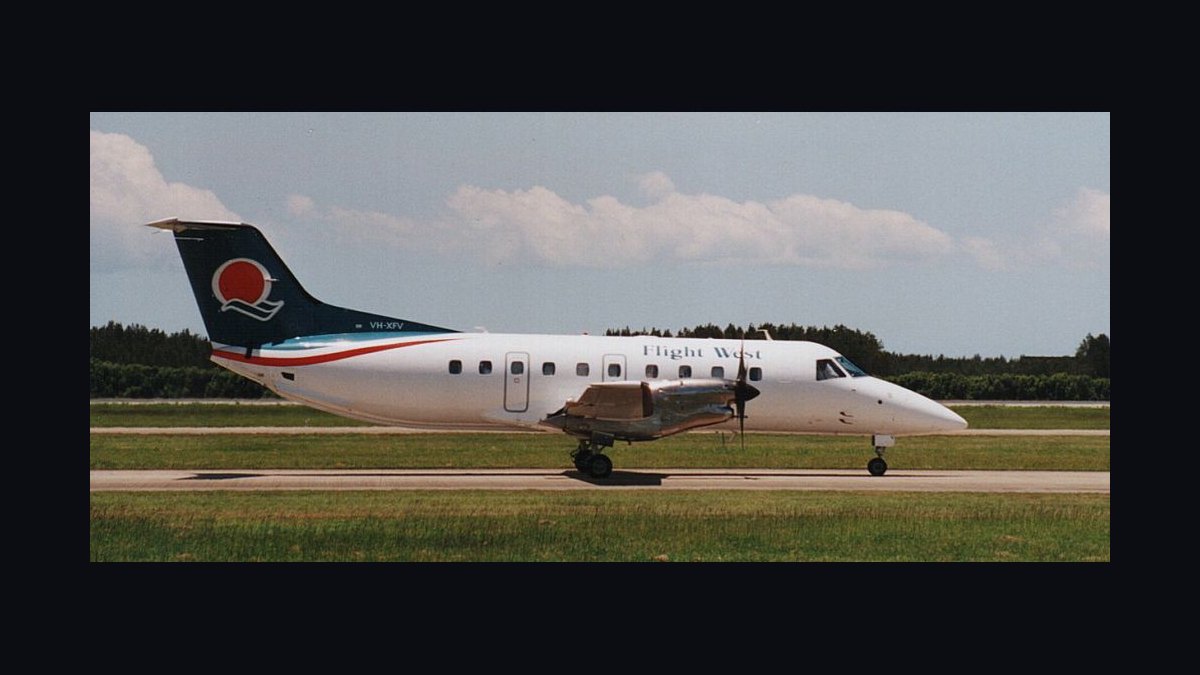
To benchmark cost per block hour for regional airline fleets in 2027, calculate each fleet type's direct operating cost divided by gate-to-gate block hours, then compare against DOT Form 41 and BTS peer data normalized for fuel price, stage length, fleet age, and utilization. Benchmark fleet type by fleet type, never blended, and report CPBH alongside CASM.
A regional finance team preparing a 2027 rate reset
Picture a 45-aircraft regional airline operating E175s and CRJ-900s under a capacity purchase agreement with a mainline partner. The VP of Finance is preparing the annual rate reset negotiation and must prove the carrier's cost per block hour is competitive, or explain precisely why it is not. The problem is that block hour cost is not a single number sitting in the general ledger. It is assembled from a dozen cost centers: direct maintenance, engine and APU reserves, crew pay and per diem, fuel burn, landing fees, deicing, hull and liability insurance, and aircraft ownership or lease expense. Each line carries its own accrual timing.
Block hours themselves get reported inconsistently. Some ACARS systems record gate-to-gate; others start the clock at pushback versus brake release. Before any external benchmark means anything, the finance team must reconcile its internal block hour count against a defensible standard, usually gate-out to gate-in, matching what mainline partners and the Department of Transportation expect. It must also reconcile cost data against a chart of accounts that maps cleanly to how peer carriers report theirs.
Then comes the 2027-specific problem. The carrier's last full external benchmark was built on 2022 and 2023 data. Since then, pilot wage scales have reset industry-wide, engine maintenance reserve rates have been repriced by OEMs and MRO providers, and insurance premiums have hardened. A 2027 benchmark built on a stale baseline will systematically misread whether the carrier's cost trajectory is in line with the regional segment or diverging from it. The finance team needs a repeatable method, not a one-off spreadsheet, because the same exercise will run again next quarter and the quarter after that.

The stakes are concrete. If the carrier's E175 cost per block hour sits 12% above the peer median and the gap is structural, the mainline partner will push rate concessions the carrier cannot absorb. If the gap is an artifact of a different block hour definition or an unadjusted fuel assumption, the carrier may concede margin it never needed to give away. The difference between those two outcomes is method discipline.
How the benchmarking mechanism actually works
The mechanical process runs in five stages, and skipping any of them is how carriers end up benchmarking noise instead of signal.
Stage one: cost aggregation. Pull direct operating cost data by fleet type from the general ledger: fuel and oil, flight crew wages and benefits, maintenance labor and parts, engine and APU reserves, aircraft rent or ownership depreciation, insurance, and landing and navigation fees. Indirect costs such as station overhead, corporate SG&A, and reservations are excluded from cost per block hour proper. Mixing them in is the single most common error, because it makes a carrier's figure look artificially high next to peers who report direct operating cost only.

Stage two: block hour normalization. Total the block hours for that fleet type over the measurement period using a consistent definition, brake-release to brake-set, matching FAA and BTS Schedule P-5.2 and T-100 conventions. A carrier measuring wheels-up to wheels-down will understate hours and overstate cost per block hour relative to a peer using gate-to-gate.
Stage three: the division. Cost per block hour equals total direct operating cost for the fleet type divided by total block hours for that fleet type, calculated separately for each aircraft type. CRJ-700, CRJ-900, E175, and ATR-72 all carry materially different cost structures and should never be blended into one fleet-wide average.
Stage four: peer selection. Identify a comparable set: same or adjacent aircraft type, similar average stage length, and similar fleet age. A carrier flying 45-minute hops has a structurally higher cost per block hour than one flying 90-minute hops, because fixed costs like landing fees and deicing amortize over fewer block hours per cycle.
Stage five: adjustment for external variables. Fuel price is the biggest swing factor and must be normalized, either by using constant fuel price assumptions across all carriers in the comparison set, or by stripping fuel entirely and comparing cost per block hour ex-fuel, which isolates the operator's controllable cost structure from commodity price movement.
A sixth, often-overlooked step sits underneath all five: documentation. Every adjustment made in stages four and five should be written down with its rationale, because the moment a benchmark number enters a rate negotiation, the counterparty will ask how it was built. A benchmark that cannot be reconstructed from its own notes is not defensible, no matter how accurate the underlying arithmetic.
Real numbers, ranges, and 2027 benchmarks

Published and derivable regional airline cost data gives a workable range, though exact figures move with fuel prices, labor contracts, and fleet mix, so treat these as planning bands rather than fixed targets.
For a 50-seat regional jet in the CRJ-700 and CRJ-900 class, direct operating cost per block hour has historically clustered in the low-to-mid $2,000s to $3,000s. Crew cost, pilots plus flight attendants, typically represents 25% to 35% of that total. Maintenance including engine reserves runs another 20% to 30%. Fuel, even when reimbursed under a capacity purchase agreement, commonly represents 20% to 25% of the fully loaded figure.
For larger regional jets like the E175 at 76 seats, cost per block hour tends to run meaningfully higher in absolute dollar terms, often 15% to 25% above a CRJ-900, because of higher fuel burn and heavier maintenance events. But cost per available seat mile is frequently lower, which is why mainline partners increasingly favor larger gauge in capacity purchase agreement fleet mix decisions even at a higher headline block-hour cost. This is the single most important nuance in regional benchmarking: the metric that looks worse can be the economically better choice.

By 2027, three structural pressures are pushing cost per block hour upward across the regional segment. First, pilot wage rate increases negotiated industry-wide since 2022 and 2023 mean crew cost per block hour has risen faster than any other line item in most regional cost structures. Second, engine maintenance reserve rates are rising as OEMs and MRO providers reprice long-term service agreements amid parts and labor inflation. Third, insurance premiums remain elevated following several years of hardening aviation insurance markets.
A carrier benchmarking its 2027 figure against 2022 or 2023 baselines without adjusting for these three drivers will systematically misread whether its own cost trajectory is in line with the industry or diverging from it. A useful discipline is to build the benchmark twice: once at current-year prices, and once at a constant-price baseline, so the gap between the two isolates inflation from operational performance.
A useful sanity-check metric alongside cost per block hour is utilization, measured as block hours flown per aircraft per day. Regional fleets typically target 8 to 10 block hours per day per aircraft. A carrier running meaningfully below that, say 6 to 7 hours, will show an inflated cost per block hour not because its operations are inefficient but because fixed ownership and insurance costs are divided across fewer flying hours. Any benchmark exercise should report utilization alongside cost per block hour so a reader can distinguish a true cost problem from a scheduling or demand problem. The same logic applies to stage length: report average stage length next to the metric, or the comparison is uninterpretable.
Trade-offs and alternative benchmarking approaches

There is no single correct way to benchmark cost per block hour, and the choice of method carries real trade-offs depending on what decision the number is meant to support.
DOT Form 41 and BTS-derived benchmarking uses publicly filed cost and traffic data that every U.S. certificated carrier reports to the Bureau of Transportation Statistics. The advantage is that it is free, standardized, and auditable. Any two carriers filing Form 41 use the same reporting conventions, so the comparison is apples-to-apples. The drawback is lag: BTS data typically publishes with a one-to-two quarter delay, so a 2027 benchmarking exercise may be working off late-2026 filings, which understates the effect of any cost spike that hit in the current year. It also aggregates at a level that can obscure per-fleet-type detail for carriers operating mixed fleets.
Industry association and consultancy benchmarking, using data assembled by groups like the Regional Airline Association or periodic industry cost studies from aviation consultancies, often provides faster, more granular peer comparisons, sometimes broken out by exact aircraft variant and route stage length. The trade-off is access and cost. This data is frequently subscription-gated or membership-restricted, and methodology can vary between providers, making cross-source comparison risky unless you confirm both sources define block hours and direct operating cost the same way.

Internal trend benchmarking, comparing this quarter's figure against the carrier's own trailing 8 to 12 quarters, sidesteps peer-comparability problems entirely and is the fastest, cheapest option. Its weakness is that it tells you nothing about competitive position. A carrier could be improving every quarter while still running 20% above the peer median, and internal-only benchmarking would never surface that gap.
CPA rate-reset benchmarking, used specifically in mainline-regional capacity purchase negotiations, ties cost per block hour to the contractual rate formula itself, often with fuel and certain cost categories passed through separately. This is the most commercially consequential use case but the narrowest. It benchmarks against one counterparty's cost model rather than the broader market, so a carrier that only benchmarks this way can lose sight of whether its underlying cost structure is competitive industry-wide, not just contractually acceptable to its single mainline partner.
Most sophisticated regional finance teams run at least two of these in parallel, typically Form 41 or BTS for defensible external credibility plus internal trend tracking for operational management, and reserve the CPA-specific model strictly for rate negotiations. The pairing matters because each method answers a different question: external data answers "are we competitive," internal data answers "are we improving," and the CPA model answers "will this rate hold."
Common pitfalls and how to avoid them
The most frequent error is blending fleet types into one average. A carrier operating both CRJ-700s and E175s that reports a single blended number is comparing an average that no peer can match against, because no peer has the same fleet mix ratio. Always benchmark fleet type by fleet type, then aggregate only for internal reporting where the blend is clearly labeled.

Second is inconsistent block hour definitions. Before any external comparison, confirm your internal reporting matches the gate-to-gate or brake-to-brake convention your peer data source uses. A mismatch of even a few minutes per flight compounds across thousands of annual departures into a meaningfully distorted metric. The fix is procedural: document the definition in the chart of accounts and audit the ACARS configuration annually.
Third is ignoring stage length effects. A regional carrier flying short 30 to 45 minute hops between small markets will always show a structurally higher cost per block hour than one flying 75 to 90 minute hops, because fixed per-cycle costs such as landing fees, ground handling, and winter deicing get divided across fewer block hours. Benchmarking two carriers with different average stage lengths without adjusting for this produces a false conclusion about relative efficiency.
Fourth is failing to separate fuel-inclusive from fuel-exclusive figures. Fuel price volatility can swing cost per block hour by 10% to 15% year over year independent of anything the airline actually controls. Reporting the ex-fuel figure alongside the fully loaded number lets stakeholders see whether cost changes are structural, driven by crew, maintenance, and insurance, or commodity-driven.
Fifth is treating one quarter as a trend. Regional fleets have seasonal maintenance patterns, with heavy checks clustering in certain quarters, and seasonal utilization patterns, with winter deicing delays and irregular operations depressing utilization and inflating cost per block hour in the first quarter. Always benchmark on a trailing-twelve-month basis unless the analysis specifically requires seasonal granularity.

Sixth is using cost per block hour as the sole metric. It should be paired with cost per available seat mile and utilization. Cost per block hour tells you the cost of an hour of flying. Cost per available seat mile tells you whether that hour was efficiently monetized per seat. Utilization tells you whether fixed costs are being spread across enough flying activity. A complete benchmark reports all three together, and a complete narrative explains which of the three is driving any observed gap.
Finally, teams sometimes forget to version the benchmark. Cost structures change, peer sets change, and definitions occasionally change. A benchmark without a version number and a change log becomes unusable within a year, because nobody can tell whether a movement in the number reflects the business or the method.
Related questions
What is the difference between block hours and flight hours for a regional fleet?
Block hours measure gate-to-gate time, brake release to brake set, including taxi. Flight hours measure only airborne time, from takeoff to landing. Block hours are the standard denominator for cost benchmarking because they capture ground delay costs too.
How does fleet age affect cost per block hour?
Older airframes typically carry lower ownership and lease costs but higher maintenance reserves and unscheduled repair frequency. Newer airframes invert that ratio, often producing a similar total cost per block hour through a different cost mix.
Does a capacity purchase agreement change how cost per block hour is calculated?

Not the calculation itself, but capacity purchase agreements often shift certain costs such as fuel and sometimes insurance to the mainline partner. The regional carrier's reported figure may then reflect only the costs it directly controls, so confirm which categories are pass-through before comparing.
Why do CRJ and E175 fleets show different cost per block hour in the same airline?
Larger aircraft burn more fuel and trigger costlier maintenance events per hour, raising absolute cost per block hour. They also carry more seats, which usually lowers the more decision-relevant cost-per-seat-mile metric.
FAQ
What data source is most reliable for benchmarking regional airline cost per block hour? DOT Form 41 and Bureau of Transportation Statistics filings are the most standardized and auditable public source, since every certificated U.S. carrier reports using the same schedules. The data typically lags the current quarter by one to two reporting periods, so pair it with internal trend data for current-year decisions.
Should fuel be included in the cost per block hour calculation?

Report both figures. The fully loaded number gives total cost visibility, while the ex-fuel number isolates the operator's controllable cost structure from fuel price volatility, which can swing the metric by 10% to 15% year over year independent of operational performance.
How often should a regional carrier re-run its cost per block hour benchmark? Quarterly for internal trend tracking, but any external peer comparison should use trailing-twelve-month data to smooth out seasonal maintenance and weather-driven utilization swings rather than a single volatile quarter.
Can cost per block hour be compared across different aircraft types directly? Not meaningfully on its own. A 76-seat E175 will almost always show a higher absolute figure than a 50-seat CRJ due to fuel burn and maintenance scale, so cross-type comparisons should use cost per available seat mile instead.
What utilization rate should a regional fleet target to keep cost per block hour competitive? Most efficient regional operations target roughly 8 to 10 block hours per aircraft per day. Utilization meaningfully below that inflates the metric because fixed ownership and insurance costs are spread across fewer flying hours, independent of any change in direct operating efficiency.
How much has pilot wage inflation affected benchmarks heading into 2027? Crew cost has been the fastest-rising line item in regional cost structures following industry-wide wage rate increases negotiated in recent contract cycles. Any benchmark using a pre-2023 baseline will understate current crew cost share without an explicit adjustment.
Sources
- https://www.bts.gov/topics/airlines-and-airports/airline-data-elements
- https://www.transportation.gov/policy/aviation-policy
- https://www.raa.org
- https://www.iata.org/en/publications/economics/
- https://www.faa.gov/data_research/aviation_data_statistics
- https://www.airlines.org/dataset/annual-and-per-minute-cost-of-delays-to-u-s-airlines/
- https://aviationweek.com
- https://www.cirium.com
Related on PULSE
- How do regional airlines structure capacity purchase agreements with mainline partners?
- What drives maintenance reserve rates on regional jet fleets?
- How should airlines benchmark cost per available seat mile?
- What is a realistic aircraft utilization target for a regional fleet in 2027?
- How does pilot wage inflation flow through to regional airline unit costs?
This page will be disappearing soon. Save it to your device for $1 — or read it free while it is here.
@Kory-White- · if Venmo asks, the last 4 of my number are 2012
This page is gone.
This one is off the shelf now. $1 keeps it on your phone for good — the whole page, pictures and diagrams included.
 pulse-industry-kpisHow do you calculate the cost per available seat mile (CASM) for an airline company in 2027?
 pulse-industry-kpisTop 10 Higher-Ed Advancement Revenue KPIs in 2027
 pulse-industry-kpisTop 10 Cannabis Dispensary Revenue per Square Foot and Basket KPIs in 2027
 pulse-industry-kpisTop 10 Airline Revenue per Available Seat Mile and Load Factor Metrics in 2027
 pulse-industry-kpisTop 10 Sales KPIs for Commercial Medical Device Sales in 2027
 pulse-industry-kpisWhat are the most important KPIs every escape room should track in 2027?
 pulse-industry-kpisTop 10 KPIs for Pressure Washing Companies in 2027
 pulse-industry-kpisTop 10 Cloud Computing Provider Revenue KPIs in 2027
 pulse-industry-kpisTop 10 Urgent Care Clinic Revenue KPIs in 2027
 pulse-industry-kpisTop 10 E-commerce Metrics for Average Order Value Optimization in 2027