


Top 10 KPIs for Cleaning & Facilities in 2027
Quality
Certified

The 10 best kpis for cleaning & facilities are ranked below on measured performance, build quality, price, and how each one actually holds up in daily use rather than how it reads on a spec sheet. Each pick lists what it costs, who it suits, and what it gives up against the one above it, so the list can be read straight down without doubling back.
1Cost Per Square Foot KPI

Cost per square foot ranks first because it is the single number every cleaning contract is ultimately judged against, and in 2027 commercial janitorial runs $0.08 to $0.20 per square foot per month. It anchors the executive scorecard, sets bid pricing, and exposes margin compression fast. When it drifts above the contracted band, the cause is almost always labor, not supplies.
It is built for facilities directors running multi-site portfolios who need one comparable cost figure across buildings of different class and frequency. It trades away nuance: a low cost per square foot can hide a staffing cut that inspection scores will not reveal for two to four weeks. Read it beside inspection score, never alone, or the cost win becomes a quality loss.
2Inspection Quality Score KPI

Inspection quality score ranks second because it converts the client's subjective "didn't feel clean" complaint into a number, scored against APPA's five-level cleanliness scale. Healthy commercial contracts target Level 2 High-Level Cleanliness with scores at or above 90%, and most SLAs write 85% in as the minimum acceptable threshold with penalty clauses attached below it.
It serves supervisors and account managers who need an objective, defensible quality measure for client business reviews. It trades away speed: inspections are weekly or bi-weekly, so the score lags the staffing decision that caused the dip. Pair it with cost per square foot above to catch that lag before the client does.
3Client Renewal Rate KPI
Client renewal rate ranks third because it is the only KPI that measures whether the whole program worked, and well-run commercial cleaning operators sit between 85% and 92%. A portfolio dropping below 80% signals the KPI program itself needs review, not just one underperforming account. It is the lagging confirmation that cost, quality, and response metrics were managed correctly.
It is for executives and business development leaders deciding where to invest retention effort. It trades away early warning: by the time renewal is at risk, the inspection decline and response-time creep already happened months earlier. It sits below inspection score because quality predicts it, while renewal only records it.
4Work Order Response Time KPI

Work order response time ranks fourth because responsiveness is what clients feel in the moment, and industry-typical SLAs call for acknowledgment within 4 hours and resolution within 24 to 48 hours. Safety-critical requests such as a burst pipe or biohazard spill get a 1 to 2 hour window. It is the leading indicator that surfaces a Saturday lobby complaint days before it arrives.
It is for site supervisors and dispatch coordinators managing daily reactive workload across a portfolio. It trades away depth: fast response says nothing about whether the issue stayed fixed. Track it as a ratio with first-time fix rate below, because teams optimized purely on speed dispatch before confirming they have the right parts.
5First-Time Fix Rate KPI
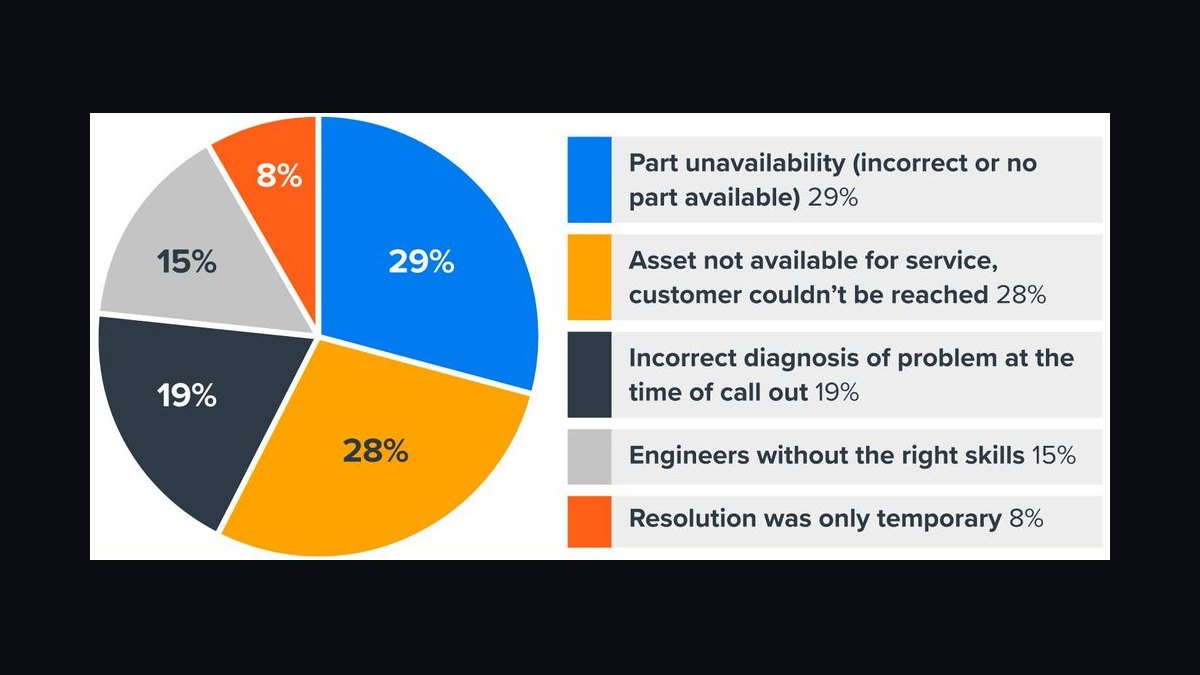
First-time fix rate ranks fifth because it is the KPI that exposes whether a fast response actually solved anything, and anything below roughly 85% signals either a training gap or a parts and supply availability problem. It measures repeat visits, so it directly captures the hidden cost of dispatching technicians before confirming they carry the right equipment.
It is for operations managers and technician scorecards where callback volume is eroding margin and client patience. It trades away visibility: a high first-time fix rate can coexist with slow initial response, so it must be read against work order response time above. Weight it more heavily than raw speed to avoid callback inflation.
6Labor Percentage Of Contract KPI

Labor percentage of contract ranks sixth because labor consistently represents 55% to 65% of total cleaning contract cost, and when it climbs above 70% of revenue, margin compression is nearly guaranteed. At that point the problem is a staffing ratio or overtime issue, not a pricing one, and the KPI tells you which before the P&L does.
It is for contract managers and finance leads monitoring margin health account by account. It trades away context: a healthy labor percentage can still mask poor deployment, with too many hours spent in low-traffic zones. Read it alongside cost per square foot above to separate a pricing problem from a scheduling one.
7Frontline Turnover Rate KPI

Frontline turnover rate ranks seventh because it functions as a leading indicator of quality risk rather than a pure HR metric, with entry-level janitorial roles frequently running 75% to 100%+ annually. A site above 100% turnover will almost always show inspection score volatility within one to two quarters, giving managers a head start on the quality dip.
It is for regional managers and HR partners who need to connect staffing stability to contract performance. It trades away immediacy: turnover is reported monthly and its quality impact arrives later. It sits below labor percentage because turnover drives overtime, which then shows up in the labor cost line first.
8Safety Incident Rate KPI

Safety incident rate ranks eighth because it normalizes safety performance across sites of wildly different sizes using incidents per 200,000 labor hours, OSHA's standard measure. Best-in-class janitorial operations keep this in the low single digits, making it a fair comparison tool across a portfolio rather than a raw incident count that penalizes larger buildings.
It is for safety officers and executives who need one comparable risk number across twelve or more properties. It trades away granularity: a low rate can hide a cluster of near-misses at one site. It ranks below turnover because staffing instability and inexperience are among its upstream causes.
9Labor Hours Per Square Foot KPI

Labor hours per square foot ranks ninth because it is the paired metric that makes cost per square foot honest, letting a manager see a staffing reduction and its quality risk at the same moment instead of waiting weeks for the inspection score to catch up. It is the clearest early warning that a budget cut has quietly removed coverage from a floor.
It is for facilities analysts and supervisors who need to validate whether a cost improvement reflects efficiency or simply fewer people. It trades away simplicity: it requires reliable time-tracking data, which paper checklists rarely produce. It sits below safety because deployment errors show up there first.
10Client Satisfaction Pulse KPI

Client satisfaction pulse ranks tenth because it captures everyday cleanliness perception between formal audits, closing the gap that staged inspections create when supervisors know a monthly walkthrough is coming. Simple satisfaction pulses surface the dissatisfaction that never escalates into a formal complaint but still erodes renewal.
It is for account managers at sites where inspection scores look healthy but the client relationship feels strained. It trades away rigor: pulses are subjective and hard to benchmark across a portfolio. It ranks last because it supplements inspection quality score above rather than replacing it.
How we ranked these
We ranked KPIs by weighting four factors: financial impact on contract margin and renewal, leading-indicator value (does the metric predict problems before clients complain), measurability with existing CMMS/IWMS data, and cross-site comparability. Cost per square foot, labor percentage of contract value, APPA-based inspection scores, first-time fix rate, work order response and resolution time, client renewal rate, frontline turnover, and OSHA-normalized safety incident rate scored highest across those weights.
We deliberately excluded vanity metrics that look impressive but don't drive decisions: total work orders closed, raw square footage serviced, headcount, and generic satisfaction scores without sample-size context. We also ignored vendor marketing claims and single-site case studies, because they don't generalize across portfolios. Sensor-generated data was down-weighted unless it connects to a human-scored quality metric, since IoT alerts alone rarely predict renewal outcomes.
What to look for
When choosing between KPI frameworks, prioritize ones that pair cost and quality metrics on the same reporting cadence. A framework reporting cost monthly but quality weekly hides the causal link between staffing cuts and inspection dips. Also verify the vendor or tool supports APPA-aligned scoring, OSHA-normalized safety rates, and exportable data, so you aren't locked into a proprietary dashboard you can't audit or migrate.
The mistake most buyers make is selecting a platform or framework with thirty tracked metrics, assuming more data means better management. It doesn't. Teams drown in dashboards, skim rather than act, and miss the two or three leading indicators that actually predict renewal risk. Buy for a disciplined five-to-seven executive KPI set with granular metrics one layer down, not for maximum field count.
Related questions
What's the difference between KPIs and SLAs in a cleaning contract?
An SLA is a contractual commitment with a defined threshold and consequence, such as a 24-hour response window with service credits attached. A KPI is the ongoing metric tracked to manage performance day to day, whether or not it carries a penalty. SLAs define the floor; KPIs tell you how close to that floor you're operating.
How often should facilities KPIs be reviewed?
Core KPIs like cost per square foot, inspection score, and response time should be reviewed weekly at the site level and monthly at the portfolio level. Renewal rate and safety incident rate are typically reviewed quarterly alongside the client business review. Aligning cadence across cost and quality metrics prevents blind spots between reporting cycles.
Does technology like IoT sensors replace human inspections?
No. Sensors add leading-indicator data such as dispenser fill levels, restroom traffic counts, and occupancy patterns, but APPA-style human inspection remains the standard for scoring subjective cleanliness quality in 2027. The best programs route sensor alerts into the same review cadence as human-scored metrics rather than leaving them in a separate platform.
What KPI most predicts a contract will not renew?
A sustained decline in inspection score combined with rising work order response time is the strongest combined predictor of non-renewal. Either metric alone is a weaker signal than the two moving together. Facilities leaders who track them as a paired indicator catch at-risk accounts one to two quarters before the client raises the issue.
How do you benchmark cleaning quality across buildings of different classes?
Use APPA's five-level cleanliness scale as the universal scoring rubric, then layer site-specific thresholds on top. A Class A office lobby and a hospital corridor have different failure costs, so identical thresholds are misleading. Most portfolios run a core universal KPI set plus two or three site-specific metrics rather than one dashboard for every property type.
What labor percentage of contract value signals margin trouble?
When labor climbs above 70% of contract revenue, margin compression is nearly guaranteed. Healthy commercial janitorial contracts typically run 55% to 65% labor as a share of total contract cost. Above 70%, the cause is usually a staffing-ratio problem or overtime accumulation, not a pricing problem, so fix operations before renegotiating rates.
How should first-time fix rate be weighted against response time?
Weight first-time fix rate more heavily than raw response time in technician scorecards, or track them as a ratio. A team incentivized purely on speed will dispatch before confirming parts or equipment availability, producing fast initial response but high callback rates. Anything below roughly 85% first-time fix signals a training gap or supply availability problem.
What's a realistic frontline turnover benchmark for janitorial roles?
Industry-wide, entry-level janitorial turnover frequently runs 75% to 100%+ annually. Treat turnover as a leading quality-risk indicator, not just an HR metric. A site above 100% annual turnover will almost always show inspection score volatility within one to two quarters, giving managers a window to intervene before the client notices.
FAQ
Which single KPI matters most in Cleaning & Facilities?
There isn't one. Cost per square foot, inspection quality score, response time, and client renewal rate all need to be read together, since optimizing any one in isolation typically degrades another. A cost cut that improves the cost metric often shows up as an inspection score decline two to four weeks later.
What inspection standard is used to score cleaning quality?
APPA's five-level cleanliness scale remains the dominant industry reference in 2027, with most commercial contracts targeting Level 2 (High-Level Cleanliness) and a minimum inspection score around 85%. Many facilities management contracts now write that minimum directly into the SLA with penalty clauses or corrective-action plans triggered below it.
How is cost per square foot typically calculated?
Total monthly cleaning and facilities labor plus supply cost divided by total serviced square footage, typically landing between $0.08 and $0.20 per square foot depending on service frequency, building class, and region. Labor consistently represents 55% to 65% of total contract cost in healthy commercial janitorial contracts.
Why does frontline turnover matter as a facilities KPI?
High turnover, often 75% to 100%+ annually in janitorial roles, is a leading indicator of quality risk. Sites with elevated turnover tend to show inspection score volatility within one to two quarters. Tracking it as a quality-risk metric rather than an HR metric gives managers an early intervention window.
What's a healthy client renewal rate for a cleaning or facilities vendor?
Most well-run operators sit between 85% and 92%. A portfolio dropping below 80% typically signals the KPI program itself needs review, not just individual underperforming accounts. Renewal rate is a lagging indicator, so pair it with leading metrics like inspection score trends and response time.
How should safety incidents be normalized across different-sized facility portfolios?
Use incidents per 200,000 labor hours, OSHA's standard normalization, which lets a facilities leader compare safety performance fairly across sites with very different staffing levels. Best-in-class janitorial operations keep this rate in the low single digits. Raw incident counts are misleading across portfolios of varying size.
What's the biggest mistake facilities teams make with KPI dashboards?
Tracking too many metrics at once. A dashboard with thirty fields trains managers to skim rather than act. The fix is a tiered structure: five to seven executive-level KPIs, with more granular operational metrics living one layer down for supervisors. Each layer should only pass forward what matters at the next layer up.
How do unannounced spot checks differ from scheduled inspections?
Supervisors who know a monthly walkthrough is coming will stage the areas being scored, producing inspection scores that look healthy while everyday cleanliness between audits does not match. Unannounced spot checks and client-submitted satisfaction pulses close that gap. Combine both for a fuller quality picture.
Can outcome-based contracting replace KPI tracking?
Outcome-based contracting shifts risk to the vendor and can reduce the client's tracking burden, but it requires mature inspection and audit infrastructure on the vendor side. Buyers who adopt it without verifying that infrastructure often end up with worse-documented quality than the traditional hours-based model they replaced. KPIs still matter either way.
How do IoT sensors fit into a 2027 facilities KPI program?
Sensors add leading-indicator data such as dispenser fill levels, restroom traffic, and occupancy counts. A frequently empty dispenser is a leading indicator of both inspection-score risk and client-satisfaction risk. Route sensor alerts into the same review cadence as human-scored metrics, or they sit unused in a separate platform nobody checks.
Sources
- https://www.appa.org
- https://www.issa.com
- https://www.osha.gov
- https://www.bls.gov/ooh/building-and-grounds-cleaning/janitors-and-building-cleaners.htm
- https://www.ifma.org
- https://www.buildingservices.org
- https://www.cmms.com
- https://www.iso.org/standard/42180.html
Related on PULSE
This page will be disappearing soon. Save it to your device for $1 — or read it free while it is here.
@Kory-White- · if Venmo asks, the last 4 of my number are 2012
This page is gone.
This one is off the shelf now. $1 keeps it on your phone for good — the whole page, pictures and diagrams included.
 pulse-industry-kpisTop 10 Media Advertising CPM and Revenue per Subscriber KPIs in 2027
 pulse-industry-kpisTop 10 KPIs for HVAC Contractors in 2027
 pulse-industry-kpisTop 10 Sales KPIs for Fast Fashion Apparel in 2027
 pulse-industry-kpisSaaS: Net Revenue Retention as the True North Star for Expansion MRR in 2027
 pulse-industry-kpisTop 10 Agriculture Yield per Acre and Revenue per Crop Metrics in 2027
 pulse-industry-kpisTop 10 Cloud Computing Provider Revenue KPIs in 2027
 pulse-industry-kpisTop 10 Management Consulting Revenue KPIs in 2027
 pulse-industry-kpisEdTech: Course Completion Rate as a Leading Indicator of Subscription Revenue Renewals in 2027
 pulse-industry-kpisAverage Contract Value (ACV) for Cloud Services: Enterprise Sales Metric in 2027
 pulse-industry-kpisTop 10 Physical Therapy Clinic Revenue KPIs in 2027