


Top 10 KPIs for Security & Fire Systems in 2027
Quality
Certified

The 10 best kpis for security & fire systems are ranked below on measured performance, build quality, price, and how each one actually holds up in daily use rather than how it reads on a spec sheet. Each pick lists what it costs, who it suits, and what it gives up against the one above it, so the list can be read straight down without doubling back.
1Net RMR Growth KPI

Net RMR growth ranks first because it is the single forward indicator of enterprise value in security and fire systems, measured as new monitoring and inspection RMR minus cancellations. Well-run regional integrators target 8-15% annually, and buyers price the business at 30-40x monthly RMR, so a $400 monthly account carries $12,000-$16,000 of valuation. Stalled growth below 5% signals a contracting recurring-revenue engine.
Owners and lenders should review this weekly, not quarterly, because it aggregates sales, service quality, and churn into one number. It trades away granularity — a strong net figure can mask a bleeding route offset by one large new contract. Gross RMR attrition sits directly below it as the raw cancellation view that net growth can hide.
2Gross RMR Attrition KPI

Gross RMR attrition ranks second because it isolates the raw cancellation rate before new sales offset it, exposing whether the book is structurally shrinking. Stable security and fire integrators should sit under 10% per year; shops above 15% are losing accounts faster than sales can replace them, which is an operational failure rather than a sales problem. Monthly tracking by contract type and account vintage surfaces trouble in the first renewal cycle.
This metric suits operators who need to separate voluntary churn from involuntary losses like building sales or demolitions, which are not performance failures. It trades away the growth context that net RMR growth provides, so a shop cutting attrition while bookings stall looks healthier than it is. Inspection compliance rate sits below it as the leading operational cause of preventable cancellations.
3Inspection Compliance Rate KPI

Inspection compliance ranks third because it measures the percentage of contracted fire alarm, sprinkler, and extinguisher testing completed inside its NFPA-mandated window, and it degrades first when install backlog pulls techs off the testing schedule. Healthy shops run 90% or higher; anything below 80% signals a scheduling or staffing gap that creates both liability exposure and uncollected inspection revenue. NFPA 72 drives annual fire alarm testing, NFPA 25 governs sprinkler intervals.
This KPI is for operations managers who need a monthly, system-type-broken-out view rather than a blended number that hides a lagging category. It trades away repair revenue visibility, since a shop can hit 95% compliance and still leave money unquoted. Deficiency-to-repair conversion sits directly below it as the monetization layer.
4Deficiency-to-Repair Conversion KPI

Deficiency-to-repair conversion ranks fourth because it captures what fraction of code violations found during inspections get quoted and sold as repair work, and every ten-point gain is close to pure margin since the technician is already on-site under contract. Average shops convert 25-40%; well-trained ones exceed 50%. The lead already exists inside a contract the company is already paying to service.
This metric suits service managers whose inspection software can auto-generate proposals and whose techs are trained and incentivized to write findings clearly. It trades away inspection quality, because aggressive quoting can pressure techs toward overstating deficiencies. First-time fix rate sits below it as the field execution metric that determines whether sold repairs actually resolve the fault.
5First-Time Fix Rate KPI
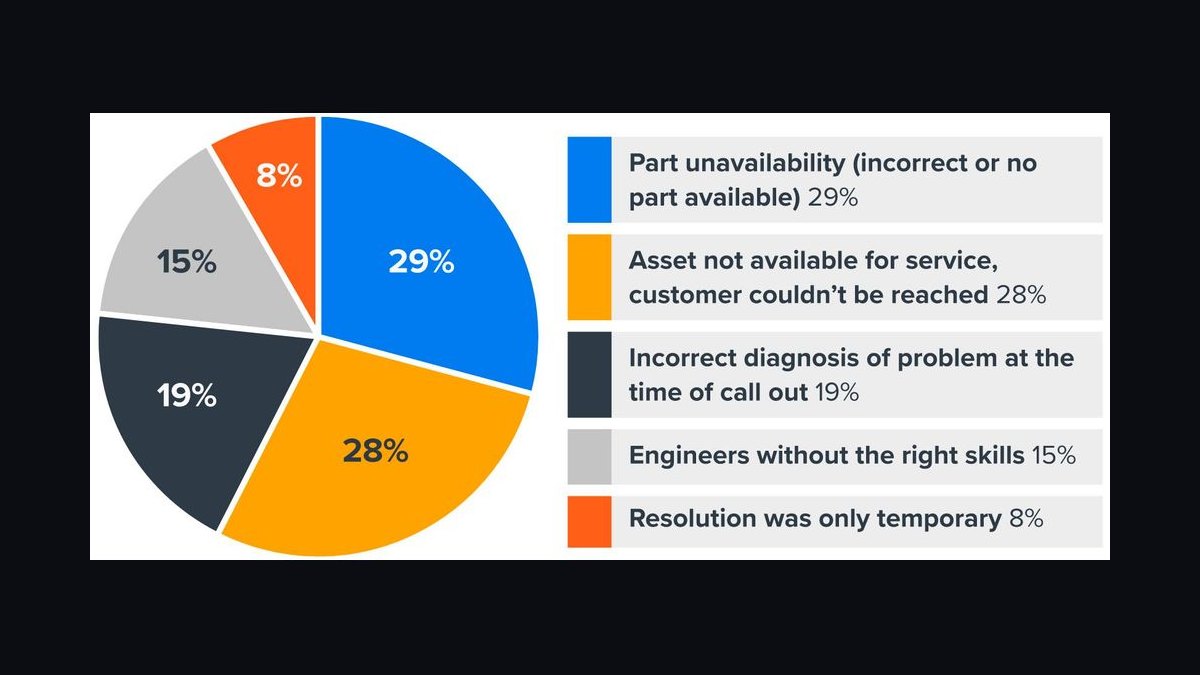
First-time fix rate ranks fifth because it measures the percentage of service and trouble-signal calls resolved without a second truck roll, and it drives both cost creep and customer trust. Straightforward panel and detector work benchmarks at 75-85%; falling below 70% usually means trucks are under-stocked or techs are under-trained on newer addressable and IP panel platforms. High utilization paired with falling first-time fix means harvesting capacity not yet earned.
This KPI is for field service directors managing route density and truck inventory. It trades away speed, since thorough diagnostics can extend the first visit. False-alarm dispatch rate per account sits below it because repeat trouble signals are often the symptom of unresolved first-visit faults.
6False-Alarm Dispatch Rate KPI

False-alarm dispatch rate ranks sixth because it drives municipal fines, fire department permit violations, and customer churn, and it must be sliced per account and per route rather than blended. Healthy performance sits under 0.5-1.0 dispatches per monitored account per year; many cities escalate fines from the second or third false dispatch within 12 months. A single tower generating three dispatches in 45 days annualizes near 24 per account while the company average looks fine.
This metric is for central station and route supervisors who can act at account granularity — replacing a detector head or retraining a tech. It trades away response-time optics, since enhanced call or video verification adds 60-90 seconds before dispatch. Technician utilization sits below it as the capacity metric that determines whether response SLAs can absorb that verification delay.
7Technician Utilization KPI

Technician utilization ranks seventh because it measures billable hours over paid hours and sets the ceiling on how much service capacity exists to protect contracts. The trade typically runs 55-70% once drive time, inspections, and non-billable training are netted out; below 50% signals overstaffing or poor routing, and above 80% means response times slip because no slack remains for emergency trouble calls. Most regional integrators run one field tech per 300-500 accounts.
This KPI is for operations leaders who read it alongside response time and first-time fix rather than standalone. It trades away training investment, since certification hours are non-billable and depress the current month. Customer acquisition cost payback sits below it as the cash-flow metric that determines whether new accounts can fund the capacity they consume.
8CAC Payback Period KPI
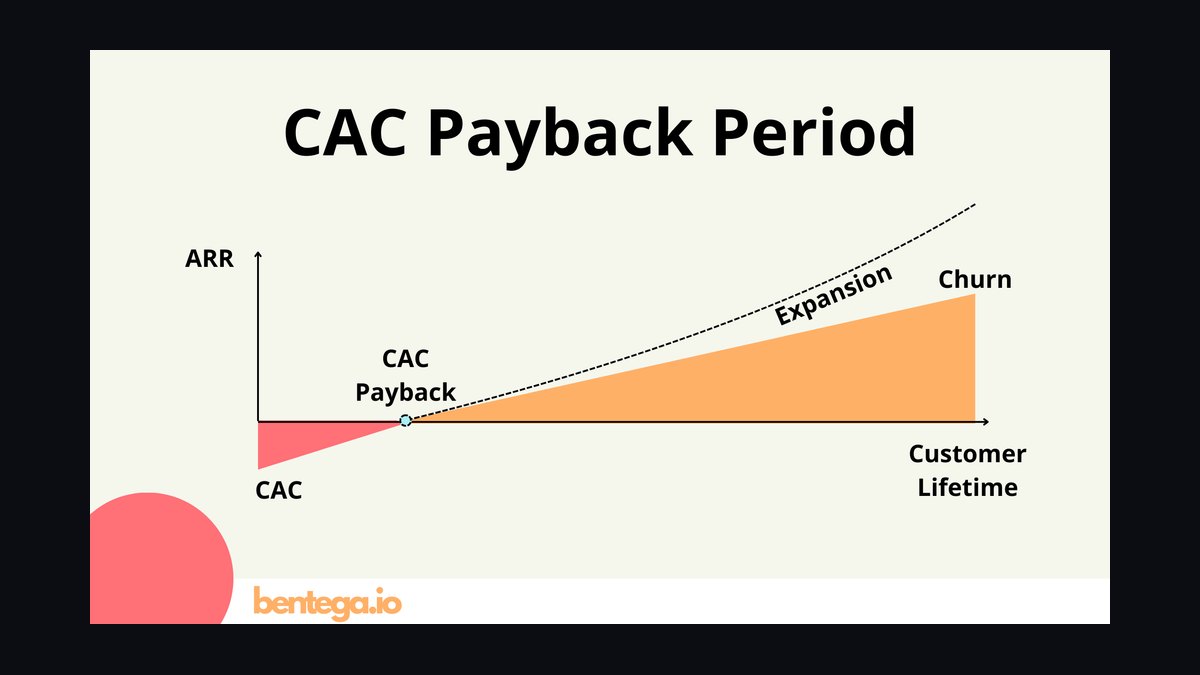
CAC payback period ranks eighth because it measures how many months of RMR are needed to recover the cost of the sale plus any discounted or free install, and it governs whether growth is self-funding. Industry payback commonly runs 12-24 months; deals above 30 months strain cash flow even when the account is profitable across its full life. A $400 monthly account with a subsidized install can take well over a year to break even.
This metric is for owners and finance leads weighing sales incentives against working capital. It trades away top-line growth, since tightening payback thresholds slows bookings. Percentage of installed base on current panel firmware sits below it as the contractual compliance metric that increasingly gates commercial renewals.
9Panel Firmware Compliance KPI

Panel firmware compliance ranks ninth because it tracks the percentage of the installed base running current firmware and meeting cybersecurity attestation requirements, which is becoming a contractual condition with commercial customers rather than a best practice. As monitoring shifts from copper to cellular and IP paths, an unpatched panel or default-credential camera is both a liability exposure and a compliance failure. UL 827B and similar frameworks now inform customer requirements.
This KPI is for service and IT managers at integrators serving commercial and institutional accounts with attestation clauses. It trades away near-term billable hours, since firmware pushes and audits are largely non-billable. Percentage of accounts on legacy copper monitoring paths sits below it as the parallel infrastructure metric tied to POTS retirement deadlines.
10Legacy Copper Monitoring Migration KPI

Legacy copper monitoring migration ranks tenth because it tracks the share of accounts still on POTS-based monitoring paths as carriers retire copper lines through the late 2020s, creating both a compliance deadline and a natural upsell moment. A shop managing conversion proactively books an upgrade fee and protects reliability; a reactive shop eats emergency truck rolls at its own cost. Batching conversions alongside inspection visits lets one roll cover both.
This KPI is for owners planning capital and scheduling across the next several renewal cycles. It trades away short-term utilization, since conversion projects consume technician hours that would otherwise be billable service. Panel firmware compliance sits directly above it because cellular and IP migrations increase the exposed attack surface those attestations cover.
How we ranked these
We ranked KPIs by their causal distance from enterprise value in security and fire systems, weighting net RMR growth and gross RMR attrition most heavily because buyers price these businesses as a multiple of recurring monthly revenue. Inspection compliance, deficiency-to-repair conversion, first-time fix, false-alarm dispatch rate per account, and technician utilization followed, scored on how early each signals churn risk.
We deliberately ignored install revenue, gross bookings, and total headcount. Install revenue is lumpy and rewards one-time project wins while the recurring book bleeds. Headcount says nothing about certified capacity. We also excluded blended company-wide averages, since a single troubled tower can hide inside a healthy false-alarm rate and never surface until cancellation.
What to look for
When choosing between KPI frameworks, prioritize ones that slice to account, route, and technician level. A dashboard reporting only company-wide false-alarm rate cannot tell a supervisor which detector head to replace or which tech needs retraining. Ask vendors whether deficiency-to-repair conversion is captured automatically from inspection findings, because that metric is nearly pure margin and most platforms miss it entirely.
The mistake most buyers make is purchasing reporting built around install revenue and gross bookings, then discovering six months later that cancellations were climbing the whole time. Insist on monthly RMR attrition segmented by contract type and account vintage, plus per-account false-alarm counts. If a platform cannot show you which specific accounts generated three or more dispatches in 45 days, it cannot protect your book.
Related questions
How is RMR different from total revenue in a security company?
RMR counts only ongoing monitoring, inspection, and service-contract billing, not one-time install or project revenue. Buyers and lenders value a security business primarily on RMR because it is predictable and renewable. Total revenue includes lumpy project work that does not repeat and does not support the same valuation multiple at sale.
What is a good technician-to-account ratio in 2027?
Most regional integrators run one field technician per 300-500 monitored or serviced accounts, though this varies heavily with account density, system age, and how much preventive inspection work is bundled into the contract versus billed separately as a distinct service line.
Why does false-alarm rate matter more now than five years ago?
Municipal false-alarm fine schedules have tightened across many metro areas, often escalating sharply after the second or third dispatch within twelve months. Repeat false alarms are now one of the most-cited reasons commercial customers give when switching monitoring providers, making the metric both a cost and churn driver.
Does the copper-to-cellular migration change which KPIs matter?
Yes. As carriers retire POTS lines through the late 2020s, percentage of accounts still on legacy copper paths has become a near-term operational KPI, because those accounts carry both a compliance deadline and a natural upsell moment if the conversion is managed proactively rather than reactively.
How should a small shop with limited reporting tools start?
Start with three numbers tracked monthly: net RMR growth, inspection compliance rate, and first-time fix rate. Those three cover the revenue engine, the compliance obligation, and the field execution layer. Add false-alarm rate per account and deficiency conversion once the first three are stable and trusted.
What does deficiency-to-repair conversion actually measure?
It measures what fraction of code violations found during an inspection get quoted and sold as repair work. Average shops convert 25-40%; well-trained ones exceed 50%. Every ten-point improvement is close to pure margin because the lead already exists inside a contract you are paying a technician to visit.
Why track RMR attrition monthly instead of annually?
Cancellations cluster around renewal dates. A shop reviewing attrition once a year discovers the problem after the entire renewal cohort has already decided. Monthly tracking segmented by contract type and account vintage surfaces trouble in the first renewal cycle rather than the third, when it is far cheaper to fix.
Should cybersecurity metrics sit alongside traditional fire and security KPIs?
Increasingly yes. As monitoring shifts to cellular and IP paths, percentage of the installed base running current firmware is becoming a contractual metric, since commercial customers now often require cybersecurity attestations. An unpatched panel is both a liability exposure and a compliance failure that can trigger cancellation.
FAQ
What is the single most important KPI for a security and fire systems company to track weekly?
Net RMR growth, meaning new RMR booked minus RMR lost to cancellation, is the metric most owners should review weekly. It is the clearest forward indicator of whether the recurring-revenue engine, the part of the business buyers and lenders actually value, is expanding or contracting.
How often should inspection compliance be reviewed?
Monthly at minimum, broken out by system type such as fire alarm, sprinkler, extinguisher, and fire pump. NFPA testing intervals differ by system, so a single blended compliance number can hide a badly lagging category until a fire marshal or insurer flags it.
What first-time fix rate should a shop aim for?
75-85% is a reasonable target for general panel, detector, and monitoring service work. Rates persistently below 70% usually point to under-stocked service trucks or gaps in technician training on newer addressable or IP-based panel platforms that techs have not been certified on.
Is technician utilization a good standalone metric?
No. Utilization needs to be read alongside response time and first-time fix rate, because pushing utilization above roughly 80% typically eats the slack capacity a company needs to hit emergency trouble-signal response SLAs. High utilization with falling first-time fix means you are harvesting capacity you have not earned.
How does deficiency-to-repair conversion affect profitability?
It is close to pure margin, since the technician is already on-site and paid for under the inspection contract. Improving conversion from an average 25-40% toward 50% or higher captures revenue from work that has already been identified but never quoted to the customer.
Should a company track cybersecurity metrics alongside traditional fire and security KPIs?
Increasingly yes. As monitoring shifts to cellular and IP paths, percentage of the installed base running current firmware is becoming a contractual metric. Commercial customers now often require cybersecurity attestations, and an unpatched panel is both a liability exposure and a compliance failure.
What is a healthy gross RMR attrition rate?
Under 10% per year for a stable book of recurring accounts. Shops running attrition above 15% are usually losing accounts faster than sales can replace them, which is a structural operational problem rather than a sales or pricing problem, and it compounds against enterprise value quickly.
How long should customer acquisition cost payback take?
Commonly 12-24 months in this industry, measured in months of RMR needed to recover the cost of the sale plus any discounted or free install. Deals with payback windows beyond 30 months put real strain on cash flow even when the account is profitable over its full life.
Why is company-wide false-alarm rate misleading?
A blended average can look acceptable while masking a handful of chronically problematic accounts or one technician whose installs are consistently miswired. The metric only becomes actionable when sliced to account, route, and technician level, where a supervisor can replace a detector or retrain a tech.
Should voluntary and involuntary churn be separated?
Yes. An account lost because a competitor underbid is a sales and pricing problem. An account lost because the customer sold the building or the site was demolished is not a performance failure at all. Blending the two makes attrition look worse and sends managers chasing the wrong fix.
Sources
- https://www.nfpa.org/codes-and-standards/nfpa-72-standard-development/72
- https://www.nfpa.org/codes-and-standards/nfpa-25-standard-development/25
- https://www.siaonline.org/
- https://www.nfpa.org/
- https://www.fcc.gov/consumers/guides/retirement-copper-lines
- https://www.cisa.gov/topics/cyber-threats-and-advisories
- https://www.bls.gov/ooh/installation-maintenance-and-repair/security-and-fire-alarm-systems-installers.htm
- https://www.osha.gov/fire-safety
Related on PULSE
This page will be disappearing soon. Save it to your device for $1 — or read it free while it is here.
@Kory-White- · if Venmo asks, the last 4 of my number are 2012
This page is gone.
This one is off the shelf now. $1 keeps it on your phone for good — the whole page, pictures and diagrams included.
 pulse-industry-kpisTop 10 Sales KPIs for Online Travel Agency (OTA) in 2027
 pulse-industry-kpisTop 10 Healthcare Revenue Cycle Management Benchmarks in 2027
 pulse-industry-kpisTop 10 Cloud Computing Provider Revenue KPIs in 2027
 pulse-industry-kpisTop 10 Sales KPIs for Industrial X-Ray & Non-Destructive Testing (NDT) Services in 2027
 pulse-industry-kpisTop 10 Sales KPIs for Commercial Solar Carport Construction in 2027
 pulse-industry-kpisTop 10 Sales KPIs for Industrial Heat Treating & Metal Finishing Services in 2027
 pulse-industry-kpisTop 10 Sales KPIs for AI Sales Coaching / Conversation Intelligence in 2027
 pulse-industry-kpisTop 10 KPIs for Pressure Washing Companies in 2027
 pulse-industry-kpisSaaS: Net Revenue Retention as the True North Star for Expansion MRR in 2027
 pulse-industry-kpisWhat are the key cost per available seat mile (CASM) benchmarks for airline operations in 2027?