
Top 10 Sales KPIs for Commercial B2B SaaS in 2027
 Curated byKory White · Fractional CRO · Maryland
 PULSEKNOWLEDGE LIBRARY
Quality
Certified
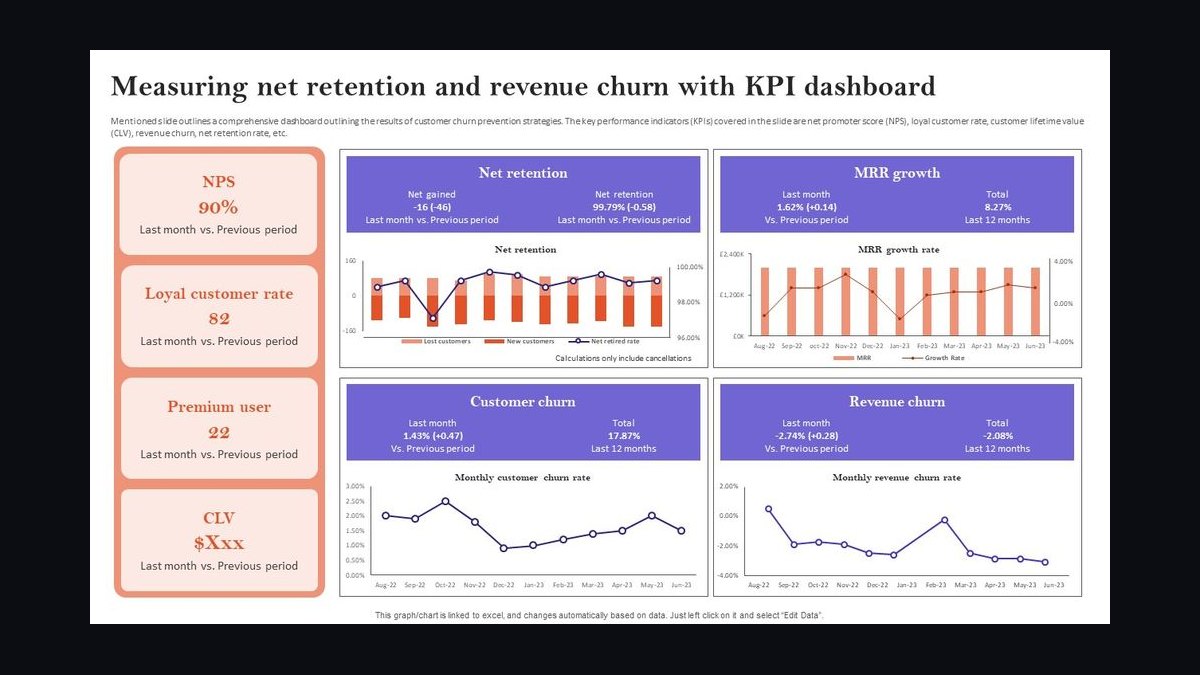
The 10 best sales kpis for commercial b2b saas are ranked below on measured performance, build quality, price, and how each one actually holds up in daily use rather than how it reads on a spec sheet. Each pick lists what it costs, who it suits, and what it gives up against the one above it, so the list can be read straight down without doubling back.
1. Net Revenue Retention

Net Revenue Retention ranks first because it is the single most-watched KPI for commercial B2B SaaS in 2027, with top-quartile public vendors holding 118-128% and private mid-market running 108-118%. It captures expansion minus churn minus downgrades on the existing book, so a vendor at 120% roughly doubles on retention alone over four years. Below 110% at Series C is a board-level red flag.
It is built for revenue leaders at scaled companies where the installed base dwarfs new-logo bookings. The trade-off is that a strong blended NRR can hide a broken segment refilling itself with one or two large upsells, so cohorting by ICP and ACV band is mandatory. Compared with Gross Revenue Retention directly below, NRR is noisier but more predictive of compounding growth.
2. Gross Revenue Retention

Gross Revenue Retention ranks second because it strips expansion and isolates churn plus downgrade, making it the cleanest read on product stickiness. Healthy mid-market sits at 90-95%, enterprise at 92-96%, and vertical SaaS with regulated-workflow lock-in often reaches 96-98%. If NRR looks strong but GRR falls below 88%, the company is refilling a sieve with upsell.
It suits operators who need to distinguish genuine retention from expansion masking churn, particularly CFOs and boards auditing the durability of the installed base. The trade-off is that GRR ignores the expansion that drives most SaaS value creation, so it cannot stand alone. Against Net Revenue Retention above, GRR is the floor test; against CAC Payback below, it is the slower but more structural signal.
3. CAC Payback Period

CAC Payback Period ranks third because it decides whether the business can fund its own growth without another raise, the central question for cash-constrained operators in 2027. Sales-led mid-market benchmarks run 12-18 months, enterprise 18-30 months, and product-led 6-14 months. Anything above 30 months for a sales-led motion usually signals an ICP that is too broad.
It is built for CFOs and boards inheriting fast-growth, cash-burning companies, and for any operator with runway under 18 months where efficiency becomes survival. The trade-off is lag: payback reflects decisions made six to eight quarters ago, so it is diagnostic rather than steerable in-quarter. Against Magic Number directly below, payback is the slower cohort view; Magic Number is the faster quarterly pulse.
4. Magic Number

Magic Number ranks fourth because it measures whether each incremental dollar of sales-and-marketing spend returns efficiently, computed as new ARR added in a quarter divided by prior-quarter S&M spend. Healthy growth-stage operators run 0.7-1.2; scaled public companies run 0.5-0.8. Above 1.0 says accelerate spend; sustained below 0.5 says fix efficiency, not add reps.
It is built for growth-stage revenue leaders and boards making quarterly capital-allocation calls on sales headcount and marketing budget. The trade-off is that it is noisy quarter to quarter and sensitive to deal-timing lumpiness, so trailing-90-day averages matter more than any single print. Against CAC Payback above, Magic Number is the faster steering signal; against Rule of 40 below, it is the narrower go-to-market efficiency read.
5. Rule of 40

Rule of 40 ranks fifth because it grades growth and profitability together in one number, and public-market investors use it as the primary efficient-growth benchmark from Series D onward. It is annual revenue growth rate plus free-cash-flow margin, benchmarked at 40. Top public performers have printed in the high-40s to low-50s, and the top-quartile private bar has crept toward 50.
It is built for CROs, CFOs, and boards preparing for public comparables or late-stage raises, where a single composite number drives valuation conversations. The trade-off is that it is a lagging aggregate that hides which family of KPIs is actually broken, so it must be decomposed. Against Magic Number above, Rule of 40 is the board-altitude metric; against Sales Cycle Length below, it is the strategic grade rather than the operational lever.
6. Sales Cycle Length

Sales Cycle Length ranks sixth because it governs forecast accuracy and quota setting, with mid-market deals closing in 45-90 days, enterprise in 120-210 days, and regulated buyers in banking, healthcare, and government extending to 240-365 days. Tracking by ACV band is essential because a blended average masks 30-day SMB deals and 180-day enterprise deals running in parallel.
It is built for RevOps and front-line sales managers who need to set realistic close-date expectations and stage-exit gates. The trade-off is that cycle length is descriptive rather than directly steerable, and compressing it too aggressively can push reps to skip discovery and damage win rates. Against Rule of 40 above, cycle length is the operational clock; against Win Rate by Stage below, it is the speed half of the velocity equation.
7. Win Rate by Stage
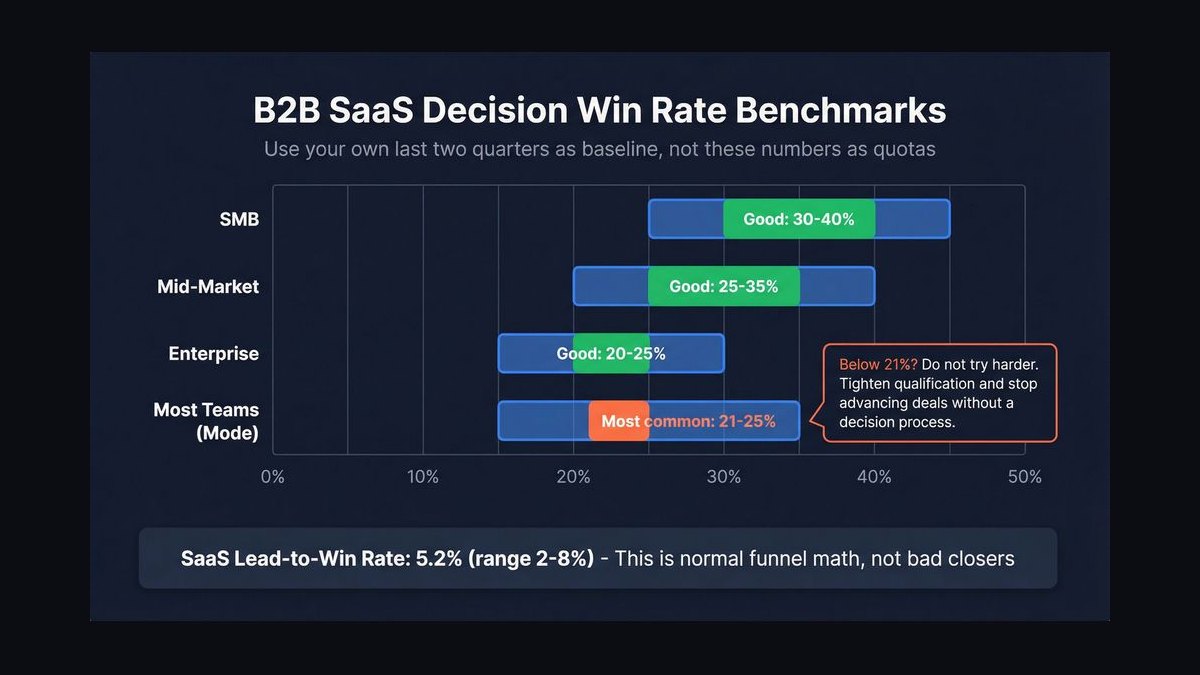
Win Rate by Stage ranks seventh because it reveals where deals actually die, with mid-market closed-won at 22-28%, enterprise at 14-20%, and product-led-converted at 32-42%. Stage-conversion matters more than the blended rate: qualified-to-POC below 60% usually means discovery is broken, while POC-to-closed below 55% means technical validation is not translating into a signed business case.
It is built for sales leaders diagnosing funnel leakage and for RevOps teams calibrating stage definitions and qualification bars. The trade-off is that win rate is easily gamed by redefining what counts as a qualified opportunity, so stage definitions must be audited against live deal reviews. Against Sales Cycle Length above, win rate is the conversion half of velocity; against Pipeline Coverage Ratio below, it is the quality check on the pipeline being counted.
8. Pipeline Coverage Ratio
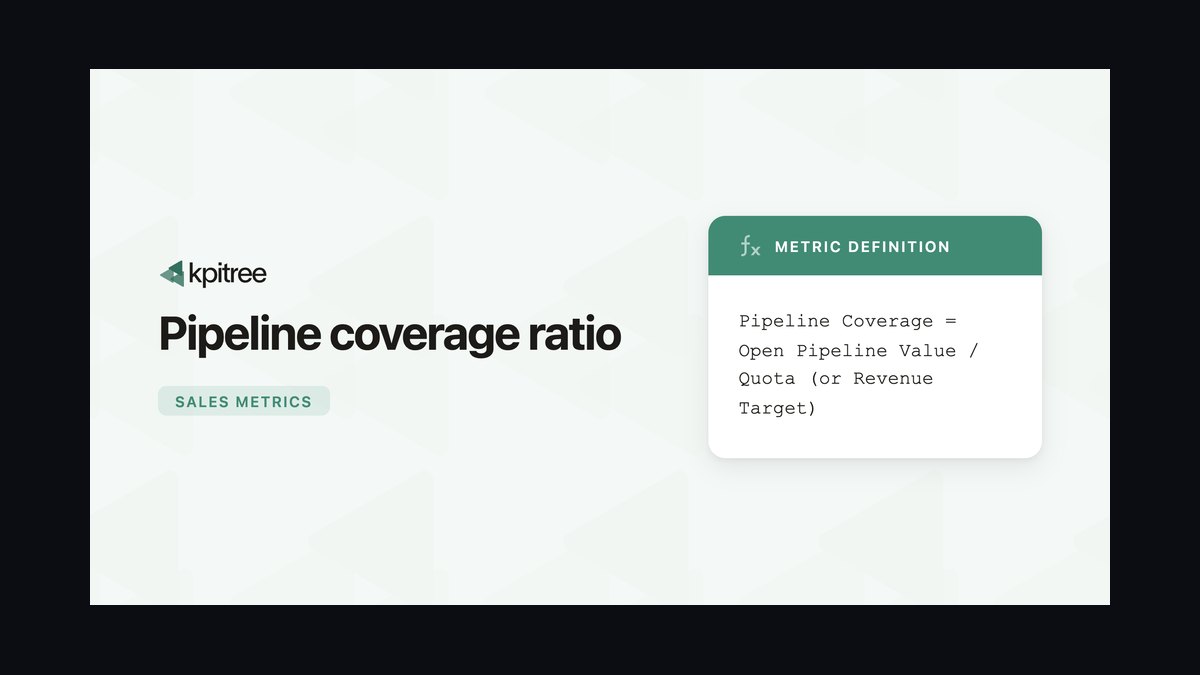
Pipeline Coverage Ratio ranks eighth because it is the forward-looking, controllable KPI that predicts bookings one to two quarters out, and the old 3x standard has crept to 3.5-4.0x as agentic-sourced pipeline converts at a lower per-opportunity rate. Healthy enterprise runs 4.0-5.0x because cycles span quarters. A static 4x that is stagnating is worse than a 3.2x growing 8% week over week.
It is built for revenue orgs in turnaround or fresh fiscal years, where pipeline moves first and is the earliest lever leadership can pull. The trade-off is that coverage is easy to inflate with low-quality agentic outbound, so it must be paired with creation velocity and weighted pipeline. Against Win Rate by Stage above, coverage is the input metric; against ARR per Sales-and-Marketing FTE below, it is the top-of-funnel read.
9. ARR per Sales-and-Marketing FTE
ARR per Sales-and-Marketing FTE ranks ninth because it is the cleanest single read on whether agentic AI tooling has converted into real leverage, with the 2024 baseline at roughly $400-600K and 2027 top-quartile operators reaching $700K-1.1M. If it is flat year over year despite a heavy agentic stack, the spend went in and the leverage did not come out.
It is built for CROs and CFOs justifying AI tool spend and for boards pressure-testing whether headcount plans are realistic. The trade-off is that it is a blunt ratio that can be flattered by a few high-ACV deals or depressed by a heavy ramp cohort, so it must be cohorted by tenure and segment.
10. Multi-Threading Count

Multi-Threading Count ranks tenth because the average enterprise SaaS deal now involves roughly 8-11 buyer roles, and reps who reach four or more stakeholders by stage three win materially more often than reps riding a single champion. It is tracked as a leading quality metric alongside win rate, and single-threaded deals lose at a disproportionate rate in 2027 procurement cycles.
It is built for front-line managers and reps who need a controllable, deal-level behavior to steer week to week, rather than a lagging financial outcome. The trade-off is that multi-threading is hard to measure cleanly in CRM data and can be gamed by logging contacts who never engage, so call-review tooling must validate real stakeholder involvement.
How we ranked these
Ranked nine core KPIs across three families: pipeline and velocity (coverage, win rate, cycle length), unit economics (CAC payback, Magic Number, gross margin), and retention plus expansion (NRR, GRR, logo retention), with Rule of 40 as the cross-cutting grade. Each KPI was weighted by stage relevance, benchmark spread against public filings, and how early it signals trouble before bookings slip.
Deliberately ignored: raw activity counts like calls and emails, since agentic prospecting made them nearly free and therefore meaningless as signal. Also excluded vanity metrics such as total pipeline value without conversion context, headcount growth, and blended company-wide averages that mask segment-level rot. Single-quarter snapshots were downweighted in favor of cohort and trailing trends.
What to look for
When choosing between these KPIs, match the scorecard to your stage and cash position, not to what peers tweet about. A Series B company should lead with pipeline velocity and coverage; a Series C-plus company should lead with NRR and GRR. If runway is under 18 months, unit economics override everything else regardless of stage, because efficiency becomes survival.
The mistake most buyers make is adopting a scaled public company's scorecard wholesale. Copying Rule of 40 and NRR obsession into a Series B starves pipeline and stalls new-logo growth. The second mistake is trusting blended numbers: a company-wide NRR of 118% can hide a dying segment refilled by two large upsells. Cohort everything.
Related questions
What is the single most important KPI for a Series B-D SaaS company?
Net Revenue Retention. Below 110% at Series C means the business must keep refilling a leaky bucket; above 120% means it compounds even with flat new-logo bookings, which is why investors weight it most heavily at that stage and why it anchors the growth-stage scorecard.
How has agentic AI changed which KPIs matter most?
It elevated ARR per S&M FTE from a vanity number to a core efficiency metric, and shifted activity tracking from raw counts to qualified outcomes. Pipeline coverage benchmarks rose from 3x to 3.5-4x because agentic-sourced pipeline converts at a lower per-opportunity rate.
How do you benchmark companies with very different ACV ranges?
Never compare gross numbers across ACV bands — a $15K-ACV vendor will always show shorter cycles and lower win rates than a $500K-ACV vendor. Benchmark within cohorts (sub-$50K, $50-250K, $250K-1M, $1M+) and use efficiency ratios for any cross-ACV comparison.
Is Rule of 40 still relevant for private SaaS in 2027?
Yes, from Series C onward. Public-market comparables anchor private valuations, so investors apply Rule of 40 as the primary efficiency benchmark. The bar has risen — top-quartile private companies increasingly clear 45-50, not just 40.
Which KPI should a rep, not an executive, actually steer?
Qualified opportunities created per week and multi-threading count at stage three. These are the leading, controllable inputs a rep directly affects, and they predict bookings far better than call or email volume once you control for opportunity creation and deal quality.
What is a healthy NRR-to-GRR gap?
A gap of roughly 15-25 points is healthy — strong expansion sitting on a stable base. If NRR is high but GRR falls below 88%, expansion is masking churn, and the company is essentially buying back its own losses with upsell rather than genuinely retaining customers.
How should we forecast given agentic AI's effect on pipeline?
Run three layers: AI forecasting on weighted pipeline for the bottoms-up view, a segment-leader judgment forecast on top deals, and finance reconciliation against trailing eight-quarter actuals. When the AI and judgment forecasts diverge by more than 10%, that divergence is the signal to investigate first.
What is the fastest early warning of a coming bookings miss?
Pipeline coverage dropping below 3.0x at quarter start, combined with a declining four-quarter rolling win rate. Coverage alone can be gamed with low-quality pipeline, so pair it with weighted pipeline to see whether the coverage is real or cosmetic before you trust the forecast.
FAQ
Which KPI should a rep, not an executive, actually steer?
Qualified opportunities created per week and multi-threading count at stage three. These are the leading, controllable inputs a rep directly affects, and they predict bookings far better than call or email volume once you control for opportunity creation and deal quality.
What is a healthy NRR-to-GRR gap?
A gap of roughly 15-25 points is healthy — strong expansion sitting on a stable base. If NRR is high but GRR falls below 88%, expansion is masking churn, and the company is essentially buying back its own losses with upsell rather than genuinely retaining customers.
How should we forecast given agentic AI's effect on pipeline?
Run three layers: AI forecasting on weighted pipeline for the bottoms-up view, a segment-leader judgment forecast on top deals, and finance reconciliation against trailing eight-quarter actuals. When the AI and judgment forecasts diverge by more than 10%, that divergence is the signal to investigate first.
How do you measure agentic AI ROI without trusting vendor numbers?
Compare matched cohorts. Pull six months of bookings from reps with full tool adoption against a cohort without, controlling for tenure, segment, and territory. Measure ARR per rep, meetings per week, and opportunity-to-close conversion. If the adopted cohort is not 15% ahead on at least two, the tools are not paying back.
What is the fastest early warning of a coming bookings miss?
Pipeline coverage dropping below 3.0x at quarter start, combined with a declining four-quarter rolling win rate. Coverage alone can be gamed with low-quality pipeline, so pair it with weighted pipeline to see whether the coverage is real or cosmetic before you trust the forecast.
Why cohort NRR instead of reporting one company-wide number?
Because a healthy company-level NRR can hide dangerous concentration — if the top ten accounts drive most expansion, one downgrade can drop NRR from 122% to the mid-90s overnight. Cohorting by ACV band exposes whether expansion is broad-based or fragile.
What CAC payback period should a sales-led mid-market SaaS target?
Twelve to eighteen months is the healthy range for sales-led mid-market. Enterprise motions run 18-30 months, and product-led runs 6-14 months. Anything above 30 months for a sales-led motion usually signals an ICP that is too broad or per-rep productivity that has decayed.
How often should a CRO review the full KPI scorecard?
Daily for pipeline creation and at-risk deals, weekly for coverage and weighted pipeline, monthly for cohort NRR and Magic Number, and quarterly for Rule of 40 and full cohort tables. Mixing altitudes — asking a board to review daily activity — is how scorecards lose credibility and get ignored.
What pipeline coverage ratio is healthy in 2027?
The old 3x standard has crept to 3.5-4.0x because agentic-sourced pipeline converts at a lower per-opportunity rate. Healthy enterprise runs 4.0-5.0x because cycles span quarters. Layer pipeline-creation velocity on top — a static 4x that is stagnating is worse than a 3.2x growing 8% week over week.
Why does GRR matter more than NRR for some vertical SaaS companies?
Vertical SaaS with high switching costs often reaches 96-98% GRR because the product is embedded in a regulated workflow. In that context, GRR is the cleanest read on product stickiness, and a falling GRR signals a structural retention problem that expansion revenue cannot sustainably mask.
Sources
- https://www.bvp.com/atlas/state-of-the-cloud
- https://openviewpartners.com/expansion-saas-benchmarks/
- https://www.iconiqcapital.com/growth/insights
- https://www.gong.io/resources/
- https://www.clari.com/resources/
- https://www.salesforce.com/resources/research-reports/state-of-sales/
- https://6sense.com/resources/
- https://www.investor.datadoghq.com/
- https://ir.crowdstrike.com/
Related on PULSE
- [More sales kpis for commercial b2b saas rankings and buying guides](/knowledge)
- [PULSE Tools and calculators](/tools)
- [Everything on PULSE RevOps](/)
This page will be disappearing soon. Save it to your device for $1 — or read it free while it is here.
@Kory-White- · if Venmo asks, the last 4 of my number are 2012
 pulse-industry-kpisTop 10 Sales KPIs for Cybersecurity Software in 2027
 pulse-industry-kpisTop 10 Sales KPIs for Commercial Dialysis and Renal Care in 2027
 pulse-industry-kpisTop 10 KPIs for Physical Therapy Clinics in 2027
 pulse-industry-kpisTop 10 Sales KPIs for Commercial Office Supplies Distribution in 2027
 pulse-industry-kpisTop 10 KPIs for Preschools in 2027
 pulse-industry-kpisTop 10 Sales KPIs for Specialty Coffee Roasting & Wholesale in 2027
 pulse-industry-kpisTop 10 Sales KPIs for Industrial Automation and Robotics Integration in 2027
 pulse-industry-kpisTop 10 Sales KPIs for Industrial Bolting & Flange Joint Integrity Services in 2027
 pulse-industry-kpisTop 10 KPIs for Residential Cleaning Companies in 2027
 pulse-industry-kpisTop 10 Sales KPIs for Elevator and Escalator Service in 2027