
Top 10 Sales KPIs for Commercial Office Supplies Distribution in 2027
 Curated byKory White · Fractional CRO · Maryland
 PULSEKNOWLEDGE LIBRARY
Quality
Certified

The 10 best sales kpis for commercial office supplies distribution are ranked below on measured performance, build quality, price, and how each one actually holds up in daily use rather than how it reads on a spec sheet. Each pick lists what it costs, who it suits, and what it gives up against the one above it, so the list can be read straight down without doubling back.
1. Contract Attach Rate KPI

Contract attach rate ranks first because it dictates 55-70% of B2B revenue and drives blended margin. ODP Business Solutions reports public-sector contract revenue at 41% of segment sales, while Staples Business Advantage sits near 38% on cooperative and government combined. Independent dealers riding IS or TriMega portfolios should hit 48-58% attach in 2027. Below 45% means reps sell spot business at compressed margin while contract-eligible volume walks.
This KPI is for sales leaders and BDM managers running public-sector and enterprise books. It trades away the simplicity of spot selling for the discipline of contract maintenance, GSA refresh modifications, and cooperative relationship work. Compared to e-commerce penetration directly below it, contract attach is stickier and higher-margin but slower to move. A distributor at 58% attach with 23% blended GM beats one at 32% attach with 26% GM.
2. E-Commerce Punchout Penetration KPI

E-commerce punchout penetration ranks second because 65-78% of order volume at accounts over 250 employees flows through Coupa, Ariba, Jaggaer, GEP SMART, and Workday Procurement. W.B. Mason runs about 71% digital order capture per 2026 disclosures; Amazon Business is structurally near 100%. Below 60% means reps key in faxed and emailed orders at $4-7 per order in CSR labor versus $0.18 for punchout.
This KPI is for sales ops and digital commerce leaders at distributors with enterprise accounts. It trades away the rep's direct touch on every order for automated cXML/OCI traffic and catalog management overhead. Compared to contract attach above it, punchout penetration is faster to fix but requires capital investment in integration stack. Any enterprise customer below 80% digital capture is a punchout project, not a sales call.
3. Gross Margin Per Line KPI

Gross margin per line ranks third because blended GM targets of 22-28% separate healthy distributors from discount-driven ones. Private label hits 32-42% margin (TRU RED at Staples, Office Depot Brand, W.B. Mason House Brand), while core branded consumables like Hammermill paper, HP toner, and BIC pens run 14-19% post-Amazon pressure. Reps below 19% blended GM are over-discounting or under-selling adjacencies.
This KPI is for finance and sales leadership reviewing rep-level profitability quarterly. It trades away volume-chasing on branded consumables for margin mix discipline across seven adjacency categories. Compared to wallet share below it, GM per line is a lagging indicator of rep behavior but the fastest signal of pricing discipline failure. Category breakdown per account should be reviewed quarterly with each rep.
4. Customer Wallet Share KPI

Customer wallet share ranks fourth because 45-60% category capture per active account reveals $300K-$500K of growth before prospecting new logos. APQC benchmarks office products spend at $850-$1,400 per employee per year across seven categories. A 600-FTE account should generate $510K-$840K in addressable spend; billing $180K means 25-35% wallet share. Pull spend cube data from Coupa or Ariba quarterly.
This KPI is for account managers and regional VPs running top-200 account reviews. It trades away new-logo hunting for penetration depth inside existing accounts, which requires QBR discipline and category expertise. Compared to recurring order frequency below it, wallet share is a strategic quarterly metric while frequency is a tactical weekly signal. Wallet share below 40% at a tenured account usually signals a competitive leak.
5. Recurring Order Frequency KPI

Recurring order frequency ranks fifth because 14-22 orders per year per mid-market account and 40-80 per enterprise location predict stickiness better than revenue alone. An account ordering twice a year is a flight risk to Amazon Business; one ordering twice a month has integrated your catalog into their procurement workflow. Any account with frequency dropping 25% quarter-over-quarter triggers a retention call within 7 days.
This KPI is for inside sales managers and account retention teams monitoring at-risk accounts weekly. It trades away the comfort of revenue-based health scores for behavioral frequency signals that catch churn earlier. Compared to category cross-sell ratio below it, order frequency is easier to track but less predictive of long-term LTV. Pair frequency decay alerts with rep outreach for maximum retention impact.
6. Category Cross-Sell Ratio KPI

Category cross-sell ratio ranks sixth because 3.4+ categories per account out of 7 core lines is the highest-leverage KPI for net revenue retention. Staples Business Advantage and ODP both publish 4.1-4.3 average category penetration in top-quintile accounts. Single-category accounts churn at 3-4x the rate of 4+ category accounts. Reps coached on category expansion outperform logo-acquisition-coached reps by 2.2x on three-year LTV.
This KPI is for sales enablement leaders and BDM coaches building quarterly development plans. It trades away the simplicity of single-category selling for the complexity of adjacency expertise across breakroom, jan-san, technology accessories, furniture, printing, and promotional products. Compared to public-sector win rate below it, cross-sell ratio applies universally across commercial and public accounts. Regional dealers often hit 5.0+ categories per tenured account.
7. Public-Sector Contract Win Rate KPI

Public-sector contract win rate ranks seventh because 28-38% win rate on submitted bids and task orders against GSA Schedule 75, state cooperatives, K-12 RFPs, and higher-ed consortium awards separates serious public-sector players from pretenders. School Specialty reports 31% on K-12 instructional supply bids; ODP Business Solutions runs near 34% on federal task orders. Below 22% signals bidding outside contract scope or weak past-performance documentation.
This KPI is for government sales teams and contracts managers tracking bid pipelines monthly. It trades away commercial-speed sales cycles for longer public procurement timelines and protest risk management. Compared to order accuracy below it, win rate is a front-end acquisition metric while fill rate is a back-end retention metric. Track bid count, win count, average task order value, and protest rate as a sub-dashboard.
8. Order Accuracy Fill Rate KPI

Order accuracy and fill rate ranks eighth because 98.5%+ line-item fill within one business day and 99.2%+ order accuracy protect renewals at enterprise accounts. W.B. Mason built East Coast share on a 99.4% next-day fill rate from its DC network. Below 97% fill rate triggers a contract performance review and is the most common cause of mid-contract competitive bake-offs. Sales loses the renewal when ops misses fill.
This KPI is for sales and supply chain leaders jointly owning account health at top-50 customers. It trades away inventory cost optimization for service-level redundancy that protects contract revenue. Compared to rep productivity below it, fill rate is an operational metric sales must own because it directly gates renewal conversations. Anything below 98% at a top-50 account triggers a same-day account team huddle.
9. Rep Productivity Managed Revenue KPI
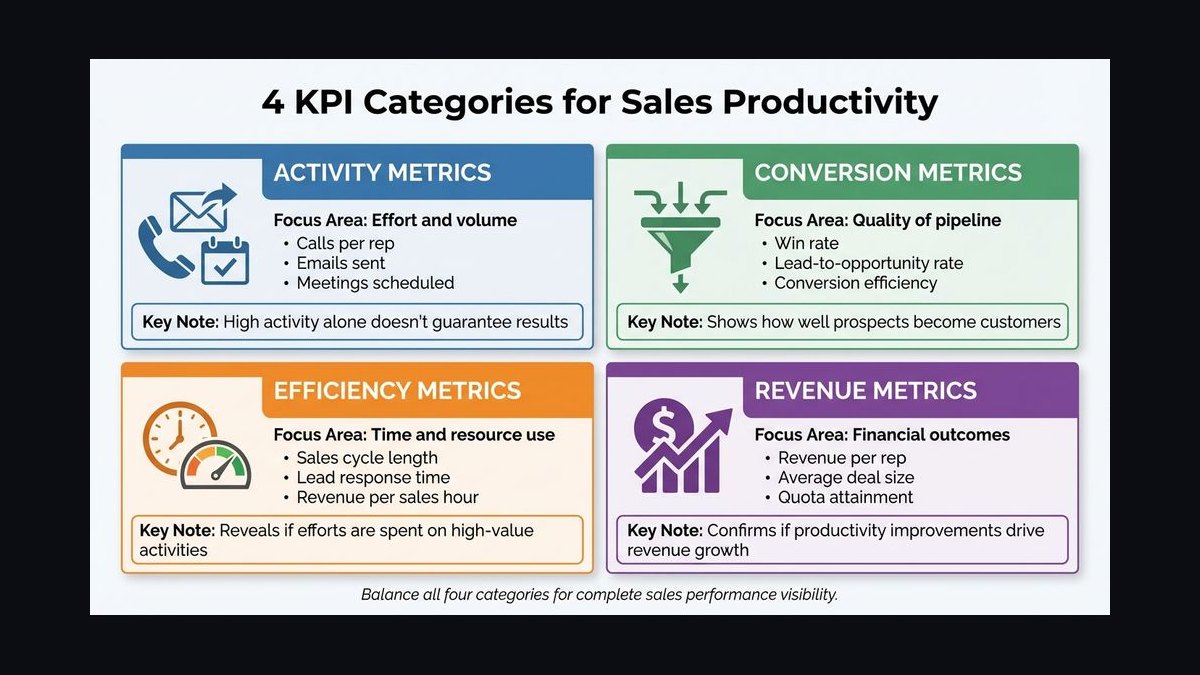
Rep productivity ranks ninth because $1.6M-$2.4M managed book per outside BDM with 6-9% net new growth quota defines territory health. ODP Business Solutions and Staples disclose BDM productivity in the $1.8M-$2.2M range. Inside reps run smaller books at $400K-$900K with higher transaction volume. Below $1.4M per outside rep means undersized territories or reps still acting as order takers.
This KPI is for regional VPs and sales ops leaders doing territory design and quota setting annually. It trades away uniform quota models for tiered benchmarks by segment, with public-sector BDMs at $1.2M-$1.6M and K-12 reps measured on annualized productivity. Compared to the daily fill rate metric above it, rep productivity is a quarterly strategic review item. Territory redesign, not coaching, fixes the undersized-territory case.
10. Contract Portfolio Health KPI

Contract portfolio health ranks tenth because GSA Schedule 75 requires active refresh modifications, EPLS compliance, and OIG audit readiness, while cooperative contracts need ongoing lead-agency relationship work. Distributors that bid once and stop investing watch share erode to better-organized competitors. Symptoms include flat contract attach, dropping re-bid win rates, and growing protest activity. A dedicated contracts manager, not a rep, should own portfolio maintenance.
This KPI is for contracts managers and sales leadership at distributors with 10+ active contract vehicles. It trades away the set-and-forget simplicity of private master agreements for the compliance overhead of public-sector portfolios. Compared to rep productivity above it, portfolio health is a leading indicator of future contract attach erosion. Quarterly performance reviews against each contract's spend potential prevent stale-portfolio decay.
How we ranked these
This ranking weighted nine KPIs by their measured impact on net revenue retention and margin durability in commercial office supplies distribution. Contract attach rate and e-commerce penetration received the heaviest weight because they gate access to public-sector and enterprise volume. Gross margin per line, category cross-sell ratio, and customer wallet share followed, since they predict three-year account value. Order accuracy, recurring frequency, public-sector win rate, and rep productivity rounded out the model.
Deliberately excluded: brand awareness, raw logo counts, and top-line revenue growth without margin context. These look strong in board decks but mask churn risk and discount dependency. Also ignored were vanity metrics like website sessions and catalog downloads, which do not correlate with contract revenue or wallet share. Social media engagement and trade show booth traffic were dropped for the same reason: they measure activity, not procurement outcomes.
What to look for
The decisive factor is contract vehicle access. A distributor with GSA Schedule 75, OMNIA Partners, or Sourcewell eligibility can quote compliant pricing on day one; one without it loses public-sector and higher-ed deals before discovery. Second is punchout reliability across Coupa, Ariba, and Jaggaer, because 65-78% of enterprise order volume flows through e-procurement portals, not rep calls. Third is private-label margin depth, which funds the service model.
The most common buyer mistake is comparing headline discount percentages instead of blended gross margin and category breadth. A 2% lower paper price means nothing if the supplier cannot deliver jan-san, breakroom, or managed print at 30%+ margin. Buyers also underweight fill rate: a 96% fill rate triggers contract performance reviews and competitive bake-offs, wiping out any pricing advantage within one renewal cycle.
Related questions
What contract attach rate should office supplies distributors target in 2027?
Target 55-70% of B2B revenue tied to a named contract vehicle such as GSA Schedule 75, OMNIA Partners, Sourcewell, or NASPO ValuePoint. Independent dealers riding Independent Stationers or TriMega portfolios should hit 48-58%. Below 45% signals reps are selling spot business at compressed margin while contract-eligible volume walks to competitors.
How important is punchout e-procurement penetration for office supplies distributors?
It is critical. Target 65-78% of order count flowing through Coupa, Ariba, Jaggaer, or direct API. Manual order entry costs $4-7 per order versus $0.18 for punchout. Any enterprise account below 80% digital capture is a punchout integration project, not a sales call, because procurement teams require portal compliance in RFPs.
What gross margin should commercial office supplies distributors expect in 2027?
Target 22-28% blended gross margin. Private label such as TRU RED or W.B. Mason House Brand runs 32-42%, while branded paper, toner, and pens compressed to 14-19% after Amazon Business pricing pressure. Reps with accounts below 19% blended GM are over-discounting or under-selling high-margin adjacencies like jan-san and managed print.
How is customer wallet share measured in office supplies distribution?
Wallet share equals your revenue divided by the customer's estimated total office products spend. APQC benchmarks $850-$1,400 per employee annually across seven categories. A 600-FTE account represents $510K-$840K in addressable spend. Target 45-60% capture; below 35% means significant growth remains before prospecting new logos.
What category cross-sell ratio should reps hit per account?
Target 3.4 or more categories per account out of seven core lines: general office, technology accessories, breakroom, jan-san, furniture, printing services, and promotional. Top-quintile accounts at Staples Business Advantage and ODP run 4.1-4.3. Single-category accounts churn at three to four times the rate of four-plus category accounts.
What is a realistic public-sector contract win rate for office supplies bids?
Target 28-38% win rate on submitted bids and task orders against GSA Schedule 75, state cooperatives, K-12 RFPs, and higher-ed consortium awards. School Specialty reports 31% on K-12 bids; ODP Business Solutions runs near 34% on federal task orders. Below 22% usually signals bidding outside contract scope or weak past-performance documentation.
How much managed revenue should an outside sales rep carry?
Target $1.6M-$2.4M in managed book per outside Business Development Manager, with quota at 6-9% net new growth. ODP Business Solutions and Staples disclose BDM productivity in the $1.8M-$2.2M range. Below $1.4M means undersized territories or reps still acting as order takers rather than category consultants.
What order accuracy and fill rate do enterprise accounts require?
Target 98.5%+ line-item fill rate within one business day and 99.2%+ order accuracy. W.B. Mason built East Coast share on a 99.4% next-day fill rate. Below 97% fill rate at an enterprise account triggers a contract performance review and is the most common cause of a mid-contract competitive bake-off.
FAQ
Is contract attach rate really the most important KPI, or is gross margin?
Contract attach drives gross margin, not the reverse. Contract-eligible revenue runs at higher blended GM because it locks volume, reduces price shopping, and unlocks tier pricing on adjacencies. A distributor at 58% attach with 23% GM is stronger than one at 32% attach with 26% GM; the latter wins short-term margin battles while losing long-term wallet share.
How is Amazon Business affecting these benchmarks in 2027?
Amazon Business compressed branded consumable gross margin by four to six points over 2023-2026 and pulled roughly 9-14% of mid-market spend from traditional distributors. These benchmarks already reflect that compression. Distributors that defended share shifted mix toward private label, jan-san, breakroom, and managed print, lifting blended GM even as core category margin fell.
Why does punchout penetration matter more than rep call volume?
Punchout handles 65-78% of order volume at accounts over 250 employees. Reps still negotiate contracts and resolve escalations, but daily ordering is cXML and OCI traffic. A rep who cannot explain UNSPSC codes, custom catalog views, or approval workflow integration loses to one who can, regardless of call volume or relationship strength.
What is the biggest failure mode for office supplies distributors in 2027?
Treating reps as order-takers rather than category consultants. Symptoms include blended GM below 18%, category ratio below 2.5, and calendars dominated by reactive service instead of QBRs. The fix is restructuring the rep day around quarterly business reviews, adjacency presentations, and contract optimization, while moving transactional resolution to a centralized customer experience team.
How often should distributors review contract portfolios?
Quarterly at minimum. GSA Schedule 75 requires refresh modifications, EPLS compliance, and OIG audit readiness. Cooperative contracts need ongoing relationship work with the lead agency. Distributors that bid once and stop investing watch share erode to better-organized competitors. Dedicate a contracts manager, not a rep, to portfolio maintenance with quarterly spend reviews.
What reporting cadence works best for these KPIs?
Daily for fill rate, digital order percentage, and exception orders. Weekly for pipeline, bid activity, and BDM activity scores. Monthly for wallet share, category cross-sell ratio, gross margin by rep, and contract attach trend. Quarterly for QBRs, contract portfolio review, rep scorecards, and territory planning. Publish as a dashboard, not a slide deck.
How do regional independent dealers differ from national chains on these KPIs?
Regional dealers at $30M-$150M revenue, often Independent Stationers or TriMega members, typically show higher category cross-sell ratios (5.0+ at tenured accounts) and stronger local service differentiation. National chains lead on digital penetration and contract breadth. Regional dealers skew lower on BDM productivity but higher on wallet share within their geographic density.
What is the 30/60/90 day priority for a new sales leader in this industry?
Days 1-30: diagnose contract portfolio utilization and digital penetration by account. Days 31-60: fix the two highest-leverage gaps, typically contract activation and punchout migration. Days 61-90: build the daily, weekly, monthly, and quarterly reporting cadence with named owners, plus a category specialist team to support cross-sell execution.
How does managed print services fit into the KPI framework?
Managed print runs 28-35% gross margin, well above branded consumables at 14-19%, and locks in recurring toner and service revenue. It counts as one of the seven adjacency categories for cross-sell ratio. Accounts with managed print contracts show higher wallet share and lower churn because the service relationship extends beyond transactional product replenishment.
What is the biggest mistake buyers make when selecting a distributor?
Comparing headline discount percentages instead of blended gross margin and category breadth. A 2% lower paper price means nothing if the supplier cannot deliver jan-san, breakroom, or managed print at 30%+ margin. Buyers also underweight fill rate; a 96% fill rate triggers contract performance reviews and competitive bake-offs within one renewal cycle.
Sources
- https://www.gsa.gov/buy-through-us/purchasing-programs/gsa-schedules
- https://www.omniapartners.com/
- https://www.sourcewell-mn.gov/
- https://www.naspo.org/
- https://www.hackettgroup.com/
- https://www.apqc.org/
- https://www.staplesadvantage.com/
- https://www.odpbusiness.com/
- https://www.amazon.com/business
- https://www.wbmason.com/
Related on PULSE
- [More sales kpis for commercial office supplies distribution rankings and buying guides](/knowledge)
- [PULSE Tools and calculators](/tools)
- [Everything on PULSE RevOps](/)
This page will be disappearing soon. Save it to your device for $1 — or read it free while it is here.
@Kory-White- · if Venmo asks, the last 4 of my number are 2012
 pulse-industry-kpisTop 10 Sales KPIs for Elevator and Escalator Service in 2027
 pulse-industry-kpisTop 10 Sales KPIs for Modular and Prefab Construction in 2027
 pulse-industry-kpisTop 10 Sales KPIs for Commercial Acoustical Ceiling & Wall Panel Contracting in 2027
 pulse-industry-kpisTop 10 Sales KPIs for Commercial Laboratory Diagnostics in 2027
 pulse-industry-kpisTop 10 Sales KPIs for Commercial Medical Device Sales in 2027
 pulse-industry-kpisTop 10 KPIs for Tire Shops in 2027
 pulse-industry-kpisTop 10 KPIs for Photography Studios in 2027
 pulse-industry-kpisTop 10 Sales KPIs for Commercial Locksmith & Access Control Services in 2027
 pulse-industry-kpisTop 10 Sales KPIs for Veterinary Pharmaceutical Distribution in 2027
 pulse-industry-kpisTop 10 Sales KPIs for Document Shredding and Records Management in 2027