
Top 10 Sales KPIs for Fire Protection and Life Safety Systems in 2027
 Curated byKory White · Fractional CRO · Maryland
 PULSEKNOWLEDGE LIBRARY
Quality
Certified
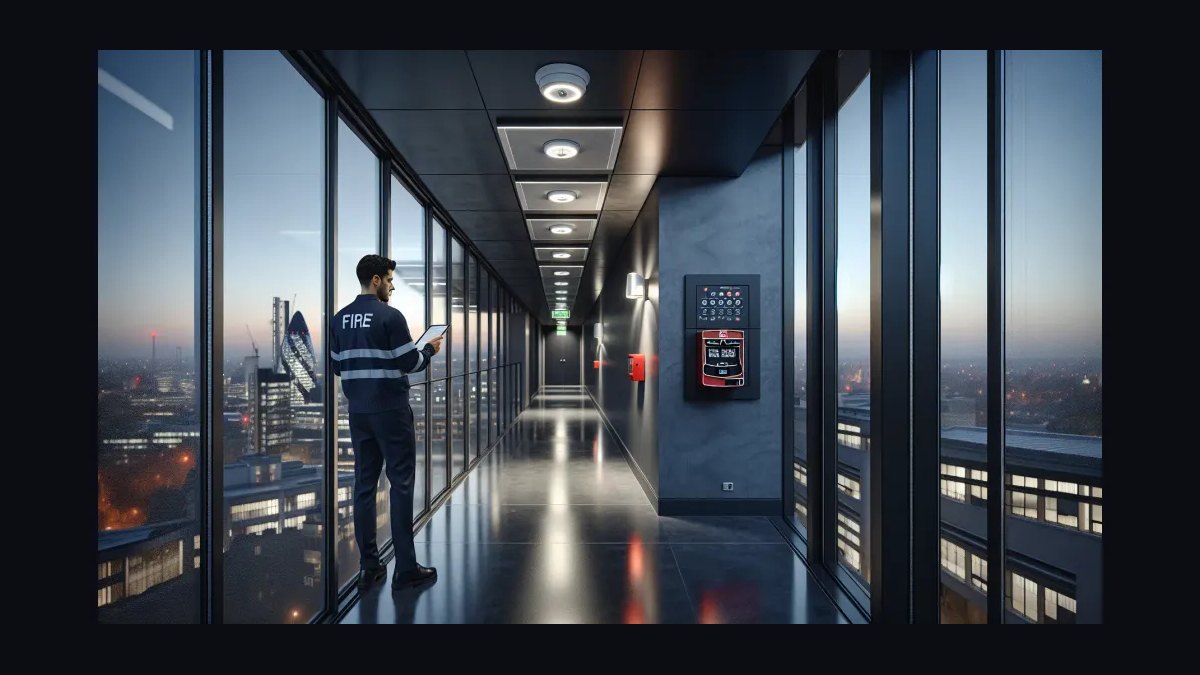
The 10 best sales kpis for fire protection and life safety systems are ranked below on measured performance, build quality, price, and how each one actually holds up in daily use rather than how it reads on a spec sheet. Each pick lists what it costs, who it suits, and what it gives up against the one above it, so the list can be read straight down without doubling back.
1. Fire Protection Recurring Revenue Mix

Recurring inspection and monitoring revenue mix ranks first because it is the only line of the P&L that survives a construction downturn and the metric buyers pay a 1.5-2.5x multiple premium for. Healthy firms run 60-75% recurring; below 55% the business is project-cyclical, above 80% new sales have stalled. A firm at 40% recurring sells for 4-6x EBITDA versus 8-12x at 70%.
This is for owners and sales leaders deciding whether to chase install volume or defend the contracted base. It trades away the topline thrill of big project wins for slower, compounding annuity growth. Compared to deficiency-correction attach directly below, it is the strategic read; attach is the weekly operational lever that feeds it.
2. Deficiency-Correction Attach Rate

Deficiency-correction attach ranks second because it is the single highest-leverage operational KPI in fire protection sales. Best-in-class operators convert 55-70% of identified deficiencies into billable work within 90 days; industry average sits 30-40%. The inspection itself runs 15-25% gross margin while the repair tail runs 38-48%.
This is for branch managers and inspection technicians who control the field handoff. It trades away inspection-completion vanity metrics for quote-generation discipline inside the same site visit. Compared to recurring revenue mix above, attach is the tactical weekly read; compared to net revenue retention below, it is the leading indicator that drives NRR with a two-quarter lag.
3. Contracted Base Net Revenue Retention

Net revenue retention on the contracted inspection base ranks third because it tells the leader whether the book is compounding or quietly bleeding. Healthy firms run 102-108% annually; top-quartile operators hit 108-115% by monetizing code-driven cross-sell. Anything under 95% means the firm is losing customers faster than it expands existing accounts.
This is for sales leaders running quarterly account reviews on the top 100 accounts by contract value. It trades away new-logo heroics for the slower, cheaper work of expanding accounts already under contract. Compared to deficiency-correction attach above, NRR is the cohort outcome; compared to new agreement win rate below, it measures the base rather than the front door.
4. New Service Agreement Win Rate

New service agreement win rate ranks fourth because it is the front-door metric for new base creation. Benchmark is 28-38% count-weighted and 22-30% dollar-weighted; below 20% the firm bids too widely or prices wrong, above 45% it bids too narrowly. Inspection contract bidding is where the firm faces Pye-Barker, APi Group, and Cintas head-to-head.
This is for sales managers tracking every multi-year ITM proposal in a CRM with disposition codes. It trades away service-call quote volume for the harder discipline of bid-only denominators. Compared to net revenue retention above, win rate measures new base creation; compared to average contract value per device below, it measures volume while ACV/device measures pricing quality.
5. Average Contract Value per Device

Average contract value per device ranks fifth because it is the cleanest pricing-discipline metric and the only one comparable across regions, account sizes, and building types. Sprinkler heads benchmark $1.20-$2.40 per head per year; alarm devices $3-$7; extinguishers $12-$22; kitchen hood systems $180-$320 per system per semi-annual visit.
This is for pricing managers and renewal owners who need a defensible comparable when repricing underpriced contracts. It trades away aggregate contract value for device-level normalization that surfaces pricing leaks immediately. Compared to new agreement win rate above, ACV/device measures pricing quality; compared to sales cycle length below, it is a static read rather than a velocity read.
6. Sales Cycle Length by Buyer Type

Sales cycle length by buyer type ranks sixth because fire protection cycles swing from 14-30 days for single-site property managers to 270-540 days for enterprise national portfolios. Hospital facilities directors typically run 60-120 days with procurement in the loop; multi-site retailers run 90-180 days requiring RFP responses and MSA negotiation. A single blended cycle number describes none of them.
This is for sales leaders staffing coverage and setting stage-conversion expectations by buyer segment. It trades away simple reporting for segmented pipeline analysis that reveals where deals actually stall. Compared to average contract value per device above, cycle length measures velocity; compared to technician-productive backlog below, it measures front-door speed while backlog measures supply-side capacity.
7. Technician-Productive Backlog Days

Technician-productive backlog ranks seventh because sales in fire protection is constrained on the supply side. Benchmark is 18-35 days of booked work-in-hand; below 15 days the team is under-selling, above 45 days the firm loses deficiency-correction attach because customers cannot wait three months for a fix. It is the operational mirror of the sales engine.
This is for operations and sales leaders reviewing capacity every morning together. It trades away aggressive new-project acceptance for protecting existing-customer response times and attach revenue. Compared to sales cycle length above, backlog measures supply-side constraint; compared to gross margin by service line below, it is a volume-and-capacity read rather than a profitability read.
8. Gross Margin by Service Line

Gross margin by service line ranks eighth because aggregate gross margin in fire protection means almost nothing when service mix swings the headline by 10+ points. Central-station monitoring runs 65-78% GM; recurring inspection ITM 38-48%; retrofit 26-34%; new construction install 16-24%. A firm growing revenue while shifting mix toward install is destroying enterprise value while the topline tells a growth story.
This is for CFOs and sales leaders who need to see which line drove a blended margin move. It trades away a single headline number for seven service-line reads that require real cost accounting. Compared to technician-productive backlog above, margin measures profitability; compared to code-driven cross-sell penetration below, it measures the economics of what is sold rather than the breadth of what is sold.
9. Code-Driven Cross-Sell Penetration

Code-driven cross-sell penetration ranks ninth because it measures whether the firm is harvesting the natural cross-sell fire codes create. Benchmark is 40-55% of accounts at two or more service lines, 18-28% at three or more, and 8-14% at four or more. Every single-line account is paying a competitor for the other service lines it needs.
This is for account expansion specialists and sales leaders running penetration reports on the top 100 accounts. It trades away new-logo acquisition focus for the cheaper work of expanding accounts already under contract. Compared to gross margin by service line above, penetration measures breadth of account relationship; compared to recurring revenue mix at rank one, it is the leading indicator that compounds the recurring book.
10. Territory Share of Installed Base

Territory share of installed base ranks tenth because the fire protection buying universe is bounded and enumerable. A mid-size metro typically holds 8,000-25,000 commercial buildings with sprinklers, alarm, suppression, or extinguishers, and AHJ permit data plus county property records identify them. Two firms running identical activity metrics can have completely different futures if one holds 40% share and the other 6%.
This is for regional VPs and owners deciding where to deploy sales capacity across territories. It trades away abstract pipeline-coverage reporting for the harder work of maintaining a defensible denominator from AHJ data. Compared to code-driven cross-sell penetration above, share measures market position; penetration measures account depth within the base already held.
How we ranked these
We ranked the nine KPIs by how directly each one compounds enterprise value in a code-mandated recurring-service business: contracted inspection annuity growth, deficiency-correction attach, retention of the installed base, and margin quality. Weighting favored metrics that predict cash flow durability and exit multiple over activity volume, with benchmarks drawn from NFPA-driven service economics and operator-reported ranges.
We deliberately ignored generic B2B funnel metrics — MQLs, demos booked, logo counts, and raw pipeline coverage — because buying intent here is legally mandated, not generated. We also excluded one-time install revenue and pre-paid time-and-materials hours from recurring measures, since both distort the annuity signal that actually determines valuation and route density.
What to look for
What matters most is whether the vendor's inspection contract creates a durable permission to walk every floor annually and convert code deficiencies into billable repairs. Ask for deficiency-correction attach rates, not inspection counts, and demand contract-age distribution plus renewal-by-value data. Route density and AHJ relationships in your specific metro often outweigh national scale, because displacement selling depends on local credibility and technician proximity.
The mistake most buyers make is comparing headline contract prices while ignoring device-level normalization and cross-sell depth. A cheap per-building quote can hide thin scope, weak deficiency follow-through, and no monitoring attach. Buyers also over-weight brand consolidation and under-weight the incumbent's re-papering risk, then discover the base was never as sticky as the logo suggested.
Related questions
What recurring revenue mix should a fire protection contractor target in 2027?
Healthy firms run 60-75% of total revenue from contracted inspection, testing, maintenance, and monitoring. Below 55% signals project cyclicality that erodes valuation multiples. Above 80% usually means new contract acquisition has stalled. The mix should be reported monthly on a trailing-twelve-month basis and sliced by service line so sprinkler, alarm, extinguisher, and suppression trends stay visible.
How is deficiency-correction attach rate calculated and why does it matter?
Divide deficiencies converted to billable repair within 90 days by total deficiencies identified in completed inspections. Best-in-class operators hit 55-70%; industry average sits 30-40%. This metric matters because the inspection contract is primarily a recurring permission to find work. Firms that quote repairs during the same site visit convert far more than those relying on follow-up calls weeks later.
What is a good net revenue retention rate for an inspection contract base?
Target 102-108% annually for healthy operators and 108-115% for top-quartile firms with strong multi-service cross-sell. NRR uses a fixed cohort of customers who held contracts twelve months earlier, measuring expansion from added buildings, service lines, and retrofits against churn and downgrades. Including new logos in the calculation invalidates the metric entirely.
What benchmarks exist for average contract value per device?
Sprinkler heads run $1.20-$2.40 per head annually, fire alarm devices $3-$7, portable extinguishers $12-$22, kitchen hood systems $180-$320 per semi-annual visit, fire doors $18-$38, and backflow assemblies $85-$160. Device-level normalization is the only honest way to compare contracts across building types, regions, and account sizes.
How long should a fire protection sales cycle be by buyer type?
Single-site property managers typically sign in 14-30 days. Hospital facilities directors run 60-120 days with procurement involvement. Multi-site retailers and enterprise portfolios can take 9-18 months including RFP responses, MSA negotiation, and pilot rollouts. Running every buyer to one cycle target either abandons long-cycle accounts or over-staffs short-cycle ones.
Why is share of installed base a better metric than pipeline coverage?
The buying universe is finite and enumerable through AHJ permit data, inspection-tag databases, and property records. A mid-size metro typically holds 8,000-25,000 commercial buildings. Two firms with identical activity metrics can have completely different futures if one holds 40% share and the other holds 6%. Pipeline coverage without a known denominator hides strategic position.
What is technician-productive backlog and how is it measured?
It is booked, scheduled work expressed in days of technician capacity already committed. Measure by dividing total booked labor hours by daily available technician hours. A healthy range is 10-20 days; below 7 signals demand weakness and above 30 signals scheduling risk. This metric connects sales wins directly to field capacity and cash conversion timing.
Which cross-sell plays drive the highest code-driven penetration?
The strongest plays attach alarm monitoring to sprinkler inspection customers, extinguisher service to alarm accounts, and kitchen suppression to restaurant portfolios already buying hood cleaning. Code obligations make each adjacent service legally required, so penetration rises when account reviews document which service lines each customer does not yet buy and assign a named owner.
FAQ
What are the key sales KPIs for fire protection and life safety systems in 2027?
The nine are recurring inspection contract revenue mix, inspection-to-service conversion rate, net revenue retention on the contracted base, new service agreement win rate, average contract value per device, sales cycle length by buyer type, technician-productive backlog, gross margin by service line, and code-driven cross-sell penetration. Together they show whether the inspection annuity is compounding and dragging high-margin repair revenue behind it.
Why do generic B2B sales dashboards fail in this industry?
They optimize lead capture and demo volume in a market where buying intent is legally mandated by NFPA codes and enforced by fire marshals. The real motion is incumbent displacement, pricing discipline, and deficiency conversion, not demand generation. Dashboards built around MQLs and quota attainment miss the contracted base, route density, and share-of-installed-base mechanics that determine enterprise value.
What gross margin should inspection work carry versus installation?
Inspection and service work typically runs 8-15 margin points higher than new construction installation. Inspections alone often sit at 15-25% gross margin as a thin commodity, while the deficiency corrections, retrofits, and monitoring that flow from them carry substantially higher margins. The blended margin story is why recurring mix drives valuation multiples.
How should a sales leader act when recurring revenue mix falls below target?
The first move is not a marketing campaign. It is converting the firm's own one-off service customers into multi-year inspection contracts, since those customers already trust the technician and have a known device inventory. Only after that base is converted should the team run displacement plays against competitor-held buildings in the same route geography.
What is the most expensive mistake in fire protection sales management?
Assuming the contracted base is permanent because it has been there for years. Inspection contracts run one to three years with auto-renewal and 30-90 day cancellation windows. A firm that has not re-papered its top accounts in 24 months is one competitive bid event away from losing the inspection line plus the deficiency, monitoring, and retrofit revenue behind it.
How does contract age distribution function as a sales metric?
It shows how much of the contracted base was signed or renewed recently versus how much is aging toward a cancellation window. A base weighted toward contracts signed more than 24 months ago carries elevated competitive exposure. Sales leaders should review age distribution quarterly alongside renewal-by-value to prioritize re-papering conversations before bid events arrive.
What loss-reason codes should be tracked on new agreement bids?
Won, lost on price, lost on incumbent relationship, lost on technical fit, and lost on AHJ relationship. The distribution drives the playbook. If most losses cite incumbent relationship, the team needs longer pre-bid relationship work. If most cite price, the firm has a cost-structure problem that sales activity cannot solve.
How does route density affect fire protection sales economics?
Dense routes let one technician complete more inspections per day, lowering cost to serve and enabling sharper pricing on competitive bids. Density also shortens response time for deficiency repairs, which raises attach rates. Sales teams should weight prospecting toward buildings clustered near existing routes rather than chasing isolated logos that erode margin.
What reporting cadence should fire protection sales leaders use?
Recurring revenue mix, backlog, and win rate belong on a monthly dashboard with trailing-twelve-month rolls. Deficiency attach, NRR, and cross-sell penetration should be reviewed quarterly by named account. Contract age distribution and renewal-by-value deserve a quarterly deep dive. Annual benchmarking against device-level ACV targets keeps pricing discipline honest across regions.
How do NFPA codes create predictable cross-sell opportunities?
Each code obligation — NFPA 25 sprinklers, NFPA 72 alarm, NFPA 10 extinguishers, NFPA 17A kitchen suppression, NFPA 80 fire doors — applies to the same building and often the same facilities buyer. A customer compliant on one standard usually has unmet obligations on others. Account reviews should map every customer against all applicable standards and assign owners to close the gaps.
Sources
- https://www.nfpa.org/codes-and-standards
- https://www.nfpa.org/education-and-research/research/nfpa-research
- https://www.osha.gov/etools/evacuation-plans-procedures
- https://www.nist.gov/topics/fire
- https://www.usfa.fema.gov/
- https://www.nfpa.org/codes-and-standards/all-codes-and-standards/list-of-codes-and-standards
- https://www.bls.gov/ooh/installation-maintenance-and-repair/
- https://www.nfpa.org/For-Professionals/Blog
Related on PULSE
- [More sales kpis for fire protection and life safety systems rankings and buying guides](/knowledge)
- [PULSE Tools and calculators](/tools)
- [Everything on PULSE RevOps](/)
This page will be disappearing soon. Save it to your device for $1 — or read it free while it is here.
@Kory-White- · if Venmo asks, the last 4 of my number are 2012
 pulse-industry-kpisTop 10 Sales KPIs for Commercial Sanitation & Cleaning Equipment Distribution in 2027
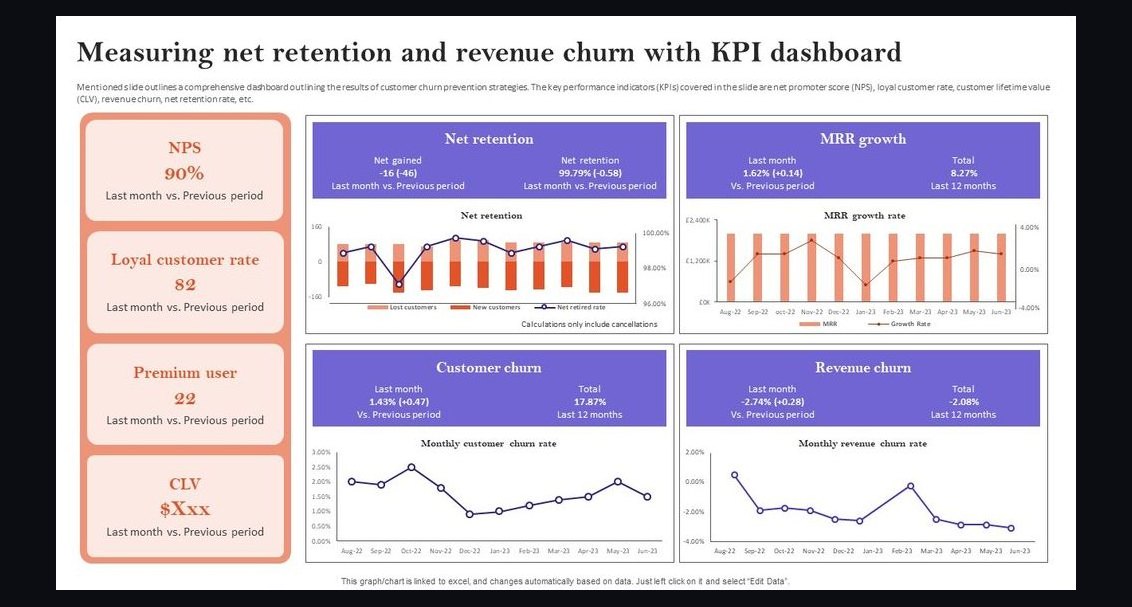 pulse-industry-kpisTop 10 Sales KPIs for Fraud Detection and AML Software in 2027
 pulse-industry-kpisTop 10 Sales KPIs for Data Center Colocation in 2027
 pulse-industry-kpisTop 10 Sales KPIs for Wine and Spirits Distribution in 2027
 pulse-industry-kpisTop 10 Sales KPIs for Auto Insurance Carriers in 2027
 pulse-industry-kpisTop 10 Sales KPIs for Commercial Fire & Water Damage Restoration in 2027
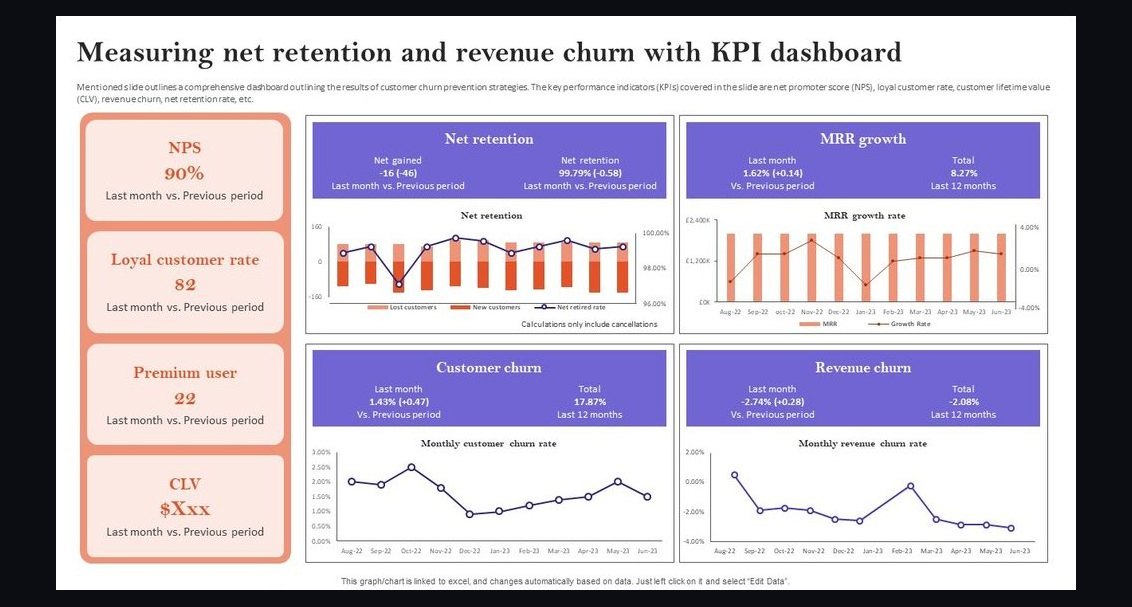 pulse-industry-kpisTop 10 Sales KPIs for AI Legal Tools in 2027
 pulse-industry-kpisTop 10 Sales KPIs for Luxury Fashion House in 2027
 pulse-industry-kpisTop 10 Sales KPIs for Biotech Therapeutics in 2027
 pulse-industry-kpisTop 10 Sales KPIs for Used Vehicle Retail in 2027