
Top 10 Sales KPIs for Oilfield Services in 2027
 Curated byKory White · Fractional CRO · Maryland
 PULSEKNOWLEDGE LIBRARY
Quality
Certified

The 10 best sales kpis for oilfield services are ranked below on measured performance, build quality, price, and how each one actually holds up in daily use rather than how it reads on a spec sheet. Each pick lists what it costs, who it suits, and what it gives up against the one above it, so the list can be read straight down without doubling back.
1. Fleet Utilization Rate
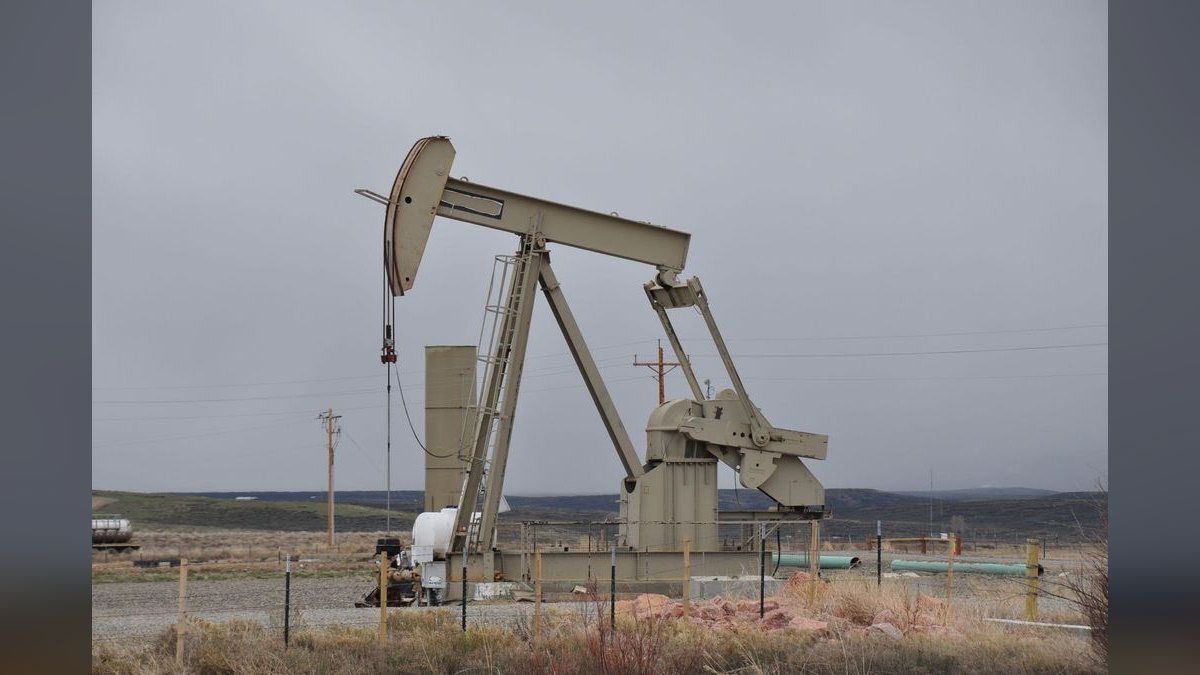
Fleet utilization ranks first because oilfield services is fundamentally a capital-utilization business, and stranded iron destroys more value than soft pricing ever will. A modern frac fleet costs $50-70M, and the breakeven utilization threshold sits near 60-65% of available days; super-spec drilling rigs need 70-75%. Liberty Energy and ProPetro both ran 85%+ utilization through strong 2024-2025 cycles, while sub-65% fleets stack crews and write down assets.
This KPI is for sales VPs, CROs, and CFOs managing capital-intensive fleets where every incremental utilized day beats any price concession. It trades away pricing discipline for volume when utilization drops below breakeven, which is the right call only short-term. Compare it directly to Day Rate or Stage Price below: utilization keeps the iron earning, but without realized-price discipline the revenue line still leaks.
2. Day Rate or Stage Price
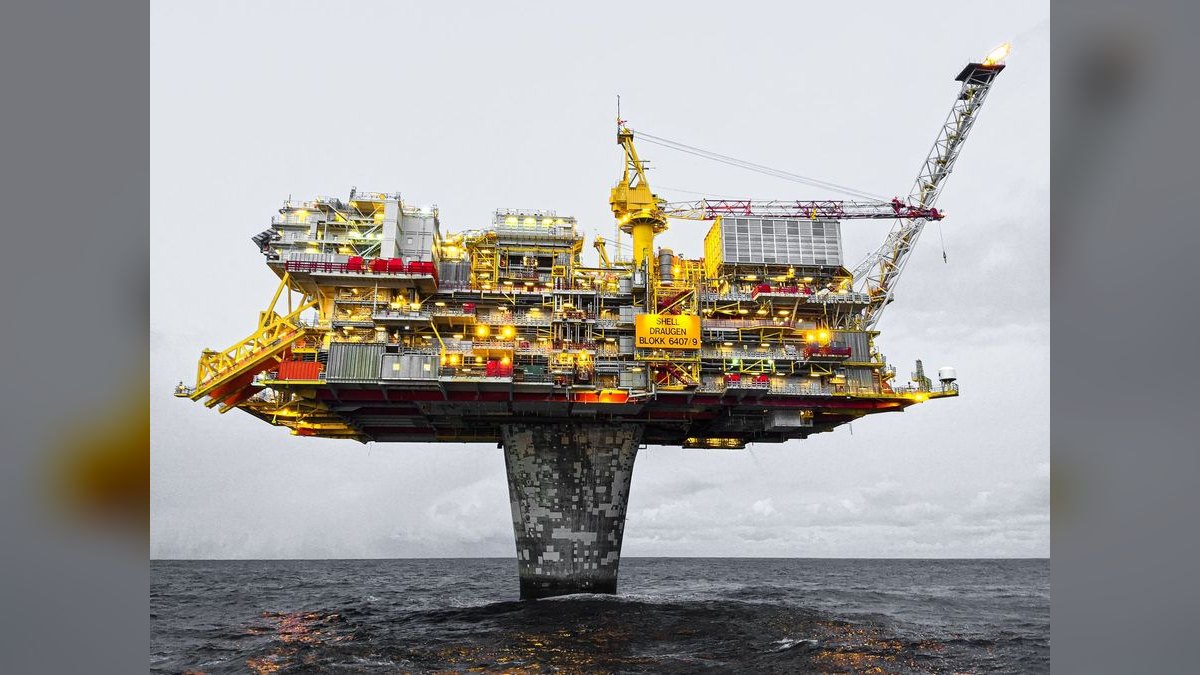
Day rate and stage price rank second because they convert utilization into actual revenue dollars, and the gap between bid price and realized price is one of the most under-reported leaks in oilfield services sales. Frac stage pricing ran $180-210K at the 2023 peak, compressed to $135-160K through 2025, and bounced into the $150-185K range across 2026.
This KPI is for sales leaders and pricing analysts who need to track what actually shows up on the invoice after fuel pass-throughs, crew bonuses, mob/demob, and quiet discounts. It trades away list-price defense for realized-price discipline, which is the harder but correct position. Compare it to Fleet Utilization Rate above: utilization keeps the asset earning, but realized price determines whether that earning actually covers the capex.
3. Backlog Coverage Months

Backlog coverage ranks third because it is the single clearest signal of revenue visibility and cycle exposure in oilfield services. Signed work-orders and committed take-or-pay volume divided by monthly revenue run-rate should sit at 6-9 months for healthy coverage; 3-4 months means spot-selling exposure, and 12+ months risks locking in pricing that looks bad if the cycle rips.
This KPI is for sales operations and finance teams who need to distinguish real revenue visibility from concentration risk wearing a coverage costume. It trades away pricing flexibility for revenue certainty, which is the right call in a softening strip but the wrong one in a tightening market. Compare it to Day Rate or Stage Price above: backlog locks volume, but realized price determines whether that locked volume is profitable.
4. Win Rate Bid Tenders

Win rate on bid tenders ranks fourth because it is the cleanest measure of whether the sales org is actually competing in its sweet spot or wasting proposal cycles. Healthy benchmarks run 25-35% at majors like Exxon and Chevron, 35-50% at large independents like Devon and EOG, and 50%+ at private E&Ps where relationships dominate. Anything below 15% sustained means the tendering team is bidding outside its capability or the technical proposal is losing on evaluation.
This KPI is for sales managers and bid teams who need to track close-loss reasons in the CRM by price, technical, schedule, HSE, and incumbent. It trades away volume of submissions for quality of targeting, which is the right discipline once the pipeline is properly segmented. Compare it to Backlog Coverage Months above: win rate measures the front end of the funnel, while backlog measures what actually converted into signed revenue.
5. Operator Concentration Top-5

Operator concentration ranks fifth because the 2014-2016 downturn killed several mid-size service companies whose top customer represented 30%+ of revenue and cut spend by 60% in two quarters. A 40-55% top-5 concentration is typical and acceptable in oilfield services, but 60%+ is a red flag, especially with a single operator above 20%. SLB's top customer sits under 10% of revenue, while Liberty Energy ran roughly 45% top-5 concentration through 2024-2025.
This KPI is for CROs and boards who need to see concentration risk monthly with a basin-and-operator heat map rather than discovering it annually. It trades away relationship depth with anchor customers for portfolio diversification, which is the right trade in a cyclical business. Compare it to Basin Mix Exposure below: operator concentration measures customer-side risk, while basin mix measures geography-side risk.
6. Basin Mix Exposure

Basin mix exposure ranks sixth because a 75%+ Permian revenue mix means running a single-basin business with single-basin risk, even if the Permian is roughly 50-55% of US onshore activity in 2026-2027. The Haynesville swings on Henry Hub strip, the Bakken is rail-takeaway constrained, and the Marcellus is permitting-bound, so each basin carries a different commodity and infrastructure risk profile.
This KPI is for strategy and sales leadership teams who need to see revenue distribution across Permian, Eagle Ford, Bakken, Haynesville, Marcellus, DJ, Anadarko, Powder River, Uinta, and international. It trades away basin-specific operating depth for geographic diversification, which is the right call once a single basin crosses 60% of revenue. Compare it to Operator Concentration Top-5 above: basin mix measures geographic risk, while operator concentration measures customer risk.
7. Days Sales Outstanding
Days sales outstanding ranks seventh because cash collections is a sales KPI, not just a finance KPI, since the sales team negotiated the payment terms in the MSA and gets commission on revenue rather than cash. The industry median sits at 65-80 days, best-in-class is 55-65 days, and above 90 days means an operator is using the service company as a working-capital bank.
This KPI is for sales VPs and finance leaders who need to tie commission structures and MSA negotiations to actual cash conversion rather than booked revenue. It trades away generous payment terms as a competitive lever for balance-sheet strength, which is the right call once DSO crosses 90 days. Compare it to Backlog Coverage Months above: backlog measures future revenue, while DSO measures whether past revenue has actually converted into cash.
8. HSE Incident Rate TRIR
HSE incident rate ranks eighth because it is a sales KPI, not a compliance checkbox: operators screen on TRIR before the proposal even reaches evaluation. Best-in-class sits below 0.5, bid-eligible at supermajors is below 1.0, and above 1.5 starts getting vendors pre-qualified out of major tenders entirely. Halliburton, SLB, and Baker Hughes all run TRIR under 0.6 in recent annual reports, while ChampionX and larger pure-plays target sub-0.8.
This KPI is for sales leaders who need to show up to QBRs with safety and emissions metrics on slide 3 rather than losing on slide 4. It trades away aggressive crew scheduling and cost-cutting for incident prevention, which is the right trade once a single recordable incident can cost a major tender. Compare it to NPT Service Quality Index below: TRIR measures safety performance, while NPT measures operational execution quality.
9. NPT Service Quality Index
NPT service quality index ranks ninth because non-productive time directly determines whether the operator's completions engineer writes a loss memo and reallocates next-year work. Best-in-class frac NPT runs 3-5%, drilling NPT 5-7% on super-spec rigs, and wireline NPT 4-6%; above 8-10% and the operator's completions engineer is actively shopping alternatives. Operators like Devon and EOG share NPT scorecards with service providers quarterly and use them to allocate work.
This KPI is for salespeople who need to show up to QBRs with NPT trending down rather than a price concession, because operational reliability beats discounting in the operator's evaluation. It trades away aggressive job scheduling for reliability, which is the right call once NPT crosses 8%. Compare it to HSE Incident Rate TRIR above: NPT measures execution quality on the job, while TRIR measures the safety envelope around it.
10. Realized Price Variance
Realized price variance ranks tenth because it is the diagnostic KPI that explains why bid wins at $185K per stage show up as $148K on the invoice after fuel, crew bonuses, mob/demob, retentions, and quiet discounts. Sales teams need a realized-price target on every tender rather than a list-price target, and the spread between bid records in Salesforce and invoiced revenue in SAP or Oracle is the leak rate per service line.
This KPI is for sales operations and finance teams who need to wire the realized-price-versus-bid-price dashboard and hold reps accountable to net revenue rather than gross bookings. It trades away headline bid-win announcements for margin integrity, which is the right call once the spread exceeds 15%. Compare it to Day Rate or Stage Price above: day rate measures the headline number, while realized price variance measures what actually landed in the bank.
How we ranked these
We ranked the nine KPIs by how directly each one predicts cash flow and capital recovery in oilfield services, then weighted them by frequency of use in operator tenders, board scorecards, and MSA negotiations. Fleet utilization, realized price, and backlog coverage carried the heaviest weight because they determine whether $50-70M frac fleets and $25-40M rigs earn their cost of capital. HSE and NPT were weighted as bid-eligibility gates, not soft metrics.
We deliberately ignored generic B2B SaaS metrics — CAC payback, magic number, net revenue retention, and pipeline velocity — because OFS sells utilized iron and crewed days, not seats or subscriptions. We also excluded commodity-price forecasts and rig-count predictions, since those are inputs to the model rather than controllable sales KPIs. Vanity metrics like total bid volume and raw pipeline value were dropped because they reward activity over disciplined capital allocation.
Related questions
How does fleet utilization differ from rig utilization in oilfield services?
Frac fleet utilization measures active pumping days against available days, with best-in-class running 80-90% and breakeven near 60-65%. Super-spec drilling rig utilization should run 75-85%, with breakeven closer to 70-75% because rig reactivation costs are higher. Wireline truck utilization naturally sits lower at 60-70% because the work is lumpier and more call-out driven.
Why does realized price matter more than list price on frac stages?
List price ignores fuel pass-throughs, crew bonuses, mob and demob charges, retentions, and quiet discounts that never roll into the next quote. A team reporting $185K stage wins while finance sees $148K realized is leaking margin invisibly. Salespeople need a realized-price target on every tender, not a list-price target, or the P&L breaks before the commodity does.
What backlog coverage is healthy for an oilfield services company?
Six to nine months of signed work-orders divided by monthly revenue run-rate is healthy. Three to four months means you are spot-selling and exposed to every rig-count wobble. Twelve-plus months locks pricing that may look bad if the cycle rips upward. Backlog quality matters as much as quantity — twelve months spread across three operators is concentration risk wearing a coverage costume.
How should an OFS sales team handle operator concentration risk?
Track top-5 operator share of trailing-12-month revenue monthly and brief the board quarterly with a basin-and-operator heat map. Forty to fifty-five percent concentration is typical and acceptable; sixty percent plus is a red flag, especially with one operator above twenty percent. The 2014-2016 downturn killed mid-size service companies whose top customer cut spend sixty percent in two quarters.
What DSO should oilfield services companies target in 2027?
Sixty to seventy-five days is healthy, with the industry median running seventy to eighty-five in normal cycles and stretching to ninety-five to one hundred ten in weak ones. Above ninety days sustained means the sales team negotiated weak MSA terms or receivables needs an escalation path through the customer finance org. DSO is a sales KPI because sales negotiated the payment terms.
How do operators screen service providers on HSE before tendering?
Operators pre-qualify on Total Recordable Incident Rate, DART, lost-time injury rate, spill volumes, and methane emissions before the commercial proposal reaches evaluation. Below 1.0 TRIR is bid-eligible at supermajors; above 1.5 gets you screened out entirely. A 0.6 TRIR at signing can drift to 1.2 inside eighteen months if safety culture slips, and the next pre-qual cycle will flag it.
What NPT threshold triggers operator dissatisfaction on completions jobs?
Best-in-class frac NPT runs three to five percent, drilling NPT five to seven percent on super-spec rigs, and wireline NPT four to six percent. Above eight to ten percent and the operator completions engineer is writing the loss memo. Operators like Devon and EOG share NPT scorecards quarterly and use them to allocate next-year work, so the salesperson showing declining NPT beats the one offering price concessions.
How often should basin mix be rebalanced in an OFS portfolio?
Run the basin-mix rebalancing exercise quarterly with the COO, CFO, and sales VP at the table, and stress-test against $55 WTI, $70 WTI, and $90 WTI strips plus Henry Hub at $2.50, $3.50, and $4.50. A seventy-five percent Permian mix means you run a single-basin business with single-basin risk. Haynesville swings on gas strip, Bakken is rail-takeaway constrained, and Marcellus is permitting-bound.
FAQ
Is fleet utilization or day rate the more important KPI?
Utilization, because the capital intensity of oilfield services means stranded assets destroy more value than soft pricing does — at least until you cross the breakeven utilization threshold. Track both, but optimize the portfolio for utilization first and price discipline second. A fleet at 85% utilization and median pricing beats a fleet at 65% utilization and premium pricing almost every quarter.
How do you handle pricing during a commodity-price drawdown?
Realized-price discipline, not list-price defense. Lock multi-job dedicated agreements with operators that will still drill through the cycle — well-capitalized independents and majors — and concede unit price selectively in exchange for backlog months and volume commitments. Salespeople who hold the list line and lose the volume bleed worst, because stacked iron has no pricing power at all.
What is a healthy DSO in oilfield services in 2027?
Sixty to seventy-five days is healthy; the industry median is seventy to eighty-five in normal cycles and can stretch to ninety-five to one hundred ten in weak cycles when small and private E&Ps slow-pay. Above ninety days sustained means the sales team negotiated weak MSA terms or receivables needs an escalation path through the customer finance org.
How do operators actually pick a service provider?
Through multi-stage pre-qualification covering HSE, financial health, technical capability, and basin presence, followed by a competitive tender with technical and commercial submissions evaluated separately. Incumbents win fifty to sixty percent of repeat work. The incumbent loses when there is a known NPT pattern, an HSE incident, or a price gap above eight to ten percent on a major program.
Do electric frac fleets really command a price premium?
Yes — fifteen to twenty-five thousand dollars per stage in 2026-2027, more in basins with operator ESG mandates. Liberty, ProPetro, Halliburton, and SLB all run electric-frac fleets at premium pricing and higher utilization than legacy diesel fleets. The premium is shrinking as the technology matures and supply grows, but it is real for the next twenty-four to thirty-six months.
How do you forecast revenue when WTI is moving five to ten dollars a week?
Forecast a base case at the strip, a downside at strip minus fifteen, and an upside at strip plus ten, then re-run the model monthly with the latest customer capex announcements. Salespeople who treat the forecast as a single-point estimate get cornered every quarterly close. The ones running the scenario triplet are the ones whose CFO trusts the number.
What reporting cadence should an OFS sales org run?
Daily crew dispatch, asset uptime, and HSE near-misses. Weekly utilization by basin and fleet generation, tenders submitted and decided, realized versus list price, NPT trending, and win-loss reason coding. Monthly ARPU by service line, backlog coverage, DSO aging, top-5 concentration, basin mix, and rolling TRIR. Quarterly full P&L by service line, basin rebalancing, and MSA renewal calendar.
Why does win rate on bid tenders vary so much by operator tier?
Majors like Exxon, Chevron, and Shell run twenty-five to thirty-five percent competitive win rates because the tender pool is deep and pre-qual is brutal. Large independents like Devon, EOG, and Diamondback run thirty-five to fifty percent. Private E&Ps run fifty percent plus because relationship and speed dominate. Anything below fifteen percent sustained means you are bidding outside your sweet spot or losing the technical review.
What kills OFS sales orgs even in good cycles?
Stacking iron at the cycle bottom without a reactivation playbook, quoting list price without realized-price discipline, over-concentrating in one basin or operator without an exit plan, and letting HSE drift between MSA signing and the next pre-qual cycle. Each failure is visible in the nine KPIs monthly if the reporting cadence is actually enforced rather than reviewed annually.
How should sales and operations share the nine KPIs?
Sales owns realized price, win rate, backlog coverage, operator concentration, basin mix, and DSO because those are negotiated in the MSA. Operations owns utilization, NPT, and HSE because those are delivered in the field. The QBR scorecard should show both sides on one page, because the operator completions engineer reviews the same combined picture before allocating next-year work.
Sources
- https://www.slb.com/
- https://www.halliburton.com/
- https://www.bakerhughes.com/
- https://www.libertyenergy.com/
- https://www.propetroservices.com/
- https://www.patterson-uti.com/
- https://www.osha.gov/recordkeeping
- https://www.eia.gov/petroleum/drilling/
- https://www.api.org/
- https://www.spglobal.com/commodityinsights/en/
Related on PULSE
- [More sales kpis for oilfield services rankings and buying guides](/knowledge)
- [PULSE Tools and calculators](/tools)
- [Everything on PULSE RevOps](/)
This page will be disappearing soon. Save it to your device for $1 — or read it free while it is here.
@Kory-White- · if Venmo asks, the last 4 of my number are 2012
 pulse-industry-kpisTop 10 Sales KPIs for Commercial Pest Control and Vegetation Management in 2027
 pulse-industry-kpisTop 10 Sales KPIs for Commercial Hotel Supplies and Hospitality Distribution in 2027
 pulse-industry-kpisTop 10 KPIs for Florists in 2027
 pulse-industry-kpisTop 10 Sales KPIs for Specialty Coffee Roasting & Wholesale in 2027
 pulse-industry-kpisTop 10 KPIs for Custom Home Builders in 2027
 pulse-industry-kpisTop 10 Sales KPIs for Industrial Compressed Air Systems in 2027
 pulse-industry-kpisTop 10 Sales KPIs for AI Safety and Red Team Services in 2027
 pulse-industry-kpisTop 10 Sales KPIs for Hospital Group Purchasing Organization (GPO) in 2027
 pulse-industry-kpisTop 10 Sales KPIs for Commercial Surgical Center and ASC in 2027
 pulse-industry-kpisTop 10 Sales KPIs for Managed Detection & Response (MDR) Security Services in 2027