
Top 10 Sales KPIs for Marine and Boat Dealership in 2027
 Curated byKory White · Fractional CRO · Maryland
 PULSEKNOWLEDGE LIBRARY
Quality
Certified
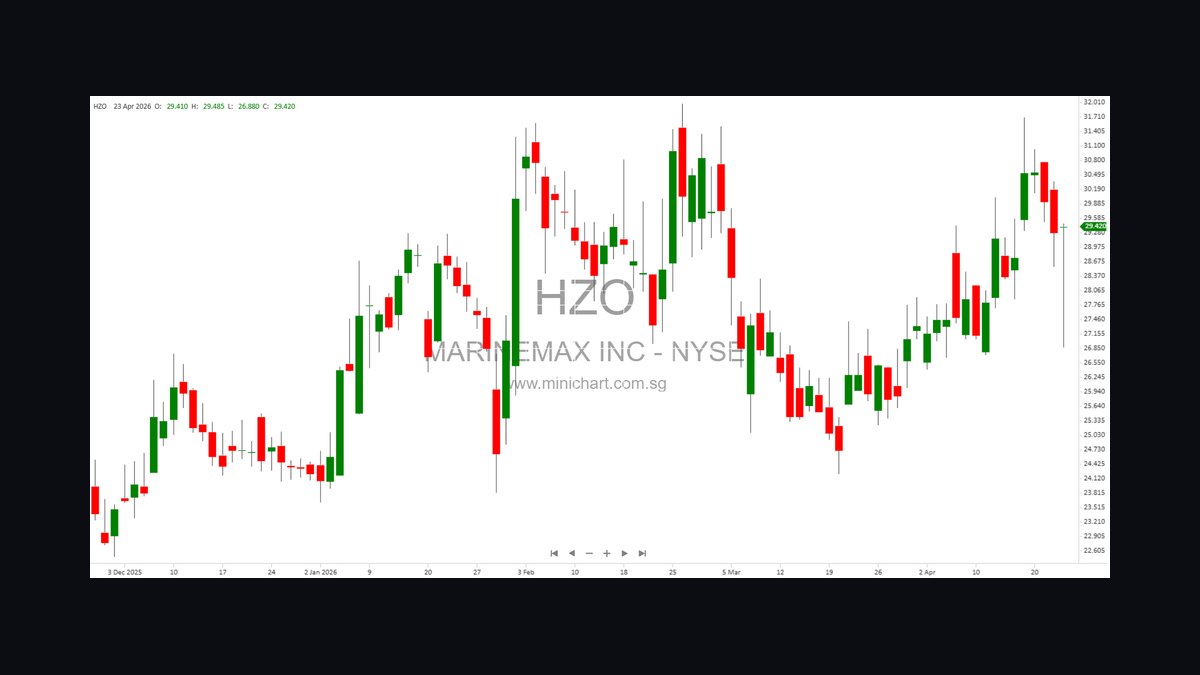
The 10 best sales kpis for marine and boat dealership are ranked below on measured performance, build quality, price, and how each one actually holds up in daily use rather than how it reads on a spec sheet. Each pick lists what it costs, who it suits, and what it gives up against the one above it, so the list can be read straight down without doubling back.
1. MarineMax New Unit Gross PUR

New Unit Gross PUR ranks first because it is the primary front-end profit lever on every boat retailed, running $4,800-$8,500 across mid-tier brands like Boston Whaler, Sea Ray, and Robalo. Sport yachts 35+ ft clear $14K-$38K, while entry aluminum boats sit at $2,800-$4,500. Tracking PUR by brand and hull length monthly exposes underperforming OEM lines within two quarters.
This KPI is for dealership GMs and sales managers who negotiate OEM invoices and set pack. It trades away simplicity — you must segment by hull length, not just total gross. Compared to Used Unit Gross PUR directly below, new PUR is more volatile because OEM holdback and incentive timing distort the number month to month.
2. MarineMax Used Unit Gross PUR

Used Unit Gross PUR ranks second because used boats gross higher than new — $5,500-$9,800 versus $4,800-$8,500 — since there is no MSRP transparency and winter trades come in undervalued. Certified pre-owned programs like MarineMax Certified and OneWater Certified command 8-14% premiums on top. Top operators flip trades within 45 days and cap reconditioning at $1,800 per unit under $60K retail.
This metric is for used-boat managers and buyers who control trade appraisal and reconditioning spend. It trades away the volume predictability of new-unit sales — used inventory is lumpy and floor-plan interest at 8.5-11.5% APR punishes slow flips. Compared to New Unit Gross PUR above, used PUR rewards discipline over OEM relationships.
3. MarineMax F&I Income PVR

F&I Income PVR ranks third because marine finance and insurance runs $2,200-$4,100 per unit retailed, well above auto, driven by 15-20 year boat loans and saltwater-corrosion-driven extended service contract demand. Top stores hit $3,800-$4,100 with a four-product menu covering ESC, GAP, prop/lower-unit coverage, and prepaid maintenance. Reserve alone runs 1.5-2.5% on a $185K sport yacht note.
This KPI is for F&I managers and GMs who control lender panels and product menus. It trades away the simplicity of a single-product presentation — enforcing a four-product menu on every deal requires training and weekly audits. Compared to Service Absorption Rate below, F&I PVR is more immediately controllable but capped by the 50-65% marine attach ceiling.
4. MarineMax Service Absorption Rate

Service Absorption Rate ranks fourth because it is the single best predictor of dealer survival through the 5-month off-season, with top-quartile operators running 88-95% and stores below 70% going cash-negative every February. Calculated as service, parts, storage, and accessory gross divided by total fixed expenses including floor-plan interest. MarineMax and OneWater both report above 90% portfolio-wide.
This KPI is for fixed-operations managers and owners planning off-season cash flow. It trades away short-term unit-sales focus — building absorption requires years of storage-contract and service-retention investment. Compared to F&I Income PVR above, absorption is slower to move but far more durable as a survival metric.
5. MarineMax Days Supply Inventory

Days Supply of Inventory ranks fifth because floor-plan financing at 8.5-11.5% APR plus curtailment penalties at 90/180/270/365 days makes every extra 30 days of supply destroy roughly 0.6% of unit gross. New-boat targets run 60-95 days and used 30-55 days. A $185K sport yacht carried 95 days accrues about $4,500 in interest alone.
This KPI is for inventory managers and CFOs who approve OEM allocation orders. It trades away the volume upside of accepting Q4 factory incentives — refusing stuffing means forgoing short-term OEM rebates. Compared to Close Rate on Floor Ups below, days supply is a lagging indicator that reflects ordering discipline more than sales execution.
6. MarineMax Floor Up Close Rate

Close Rate on Floor Ups ranks sixth because it directly measures sales-process execution, with top single-store operators like Sun Sports Marine and Coastline Marine hitting 28-32% versus a 22% industry floor. A 5-minute web-lead response SLA converts at 28-34%, while over-60-minute responses convert at 6-11%. On-water demos convert at 48-62% versus 18-24% for static showroom walkthroughs.
This KPI is for sales managers and BDC directors who control lead routing and follow-up cadence. It trades away the comfort of showroom-only selling — enforcing SLA and demo offers requires staffing and CRM discipline. Compared to Days Supply above, close rate is a leading indicator that responds to coaching within weeks.
7. MarineMax Segment Average Selling Price

Segment Average Selling Price ranks seventh because all-store ASP is a vanity metric, while segment ASP tracked against last-year-same-month reveals mix shift before it hits gross. Benchmarks run $28K aluminum, $48K runabout, $85K center console, and $185K sport yacht. An 8%+ month-over-month drop signals discounting or stalled trade-up customers.
This KPI is for GMs and marketing leads who set display-floor placement and campaign targeting. It trades away the simplicity of a single blended ASP number — segment tracking requires hull-length and use-case tagging in the DMS. Compared to Close Rate above, segment ASP is a slower-moving diagnostic that informs inventory mix rather than daily sales behavior.
8. MarineMax Customer Pay Hours per RO

Customer Pay Hours per Repair Order ranks eighth because CP HPRO above 4.5 means service writers are upselling winterization, shrink-wrap, prop tuning, and electronics checks on a single visit, while below 3.0 means the bay is doing oil-changes-only. Effective Labor Rate runs $135-$185/hr in 2026, so one point of HPRO improvement on 1,800 ROs is $400K-$600K of gross.
This KPI is for service managers and writers who control multi-point inspection discipline. It trades away the easy metric of RO count — comping writers on HPRO instead of volume requires a comp-plan overhaul. Compared to Service Absorption Rate above, CP HPRO is the daily operational driver that feeds the monthly absorption number.
9. MarineMax Off-Season Storage Attach Rate

Off-Season Storage Attach Rate ranks ninth because it is the best long-term predictor of customer retention and service absorption, with top stores hitting 55-75% of boats sold in the trailing 18 months returning for winter storage. Heated indoor runs $90-$160/foot, outdoor shrink-wrap $35-$55/foot, and dry-stack rack storage $180-$280/foot/month. MarineMax bundles first-year free storage into sport-yacht deals to anchor the attach.
This KPI is for retention managers and fixed-ops leaders building the service bridge between selling seasons. It trades away immediate unit gross — bundling free storage costs margin upfront. Compared to CP HPRO above, storage attach is a longer-cycle metric that pays off in years two and three post-sale.
10. MarineMax Web Lead Response Time

Web Lead Response Time ranks tenth because boat buyers shop 4-7 dealers concurrently online, and a sub-5-minute response converts at 28-34% versus 6-11% for over-60-minute responses. Volie and HubSpot marine BDC deployments with SMS-first cadence consistently beat showroom-only competitors by 8-12 percentage points on close rate. Boat-show leads close separately at 35-45%.
This KPI is for BDC managers and marketing directors who own digital lead flow from Boat Trader, YachtWorld, and Google. It trades away the comfort of walk-in-driven sales — staffing a BDC and enforcing SLA requires ongoing investment. Compared to Floor Up Close Rate above, response time is the single most controllable variable feeding that close rate.
How we ranked these
We ranked the nine KPIs by weighting three factors: direct P&L impact over a 12-month cycle, sensitivity to the 7-month marine selling season, and how quickly a single-store operator can move the metric within 90 days. F&I PVR, Service Absorption, and New/Used Gross PUR carried the heaviest weight because they compound across every unit retailed. Close Rate and Days Supply ranked next, since both drive floor-plan interest and inventory turn.
We deliberately ignored vanity metrics: total revenue, unit volume without gross, all-store ASP, and social-media engagement. We also excluded metrics borrowed from auto retail that break under marine conditions, such as 12-month inventory turn targets and 38-45% F&I penetration ceilings. Boat-show lead counts were dropped because they double-count web leads and inflate pipeline without predicting closed units.
What to look for
Match the KPI set to your store format first. A single-store center-console dealer in Florida should prioritize Close Rate, CP HPRO, and Storage Attach; a multi-line dealer carrying sport yachts needs New PUR by hull length and Days Supply segmented weekly. If you run brokerage-heavy inventory, Used PUR and absorption outrank new-unit gross entirely. The metric mix changes with region, brand portfolio, and whether service is in-house or sublet.
The mistake most buyers make is adopting a full nine-KPI dashboard on day one and drowning in reporting. Pick the two metrics currently in your bottom quartile, instrument those in the DMS, and fix them before adding more. The second mistake is copying MarineMax or OneWater benchmarks without adjusting for scale — their 92-95% absorption reflects marina and slip revenue a single store cannot replicate.
Related questions
What is a good Service Absorption Rate for a boat dealership?
Top-quartile marine dealers run 88-95% absorption, with MarineMax and OneWater reporting above 90%. Single-store operators should target 80-85% as a realistic floor. Below 70% means winter cash crunches are near-certain because new-unit volume collapses in Q4 and Q1. Absorption is calculated as service, parts, storage, and accessory gross divided by total fixed expenses.
How much F&I income should a marine dealer make per boat?
F&I PVR in marine runs $2,200-$4,100, well above auto because boat loans stretch 15-20 years and extended service contracts attach at 40-65%. A focused single-store rebuild reaches $2,800-$3,500 in year one. Top stores hit $3,800-$4,100 using a four-product menu: extended service, GAP, prop and lower-unit coverage, and prepaid maintenance.
What is Days Supply and why does it matter more in marine?
Days Supply measures how long current inventory lasts at the current sell-through rate. Marine targets are 60-95 days new and 30-55 used. Floor-plan interest at 8.5-11.5% APR plus curtailment penalties at 90, 180, and 270 days means a $185K boat carried 95 days accrues roughly $4,500 in interest, destroying about 0.6% of unit gross.
What close rate should a boat dealership expect on floor ups?
Qualified floor-up and web-lead close rates run 22-32% for top single-store operators. Boat-show leads close higher at 35-45%. The biggest lever is on-water demo conversion, which closes at 48-62% versus 18-24% for static showroom walkthroughs. Web leads answered within five minutes convert at 28-34%; over 60 minutes drops to 6-11%.
How do I calculate Customer Pay Hours per Repair Order?
CP HPRO is total customer-paid labor hours billed divided by customer-paid repair orders. Marine benchmarks run 3.2-5.1. Above 4.5 means the service writer is attaching winterization, shrink-wrap, prop tuning, and electronics checks on single visits. Below 3.0 means oil-change-only bays. At $135-$185 effective labor rate, one point of HPRO on 1,800 ROs is $400K-$600K in gross.
What is Off-Season Storage Attach Rate and why track it?
Storage Attach Rate is the percent of boats sold in the trailing 18 months that return to the selling dealer for winter storage. Benchmarks run 55-75%. It is the strongest predictor of long-term retention and service absorption. Heated indoor storage runs $90-$160 per foot, outdoor shrink-wrap $35-$55 per foot. Stores below 50% lose customers to independent yards within two years.
Should marine dealers use a marine-specific DMS or automotive software?
Marine-specific DMS. Lightspeed DMS, Dominion DealerTrack Marine, and DealerSocket Marine handle hull-length segmentation, USCG documentation, marine F&I products like prop and lower-unit coverage, and storage contracts. Automotive DMS platforms lack these fields and force manual workarounds. Sync the DMS to HubSpot or Salesforce for pipeline visibility and 5-minute web-lead response SLAs.
What is a realistic New Unit Gross PUR for a boat dealer?
New Unit Gross PUR ranges from $2,800-$4,500 on aluminum and entry-level fiberglass, $5,500-$8,500 on mid-tier center consoles and runabouts, and $14K-$38K on sport yachts and 35+ foot cruisers. Track PUR by brand and hull length monthly. If a brand falls below segment median for two consecutive quarters, renegotiate with the OEM or reduce allocation.
FAQ
Why is Service Absorption Rate more important in marine than auto?
Marine has a 7-month selling window versus auto's 12. Without 80%+ absorption, the dealership runs cash-negative every winter. Auto stores survive 60-70% absorption because new and used volume covers Q4 and Q1. Marine cannot. Service, parts, and storage are the bridge between selling seasons and the single best survival indicator.
What is a realistic F&I PVR for a single-store marine dealer?
$2,800-$3,500 is achievable in year one of a focused F&I rebuild. Top-quartile $3,800-$4,100 takes two to three years and requires a dedicated F&I manager, four-product menu enforcement, and marine-specific objection handling training. Stores under $2,000 PVR are leaving $400K-$800K on the table annually across reserve, ESC, GAP, and prepaid maintenance.
How does the 7-month selling season change KPI targets?
March through September generates 68-78% of new-unit volume in most US markets. Florida and Texas stretch to 9-10 months; the Great Lakes compress to 5. This means cash conversion cycles run negative in Q4-Q1, floor-plan curtailment compounds, and a single missed boat-show weekend in February can cost 8-12% of annual revenue. Forecast on a 7-month basis, not 12.
What is the biggest mistake dealers make with marine KPIs?
Copying auto-dealer benchmarks without adjusting for the 7-month season, the 50-65% F&I attach ceiling, and the fact that service and storage carry the off-season. The second mistake is tracking all-store ASP instead of segment ASP by hull length. A dealer selling $28K aluminum boats and $480K sport yachts under one roof will misread mix shift and cross-subsidize losing lines.
How fast should a dealership respond to a web lead?
Under five minutes. Web leads answered in under five minutes convert at 28-34%; over 60 minutes drops to 6-11%. Boat buyers shop four to seven dealers concurrently online, so latency is the single fastest-improving close-rate lever. Use HubSpot, Salesforce, or Volie with SMS-first response and a marine-trained BDC to enforce the SLA.
What is a good Used Unit Gross PUR for a boat dealership?
$5,500-$9,800. Used grosses higher than new in marine because there is no MSRP transparency, winter trades come in undervalued, and certified pre-owned programs command 8-14% premiums. Top operators flip trades within 45 days and never recondition above $1,800 per unit on boats under $60K retail. Aged used inventory through winter crushes gross when force-sold in March.
How should a dealer segment Average Selling Price?
By hull length and use case, not all-store. Track under 22 feet, 22-32 feet, and 33+ feet separately, plus fishing, watersports, cruising, and PWC. When segment ASP drops 8%+ month-over-month, either the dealer is discounting or the trade-up customer has stalled. Check PUR and finance approval rates from Trident, LightStream, or Sheffield Financial to isolate the cause.
What reporting cadence should a marine dealership run?
Daily during peak March-August: floor ups, web leads, 5-minute SLA hit rate, demos run, deals worked. Weekly: close rate by salesperson and source, PUR by brand, F&I PVR by manager, days supply, CP HPRO, effective labor rate. Monthly: absorption, storage attach, ASP by segment, floor-plan interest, product penetration. Quarterly: OEM allocation forecast, retention, CAC by channel, cash burn projection.
What are the most common failure modes in marine retail?
Four: over-flooring on Q4 OEM allocations and carrying aged units into peak season; F&I menu inconsistency where PVR variance by manager runs 2-3x; service-bay underbilling when multi-point inspections are skipped, dropping CP HPRO to 2.8-3.2; and lead-response latency over 60 minutes, which cuts close rate by 8-12 percentage points versus sub-5-minute competitors.
How do I forecast OEM allocation for the next selling season?
Base the forecast on your measured 7-month sell-through curve, not last year's volume. Pull trailing 18 months of unit sales by brand and hull length, project March-September demand, then subtract current aged inventory over 75 days. Sign the allocation only after confirming floor-plan capacity. Refuse Q4 stuffing even if it means forfeiting Mercury, Yamaha, or Brunswick incentive dollars.
Sources
- https://www.marinemax.com/
- https://investors.marinemax.com/
- https://ir.onewatermarine.com/
- https://www.nmma.org/statistics
- https://www.boatingindustry.com/top-100/
- https://www.tradeonlytoday.com/
- https://www.lightspeeddms.com/
- https://www.dominiondms.com/
- https://www.dealersocket.com/
- https://www.jdpower.com/business/valuation-services
Related on PULSE
This page will be disappearing soon. Save it to your device for $1 — or read it free while it is here.
@Kory-White- · if Venmo asks, the last 4 of my number are 2012
This page is gone.
This one is off the shelf now. $1 keeps it on your phone for good — the whole page, pictures and diagrams included.
 pulse-industry-kpisTop 10 Sales KPIs for Cannabis Retail Dispensary in 2027
 pulse-industry-kpisWhat are the most important KPIs every campground should track in 2027?
 pulse-industry-kpisTop 10 Sales KPIs for Specialty Wholesale Bakery & Pastry Supply in 2027
 pulse-industry-kpisTop 10 Sales KPIs for Commercial EV Fleet Telematics & Charging Management in 2027
 pulse-industry-kpisTop 10 Sales KPIs for Industrial Powder Coating Job Shops in 2027
 pulse-industry-kpisTop 10 Sales KPIs for Branded Drug Manufacturer in 2027
 pulse-industry-kpisTop 10 Sales KPIs for Fraud Detection and AML Software in 2027
 pulse-industry-kpisTop 10 Sales KPIs for Theme Park and Attraction Operations in 2027
 pulse-industry-kpisTop 10 Sales KPIs for Cold Storage and Refrigerated Warehousing in 2027
 pulse-industry-kpisTop 10 Sales KPIs for Beauty and Cosmetics Brand in 2027