
Top 10 Sales KPIs for Uniform Rental and Workwear Services in 2027
 Curated byKory White · Fractional CRO · Maryland
 PULSEKNOWLEDGE LIBRARY
Quality
Certified
The 10 best sales kpis for uniform rental and workwear services are ranked below on measured performance, build quality, price, and how each one actually holds up in daily use rather than how it reads on a spec sheet. Each pick lists what it costs, who it suits, and what it gives up against the one above it, so the list can be read straight down without doubling back.
1. Average Contract Value per Stop

ACV/Stop is the single best proxy for stop quality, and it sits at the top because every other KPI flows from it. Healthy operators run $4,200-$6,800 per stop per year; Cintas anchors the high end on national-account density and add-on attachment. A regional book under $4,000/stop is either underpriced or under-attached. Divide annualized route revenue by unique stops to compute it.
Owners and regional VPs should review it monthly by territory, not by rep, because territory mix distorts the number. The trade-off is granularity: ACV/Stop hides a 4-wearer stop and a 90-wearer stop inside the same average. Pair it with New Logo Wearer Count, ranked fourth, to see whether the average is moving for the right reason.
2. Route Density per Route-Day
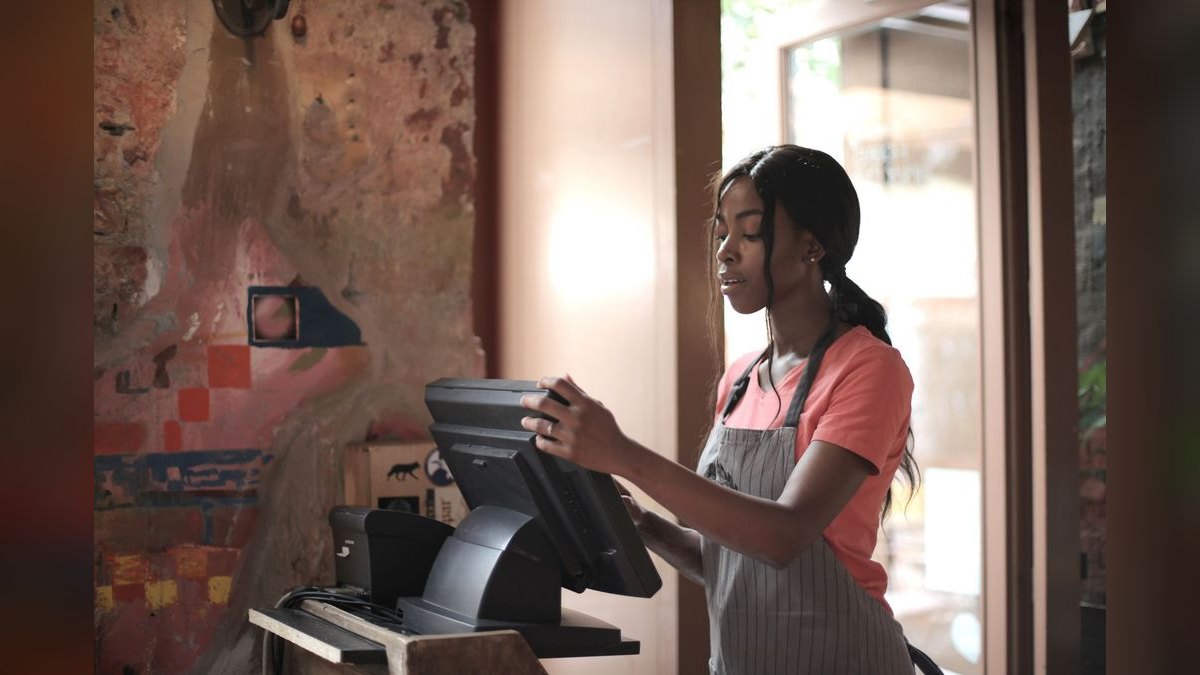
Route density ranks second because margin lives in the truck, not the price list. Below 14 stops/day a route loses money on most independent P&Ls; 18-22 is healthy; 24+ is best-in-class, and UniFirst publicly targets 22+ on mature geographies. A truck costs the same whether it makes 12 stops or 24, so incremental stops drop 60-70% to gross margin.
Route managers should see it daily; sales leaders should see territory monthly averages to spot reps selling density-killers. The trade-off is that density alone can mask a route full of low-value stops. Compare against Cost-to-Serve per Stop, ranked ninth, before declaring a route healthy.
3. Stops per Route-Hour

Stops per Route-Hour ranks third because it strips out route-length variability that inflates raw density. A driver working 8 productive hours making 22 stops sits at 2.75 stops/hour, inside the healthy 2.4-3.2 band. Below 2.0 stops/hour, routing software is failing or stops are geographically dispersed. It is the daily KPI for route managers.
Sales leaders use the territory monthly average to learn which reps are selling density-killers. The trade-off is that it penalizes rural territories with long legal drive times between stops. Compare it to Route Density per Route-Day above: density shows volume, stops/hour shows efficiency, and you need both.
4. New Logo Wearer Count
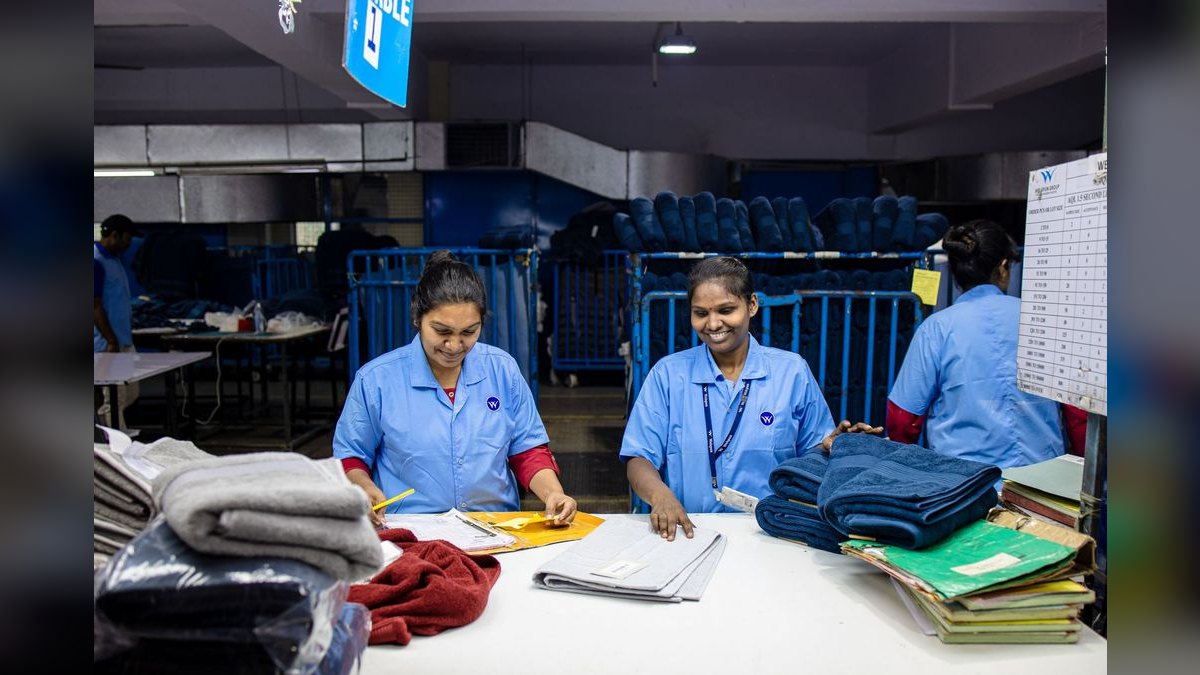
Wearer count ranks fourth because in uniform rental the unit of new sales is the wearer, not the dollar. A 50-wearer account differs from a 5-wearer account on inventory commitment, stop value, and renewal economics. Top Cintas and UniFirst reps land 100-140 wearers monthly in mature territories; new reps should hit 60-80 by month six.
Track it as a custom number field on every Opportunity next to ACV. The trade-off is that wearer count ignores revenue quality: 120 wearers at a discounted rate can be worth less than 70 at full price. Cross-check against Average Contract Value per Stop, ranked first, before paying comp on it.
5. Annual Revenue Retention

Gross dollar retention ranks fifth because it decides whether growth is real or a treadmill. Public operators sit at 93-96%; below 90% the sales team is replacing churned revenue instead of compounding. Measure it trailing-12 monthly, and watch cancellation notices received in the 90-day pre-renewal window as the leading indicator.
The trade-off is that retention looks healthy right up until a large multi-site account exits, so segment by account size. Compare against Add-On Penetration below: high retention plus low penetration means you are keeping customers you never fully monetized.
6. Add-On Penetration Rate
Add-on penetration ranks sixth because it is the cheapest growth available inside the existing book. Mats, restroom, first aid, and facility services run 40-65% gross margin; Cintas runs 50%+ blended, and regional operators at 25% have an untapped pipeline. Best-in-class is 3.4-4.1 programs per account versus 1.6-2.0 for the average independent.
Sales ops should publish Programs per Account monthly and split comp 60/40 between new logo and expansion. The trade-off is service capacity: every added program increases route time per stop. Compare against Stops per Route-Hour, ranked third, to confirm the route can absorb the extra work.
7. Garment Loss and Abuse Rate

Loss and abuse ranks seventh because it is the quiet margin leak that only surfaces at renewal. TRSA benchmarks put 2.0-2.5% of inventory value as healthy; the industry band runs 1.8-3.2%, and above 3.5% pricing is wrong. Oil and gas accounts run 4.5-5.5%, foodservice 3.8%, healthcare 1.8%, office 1.2%.
Reps need a SIC-coded minimum-pricing card before quoting heavy industrial deals. The trade-off is that aggressive loss clauses cost you bids against competitors who underprice the risk. Compare against Average Contract Value per Stop, ranked first: a high-ACV stop with a 5% loss rate can still be margin-negative.
8. Sales Cycle to First Delivery
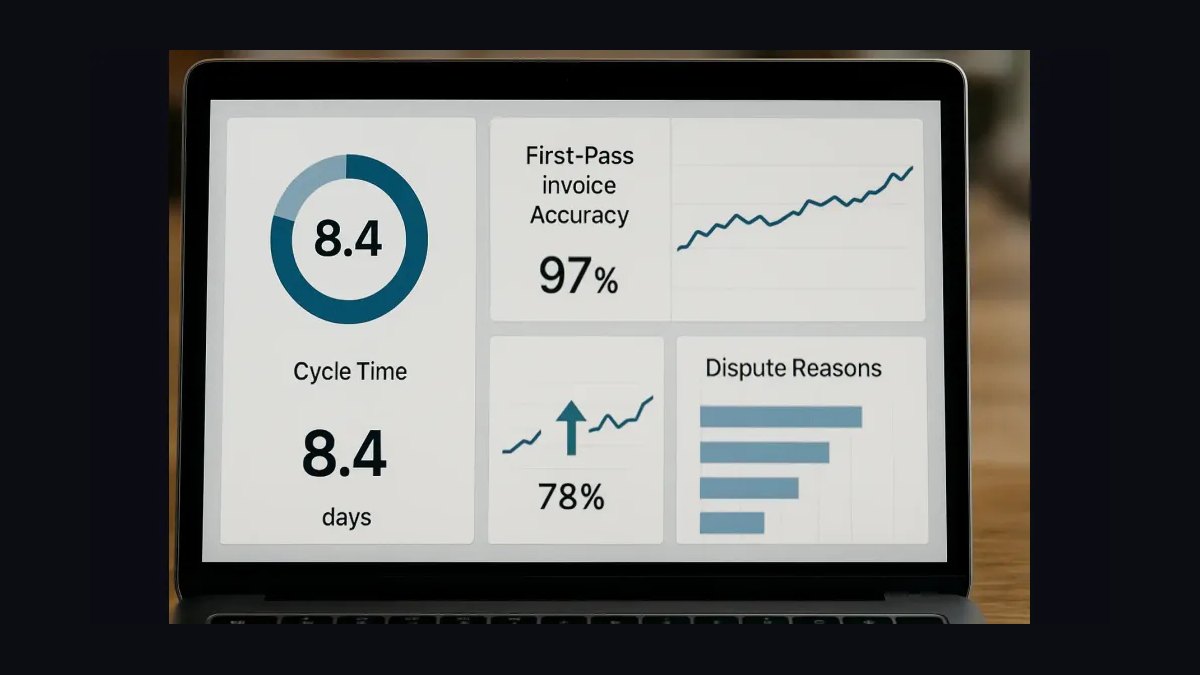
Sales cycle ranks eighth because revenue does not recognize until the garment is in service, not at signature. Best-in-class SMB accounts under 30 wearers close in 45-60 days; mid-market runs 60-90; national accounts run 6-18 months and belong in a separate pipeline. The clock stops at first invoiced delivery.
Cycle drag comes from garment measurement, embroidery and manufacturing lead times, emblem approval, and route scheduling. The trade-off is that compressing the cycle can push reps to skip the program review that drives add-on attachment. Compare against Add-On Penetration Rate, ranked sixth, to see whether speed is costing you expansion.
9. Cost-to-Serve per Stop
Cost-to-serve ranks ninth because it converts route activity into a margin number per visit. Total route operating cost divided by weekly stops runs $12-$22 industry-wide; best-in-class operators hold $14-$16. Driver wage inflation pushed the industry average up roughly 18% from 2023 to 2027, and it keeps climbing.
Compare it against ACV/Stop divided by 52 to get weekly margin per stop before plant processing. The trade-off is that allocated supervision and plant time vary by accounting method, so definitions must be frozen across territories. Compare against Route Density per Route-Day, ranked second, since the two move together.
10. Programs per Account

Programs per account ranks tenth because it is the operating metric that makes add-on penetration actionable at the rep level. Best-in-class operators run 3.4-4.1 programs per customer; the average regional independent runs 1.6-2.0. Every rep can be handed a target list of 25-40 single-program accounts from their own book.
Service Sales Reps should carry a small comp component tied to route-level programs per account, typically 8-15% of base at risk. The trade-off is that pushing programs per account too hard degrades service quality as drivers prioritize selling over servicing. Compare against Add-On Penetration Rate, ranked sixth, which is the dollar view of the same behavior.
How we ranked these
We ranked the nine sales KPIs that most directly predict revenue and EBITDA for uniform rental and workwear operators in 2027, weighting each by three factors: correlation to route-level profitability, frequency of internal reporting at the publicly traded operators (Cintas, UniFirst, Vestis), and actionability for a sales leader or GM within a single quarter. Route density, ACV per stop, and add-on penetration carried the heaviest weight because they drive margin independently of pricing.
We deliberately excluded vanity metrics that look impressive on a board slide but do not change route economics: total logo count without wearer counts, gross pipeline value without stage-weighted probability, brand-awareness scores, and website lead volume. We also ignored national-account ACV figures, because those cycles run 6-18 months and distort benchmarks for regional operators. Single-quarter revenue spikes and one-time PPE surges were excluded as non-recurring.
Related questions
What is a good route density benchmark for uniform rental in 2027?
Healthy is 18-22 stops per route-day; best-in-class is 24 or more. Below 14 stops per day, most independent operator P&Ls lose money on the route. UniFirst publicly targets 22+ stops per day on mature geographies. Sales comp plans at Vestis and Alsco explicitly bonus reps who sell into low-density zip codes to lift the average.
How much does a new uniform rental customer cost in garment inventory?
Budget roughly 11 garment changes per wearer for a five-day work week, at $35-$80 per garment depending on program type. A 50-wearer industrial account therefore carries $19,250-$44,000 in upfront inventory. That inventory amortizes over 18-36 months, which is why a customer who cancels in month 14 destroys the unit economics of the deal.
What is a realistic sales cycle for uniform rental deals?
First qualified call to first invoiced delivery runs 45-60 days for SMB accounts under 30 wearers, and 60-90 days for mid-market accounts of 30-150 wearers. National accounts run 6-18 months and should be tracked separately. The biggest cycle drags are garment measurement, direct embroidery lead times, and route scheduling.
How important is add-on penetration to uniform rental EBITDA?
It is the single largest margin multiplier. Mats run 40-55% gross margin, restroom supplies 50-60%, first aid cabinets 55-65%. Operators at 50%+ add-on penetration on the installed base run double-digit EBITDA growth without adding new logos. Best-in-class is 3.4-4.1 programs per account; the average regional independent sits at 1.6-2.0.
What annual revenue retention should a uniform rental operator target?
Gross dollar retention of 92-96% before expansion is the industry standard, and the publicly traded operators all sit in that band. Below 90%, the sales team is replacing too much revenue and growth becomes a treadmill. Track trailing-12 monthly, and watch cancellation notices received in the 90-day pre-renewal window as the leading indicator.
How should sales comp plans reward route density?
Install a geographic density modifier. Deals inside target density zones earn 1.2-1.4x commission; deals outside earn 0.6-0.8x. Cintas and UniFirst both apply multipliers like this. Sales ops should publish a monthly territory density heatmap so reps can see exactly which zip codes pay more. Raw new ACV alone rewards density-killing deals.
What is cost-to-serve per stop and why does it matter?
It is total route operating cost — driver wages, fuel, truck depreciation, DOT compliance, plant time, supervision — divided by weekly stops. Best-in-class runs $14-$16 per stop; the industry average has risen roughly 18% from 2023 to 2027 on driver wage inflation. Compare it against ACV per stop divided by 52 to see weekly margin per stop.
Which CRM fields are mandatory for uniform rental sales teams?
Every opportunity and account record needs wearer count, program count, renewal date, and SIC code. Wearer count drives inventory and stop-value forecasting. Program count drives add-on penetration reporting. Renewal date feeds the 120-day pre-renewal pipeline. SIC code drives loss/abuse pricing guardrails. Without these four fields, the KPI dashboard cannot be built reliably.
FAQ
What are the top sales KPIs for uniform rental in 2027?
The nine that matter are ACV per stop ($4,200-$6,800/year), route density (18-26 stops/day), stops per route-hour (2.4-3.2), new logo wearer count (80-140 per rep per month), annual revenue retention (92-96%), add-on penetration (38-55% of base), garment loss/abuse rate (1.8-3.2%), sales cycle (45-75 days), and cost-to-serve per stop ($12-$22).
Why is route density more important than pricing in uniform rental?
A route truck costs roughly the same to operate whether it makes 12 stops or 24. Driver wages, truck lease, fuel, and DOT compliance are essentially fixed per route-day. Every incremental stop added to an existing route drops 60-70% to gross margin. That is why operators will sell small accounts at thin standalone pricing if the stop fits an existing route.
How many wearers should a uniform rental sales rep land per month?
Top reps at Cintas and UniFirst land 100-140 wearers per month in mature territories. New reps in development should reach 60-80 wearers per month by month six. Track this as a custom number field on the Opportunity in Salesforce or your CRM, sitting next to ACV, because wearer count drives inventory commitment and stop value.
What is a healthy garment loss and abuse rate?
TRSA member reporting puts 2.0-2.5% of inventory value per year as healthy. Above 3.5%, either the loss/abuse clause is mispriced or sales is signing high-attrition industries without adjusting program economics. Heavy industrial and oil and gas can run 4.5-5.5%; foodservice 3.8%; healthcare 1.8%; office 1.2%. Price by SIC code.
How do multi-year uniform rental contracts actually work?
A signed agreement in 2027 is typically 60 months, auto-renewing in 60-month increments unless the customer cancels in a 90-day window before expiration. Cintas, UniFirst, and Vestis all use this structure. A sale closed in March 2027 books revenue through March 2032, so value logos on lifetime contract value, not first-year ACV.
What is the biggest mistake regional uniform operators make?
Ignoring the renewal window. Multi-year contracts have a 90-day pre-expiration cancellation window, and many regional operators do not track which contracts are entering it until a cancellation notice arrives. Build a 12-month renewal pipeline, flag every contract at 120 days out, and assign a retention rep to run a face-to-face program review.
Should uniform rental sales comp reward new logos or account expansion?
Split it roughly 60/40 between new logo and existing-account expansion. A territory with 240 logos at 1.4 programs per account is smaller than a peer with 180 logos at 3.2 programs per account. Make Programs per Account visible monthly. Service Sales Reps, the route drivers, should also carry a small comp component tied to add-on penetration.
What does a 30/60/90 day plan look like for a new uniform rental sales leader?
Days 1-30 diagnose: pull route-level data, compute density and ACV per stop, audit comp, interview top and bottom reps, flag renewals. Days 31-60 decide: publish the dashboard, rewrite comp with density modifiers, set SIC pricing guardrails, launch renewal retention. Days 61-90 execute: run the Programs per Account campaign and first renewal sweep.
How does uniform rental sales differ from B2B SaaS?
Uniform rental is closer to route-based distribution than SaaS. Every new sale carries garment inventory commitment, so a 50-wearer deal ties up $19K-$44K upfront. Revenue recognizes only when garments are in service, not at contract signature. And margin is driven by route density and add-on penetration, not by seat expansion or net revenue retention curves.
What reporting cadence should a uniform rental KPI dashboard use?
Daily for route managers: stops completed, delivery exceptions, complaints, same-day add-on sales. Weekly for sales leaders: new wearers by rep, pipeline movement, cancellation notices, stops per route-hour. Monthly for regional VPs: ACV per stop, density, programs per account, retention, cost-to-serve. Quarterly for the board: EBITDA bridge, cohort retention, territory profitability.
Sources
- https://www.cintas.com/
- https://www.unifirst.com/
- https://www.vestis.com/
- https://www.alsco.com/
- https://www.imagefirst.com/
- https://www.trsa.org/
- https://www.sec.gov/cgi-bin/browse-edgar?action=getcompany&CIK=CTAS
- https://www.sec.gov/cgi-bin/browse-edgar?action=getcompany&CIK=UNF
- https://www.sec.gov/cgi-bin/browse-edgar?action=getcompany&CIK=VSTS
Related on PULSE
This page will be disappearing soon. Save it to your device for $1 — or read it free while it is here.
@Kory-White- · if Venmo asks, the last 4 of my number are 2012
This page is gone.
This one is off the shelf now. $1 keeps it on your phone for good — the whole page, pictures and diagrams included.
 pulse-industry-kpisTop 10 Sales KPIs for AI Observability Platform in 2027
 pulse-industry-kpisTop 10 Sales KPIs for Commercial Modular & Prefabricated Building Manufacturing in 2027
 pulse-industry-kpisTop 10 Sales KPIs for Fraud Detection and AML Software in 2027
 pulse-industry-kpisTop 10 Sales KPIs for Medical Device OEM in 2027
 pulse-industry-kpisTop 10 Sales KPIs for Commercial EV Fleet Telematics & Charging Management in 2027
 pulse-industry-kpisTop 10 Sales KPIs for Commercial Sound Masking & Acoustic Systems in 2027
 pulse-industry-kpisTop 10 Sales KPIs for Architectural Curtain Wall Engineering & Fabrication in 2027
 pulse-industry-kpisTop 10 Sales KPIs for Print and Copy Services in 2027
 pulse-industry-kpisTop 10 Sales KPIs for Data Center Colocation in 2027
 pulse-industry-kpisTop 10 Sales KPIs for Cyber-Insurance Carriers in 2027