
Top 10 Sales KPIs for Veterinary Pharmaceutical Distribution in 2027
 Curated byKory White · Fractional CRO · Maryland
 PULSEKNOWLEDGE LIBRARY
Quality
Certified

The 10 best sales kpis for veterinary pharmaceutical distribution are ranked below on measured performance, build quality, price, and how each one actually holds up in daily use rather than how it reads on a spec sheet. Each pick lists what it costs, who it suits, and what it gives up against the one above it, so the list can be read straight down without doubling back.
1. Order Fill Rate KPI

Order fill rate ranks first because a clinic that hits three back-orders in 60 days trials a second-source distributor, making it the fastest-moving leading indicator of account loss. Targets run 96-98.5% on commodity pharma, 98-99.5% on biologics, and 99%+ on controlled substances, measured separately by line type.
Blended fill rate hides the damage: a 97% average can mask a 91% biologics rate that is bleeding accounts. It sits above vaccine-line gross margin because a lost clinic takes its entire book with it, while a margin miss is recoverable next quarter. Operations and sales leaders should review it daily, not monthly.
2. Vaccine-Line Gross Margin KPI
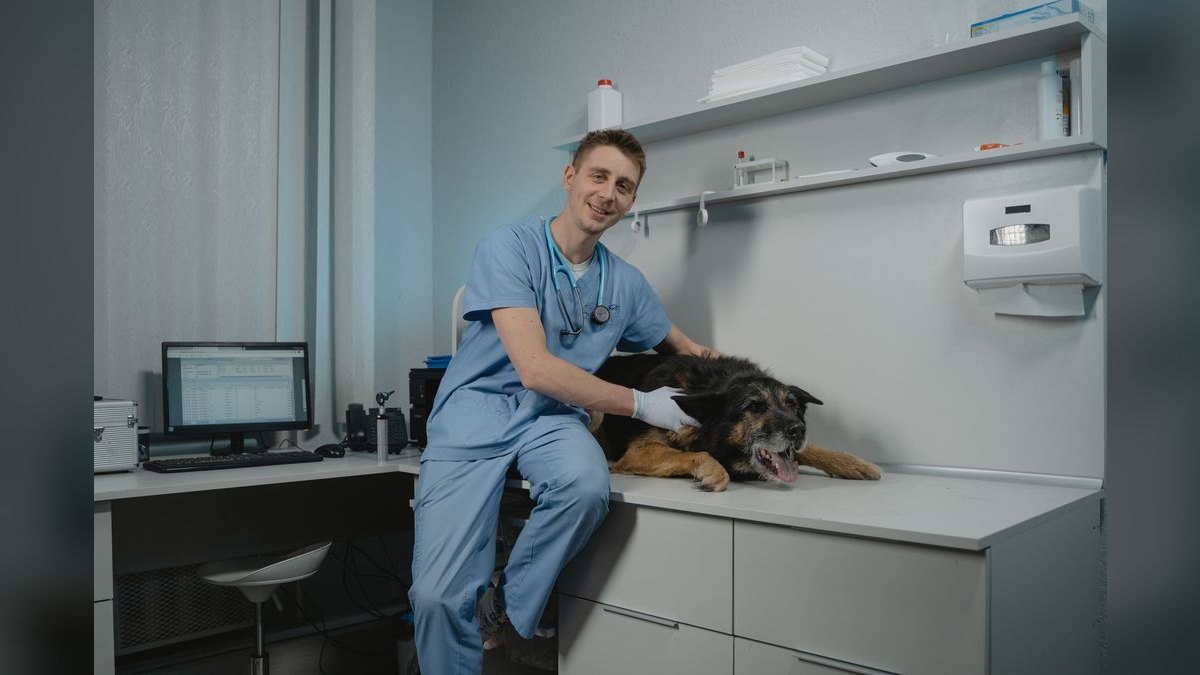
Vaccine-line gross margin ranks second because biologics are where the profit actually lives, running 18-28% versus 6-12% on commodity oral pharma. Blended target is 19-26%; anything below 16% signals lost rebate tiers or absorbed cold-chain failures. Canine core vaccines run leaner at 12-15%, while monoclonals like Librela and Cytopoint reach 22-30%.
It sits just below order fill rate because margin only matters if the clinic stays, and just above DEA compliance because cold-chain excursions create write-offs, complaints, and possible USDA APHIS reportable events. Track it per SKU, not blended, since a healthy average can conceal sub-15% lines that need pricing or rebate rework.
3. DEA Compliance Pass Rate KPI
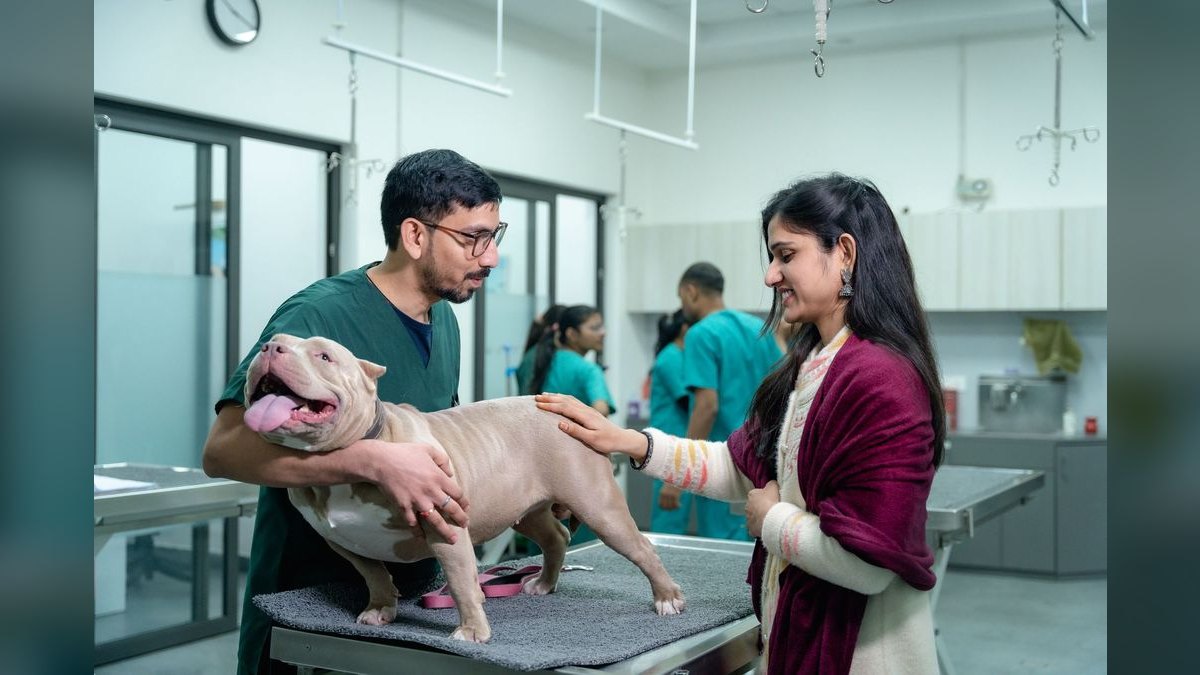
DEA compliance pass rate ranks third because regulation is a precondition, not a feature: one rep selling Schedule II ketamine to a clinic with a lapsed state license can freeze an entire warehouse pending investigation. The bar is 99.5% or higher across Form 222 transactions, suspicious-order monitoring reviews, and state pharmacy board audits with zero findings.
It ranks below vaccine margin only because clean compliance is binary and non-negotiable rather than a competitive lever, and above rebate capture because a failed audit destroys margin outright. Track it per distribution center and per rep, since controlled substances anchor a small-animal hospital's purchase order and gate the rest of the relationship.
4. Manufacturer Rebate Capture KPI
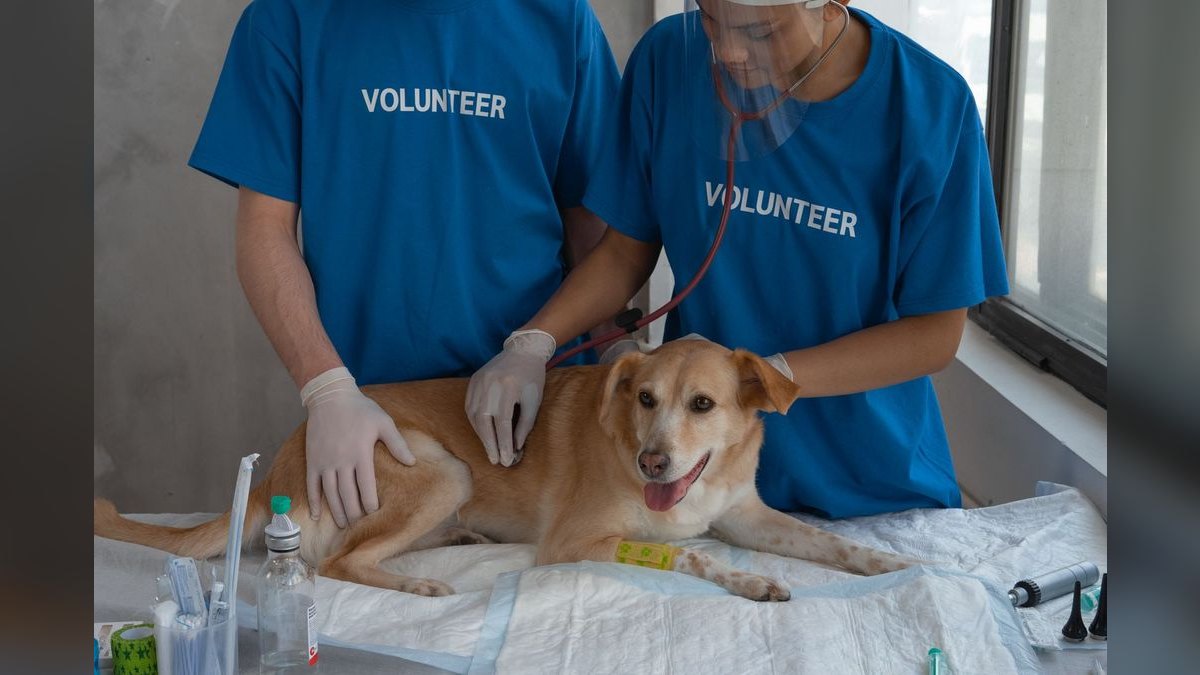
Manufacturer rebate capture ranks fourth because front-end sell prices sit within 2-3% across competitors, so back-end rebates are the actual P&L. Best-in-class operators capture 78-86% of available dollars; the average runs 62-70%. Closing that gap moves blended gross margin 150-300 basis points, roughly $6M-$12M annually on a $400M book.
It ranks below DEA compliance because rebate dollars only exist on legally shippable volume, and above route density because the fix is mostly sales-rep discipline: surfacing tier thresholds during quarterly business reviews and closing clinics within 5-10% of a higher tier before quarter-end.
5. Route Density KPI

Route density ranks fifth because freight is a real cost line and stops per driver-day exposes which accounts are being subsidized. Urban metros target 22-32 stops per driver-day; rural feedlot territory runs 14-20. Below benchmark means small-ACV accounts are costing more to serve than they return, and the fix is consolidation, common-carrier shift, or a raised order minimum.
It ranks below rebate capture because density is a cost-to-serve lever, not a revenue lever, and above auto-replenishment penetration because it applies to owned-fleet distributors rather than 3PL users. Pair it with ACV per account: a low-density route full of high-ACV clinics is a different problem than one full of marginal stops.
6. Auto-Replenishment Penetration KPI
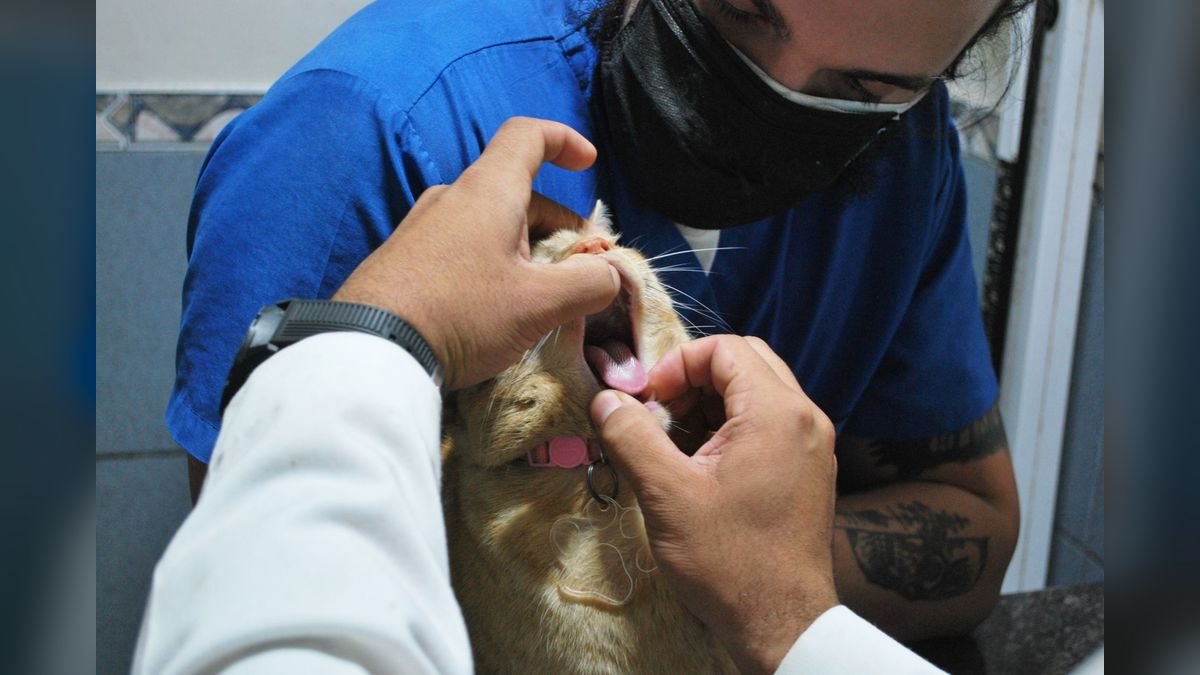
Auto-replenishment penetration ranks sixth because it is the structural retention moat, targeting 35-55% of active accounts on PIMS-integrated ordering through AVImark, Cornerstone, ImproMed, ezyVet, or eVetPractice. Auto-replenish accounts retain at roughly 2.3x the rate of manual-ordering accounts and carry 41% higher ACV at about half the cost-to-serve.
It ranks below route density because integration takes quarters to build, while route changes take weeks, and above active account count because penetration predicts next year's retention. The trade-off is integration fragility: a misconfigured PIMS update can silently stop orders for six weeks, so weekly health checks matter as much as enrollment.
7. Active Clinic Account Count KPI

Active clinic account count ranks seventh as the headline lagging indicator: accounts placing at least one order in the trailing 90 days. A healthy mid-market regional distributor runs 1,800-4,500 active accounts per territory, while nationals like Covetrus and MWI Animal Health operate 35,000-55,000 active US clinic accounts. Watch the 90-day rolling number, never the annual figure.
It ranks below auto-replenishment penetration because dormancy is the symptom and integration gaps are often the cause, and above ACV because count without value is vanity. A rising account count alongside falling revenue per account usually means new small clinics are masking share loss at established hospitals.
8. Revenue Per Veterinary Account KPI

Revenue per veterinary account ranks eighth because it exposes the second-source problem: clinics splitting purchases with a competitor. Companion-animal independents average $85K-$180K ACV, corporate-owned hospitals run $220K-$650K, and large livestock operations can exceed $1.4M. Any multi-doctor practice above $2M in clinic revenue should pull more than $250K in distribution spend.
It ranks below active account count because ACV is meaningless without knowing how many accounts are genuinely active, and above net revenue retention because it is a snapshot rather than a trend. Segment it carefully: blending independents and corporate hospitals into one average hides which channel is actually growing.
9. Net Revenue Retention KPI
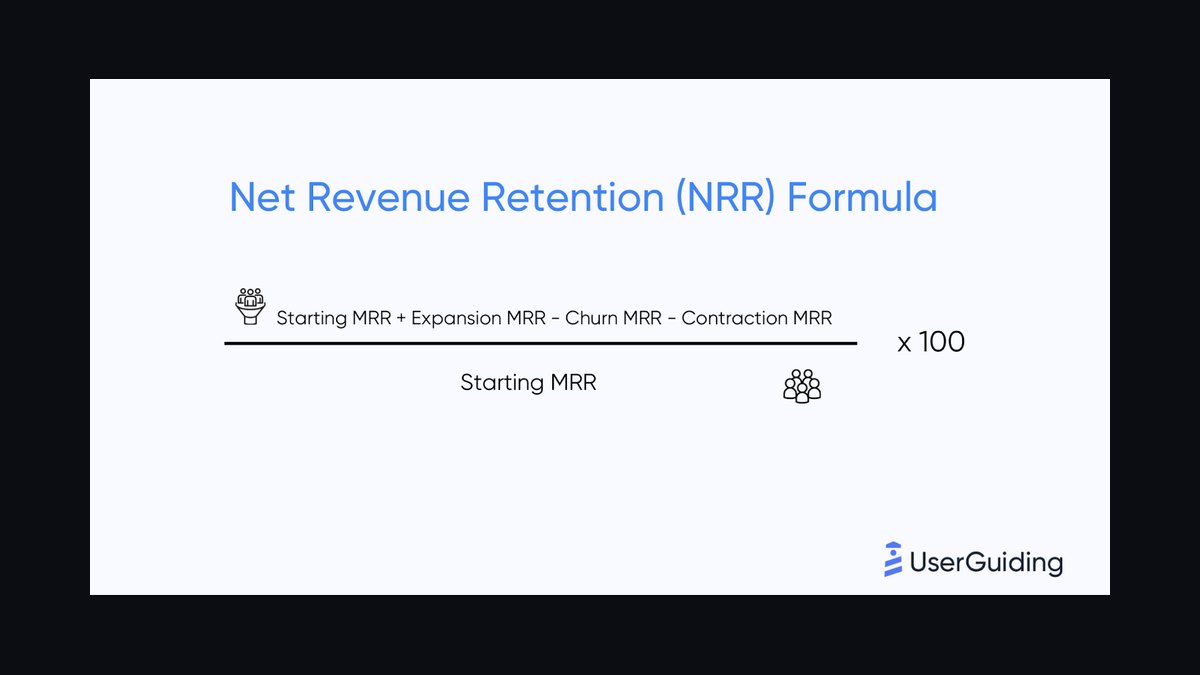
Net revenue retention by clinic cohort ranks ninth because it is the quarterly truth-teller on whether the book is growing or quietly shrinking. Healthy independent cohort NRR runs 104-112%; corporate cohorts swing 88-118% because RFP cycles and Mars, NVA, or BluePearl consolidation can flip eight-figure books on 36-month renewals.
It ranks below revenue per account because NRR requires clean cohort data that many distributors lack, and above nothing here since it closes the list. Below 100% NRR on the independent cohort is the canary: clinics are shifting wallet share to a competitor while still counting as active, and the fix is a nine-month renewal calendar with executive coverage.
10. QBR Coverage KPI

QBR coverage ranks tenth because it is the operational discipline that makes the higher-ranked KPIs move: the percentage of top-200 accounts receiving an in-person or video quarterly business review. It is the mechanism for surfacing rebate tier thresholds, catching declining order velocity, and defending against competitive displacement before the RFP lands.
It ranks last because it is an input rather than an outcome, but it directly drives rebate capture and net revenue retention above it. Distributors that skip QBRs at the group level, not just the clinic level, typically discover a lost corporate contract through a 90% order drop two months after award.
How we ranked these
We ranked nine KPIs by weighting leading operational indicators above lagging financial ones, because fill rate, DEA compliance, and route density predict account retention better than trailing revenue. Each KPI was scored on measurability, sensitivity to rep behavior, and margin impact. Weighting favored metrics that move within a quarter and can be reviewed daily or weekly, not annually.
We deliberately excluded total revenue, headcount, and market share because they are outcomes, not levers, and they hide account-level decay. We also ignored generic CRM activity metrics like call volume, since veterinary distribution is a compliance-gated, route-economics business where a single DEA lapse or cold-chain excursion outweighs any activity score. Vanity pipeline numbers were dropped for the same reason.
What to look for
Choose based on your account mix first: if corporate groups exceed 30% of revenue, prioritize NRR-by-cohort and rebate capture over route density, because RFP cycles and back-end tiers decide your margin. If you run independent clinics, route density and auto-replenishment penetration matter more, since cost-to-serve and retention drive profitability on smaller ACVs. Match KPI depth to your data stack.
The mistake most buyers make is adopting a national distributor's KPI set without the infrastructure to feed it. A regional operator copying Covetrus-style auto-replenishment targets without PIMS integrations will chase phantom numbers. The second mistake is reviewing lagging KPIs monthly while ignoring daily fill rate and DEA reconciliation, which is where accounts are actually lost.
Related questions
Why is DEA compliance pass rate a sales KPI rather than a legal one?
Because a single Schedule II compliance failure freezes the entire distribution center and kills clinic relationships overnight. Reps who cannot verify DEA registration, state licenses, and 222-form authority before onboarding lose ketamine and butorphanol lines, which anchor a hospital's purchase order. Tracking pass rate per rep and per DC turns compliance into a leading sales indicator, not a back-office checkbox.
How does route density affect gross margin in veterinary distribution?
Every stop below benchmark means freight and driver time are subsidizing a small-ACV account. Urban routes should hit 22-32 stops per driver-day; rural feedlot routes run 14-20. Falling below those thresholds forces a choice: consolidate routes, push the account to common-carrier next-day, or raise order minimums. Route density is effectively a cost-to-serve KPI disguised as logistics.
What makes vaccine-line gross margin the best leading indicator of margin health?
Biologics and refrigerated injectables run 18-28% margin versus 6-12% on commodity oral pharma, so a shift in vaccine mix moves blended margin faster than any pricing action. Tracking per-SKU reveals whether you are losing rebate tiers or eating cold-chain write-offs. Below 16% blended signals structural problems that will show up in net revenue retention two quarters later.
Why measure net revenue retention by clinic cohort instead of overall retention?
Blended retention hides the difference between independent clinics growing 104-112% and corporate cohorts swinging 88-118% on RFP outcomes. Splitting by acquisition year and ownership type exposes whether you are actually expanding wallet share or just masking churn with new logos. Below 100% NRR on the independent cohort is the earliest signal that clinics are quietly shifting spend to competitors.
How does auto-replenishment penetration change the economics of a territory?
PIMS-integrated auto-replenish accounts retain at roughly 2.3x the rate of manual-ordering clinics and carry about 41% higher ACV, with roughly half the cost-to-serve. That combination means every point of penetration compounds margin and reduces rep workload. Distributors targeting 35-55% penetration are building a structural moat that e-commerce competitors cannot easily dislodge once integrations are live.
What is the realistic margin upside from improving rebate capture?
Moving from 65% to 80% capture lifts blended gross margin by roughly 150-300 basis points depending on product mix. On a $400M book that is $6M-$12M of recovered margin annually. The work is mostly QBR discipline: identifying clinics within 5-10% of a tier threshold, showing them the math, and closing the gap before quarter-end.
Why is order fill rate split by commodity, biologics, and controlled substances?
A 97% blended fill rate can hide a 91% biologics rate that is actively bleeding accounts, because clinics tolerate commodity back-orders but not missed vaccine or controlled-substance lines. Biologics should run 98-99.5% and controlled substances 99%+. Measuring separately exposes the line-type failures that trigger second-source trials and account defection.
How should a distributor weigh ACV against active account count?
Active account count tells you reach; ACV tells you depth. A territory with 3,000 active clinics at $70K ACV is weaker than one with 1,800 at $180K, because cost-to-serve scales with stops, not revenue. Track both, but treat ACV growth and 90-day dormancy as the sharper signals of rep performance and competitive displacement.
FAQ
How do veterinary pharmaceutical distributors actually make money if front-end prices are nearly identical?
The visible sell price is a loss-leader; the P&L is built on back-end manufacturer rebates, cold-chain biologics margin at 18-28%, and PIMS-integrated auto-replenishment that drops cost-to-serve. Distributors capturing 80%+ of available rebates run 3-5 points higher gross margin than competitors stuck at 65%. Front-end pricing is table stakes, not the profit engine.
What is the right ACV expectation for an independent clinic versus a corporate hospital?
An independent companion-animal clinic with 2-3 DVMs and $1.8M-$2.5M in revenue should run $90K-$180K in distributor spend. A corporate-owned hospital under Mars Veterinary Health, NVA, or BluePearl typically runs $220K-$650K because the parent consolidates purchasing. Multi-DVM specialty hospitals can exceed $750K ACV.
How important is PIMS integration to retention?
It is the single largest structural retention factor. Accounts on AVImark, Cornerstone, ImproMed, ezyVet, or eVetPractice auto-replenishment retain at roughly 2.3x the rate of manual-ordering accounts and carry 41% higher ACV. The auto-replenish account does not shop competitors mid-cycle, which is why Covetrus and Vetcove built their competitive thesis around it.
What metrics should a territory manager review daily versus monthly?
Daily: order fill rate, controlled-substance reconciliation, cold-chain excursions, and back-order aging. Weekly: route density, rebate pacing, top-25 declining accounts. Monthly: active account count, ACV per account, vaccine margin, auto-replenish penetration. Quarterly: NRR by cohort, rebate settlement, QBR coverage. Flipping daily and monthly cadences hides the leading indicators.
How does corporate consolidation under Mars, NVA, and BluePearl change the sales model?
It shifts from a per-clinic relationship sale to a national RFP cycle with audited SLAs. Reps still call on clinics, but the contract sits with a regional director or VP of procurement. A distributor without VP-level corporate coverage loses 8-figure books on 36-month renewal cycles regardless of clinic service quality. Independent practice is still most of the count but a shrinking share of spend.
What is the realistic upside on manufacturer rebate capture if a distributor is at 65%?
Getting from 65% to 80% rebate capture moves blended gross margin by roughly 150-300 basis points depending on mix. On a $400M distribution book that is $6M-$12M of recovered margin per year. The work is almost entirely rep training and QBR discipline: identifying clinics within 5-10% of a tier threshold and closing the gap before quarter-end.
Why is cold-chain excursion rate a sales KPI and not just an operations metric?
Because a single 2-8C breach on Cytopoint or Librela triggers a write-off, a clinic complaint, a manufacturer rebate clawback, and often a biologics switch to a competitor. Reps who own excursion-to-replacement workflows protect the highest-margin lines in the book. Excursion rate is therefore a direct leading indicator of biologics retention and margin.
How should a distributor handle a corporate group that loses an RFP?
Escalate to executive account coverage, run a group-level QBR even after the loss, and rebuild the 9-month renewal calendar with 180-day escalation triggers. Reps who only learn of the loss through a 90% order drop two months later have no recovery path. Post-loss, target the individual clinics for second-source share while the group contract runs out.
What is the biggest failure mode in auto-replenishment programs?
Misconfigured PIMS integrations during clinic software updates. Auto-replenish silently stops firing, the clinic does not notice for weeks, and runs out of core vaccines mid-season. Avoid with weekly integration health checks, alerts when an account drops below 50% of expected order frequency, and a rep callback workflow when the alert fires.
How does Vetcove change the competitive dynamics for legacy distributors?
Vetcove aggregates pricing and ordering across major distributors, which strips away the information asymmetry legacy reps relied on. Clinics can now compare line-item pricing in seconds. Distributors must compete on service depth, cold-chain reliability, auto-replenishment integration, and rebate transparency rather than on rep relationships alone.
Sources
- https://www.avma.org/resources-tools/animal-health-and-welfare/controlled-substances
- https://www.deadiversion.usdoj.gov/21cfr/cfr/1300/1300_1.htm
- https://www.fda.gov/animal-veterinary/products/animal-drug-products
- https://www.aphis.usda.gov/aphis/ourfocus/animalhealth/veterinary-biologics
- https://www.covetrus.com/
- https://www.mwiah.com/
- https://www.pattersonvet.com/
- https://www.henryschein.com/us-en/animal-health.aspx
- https://www.vetcove.com/
- https://www.avma.org/resources-tools/reports-statistics/market-research-statistics-us-veterinarians
Related on PULSE
- [More sales kpis for veterinary pharmaceutical distribution rankings and buying guides](/knowledge)
- [PULSE Tools and calculators](/tools)
- [Everything on PULSE RevOps](/)
This page will be disappearing soon. Save it to your device for $1 — or read it free while it is here.
@Kory-White- · if Venmo asks, the last 4 of my number are 2012
 pulse-industry-kpisTop 10 KPIs for Self-Storage Facilities in 2027
 pulse-industry-kpisTop 10 Sales KPIs for Commercial Home Health Care in 2027
 pulse-industry-kpisTop 10 Sales KPIs for Medical Practice Staffing & Locum Tenens in 2027
 pulse-industry-kpisTop 10 Sales KPIs for Hospital Group Purchasing Organization (GPO) in 2027
 pulse-industry-kpisTop 10 KPIs for Physical Therapy Clinics in 2027
 pulse-industry-kpisTop 10 Sales KPIs for Industrial Compressed Air Systems in 2027
 pulse-industry-kpisTop 10 Sales KPIs for Commercial Pharmaceutical Sales in 2027
 pulse-industry-kpisTop 10 Sales KPIs for Commercial Surgical Center and ASC in 2027
 pulse-industry-kpisTop 10 Sales KPIs for Specialty Coffee Roasting & Wholesale in 2027
 pulse-industry-kpisTop 10 KPIs for Plumbing Contractors in 2027