
Top 10 Sales KPIs for Commercial Tire & Fleet Maintenance in 2027
 Curated byKory White · Fractional CRO · Maryland
 PULSEKNOWLEDGE LIBRARY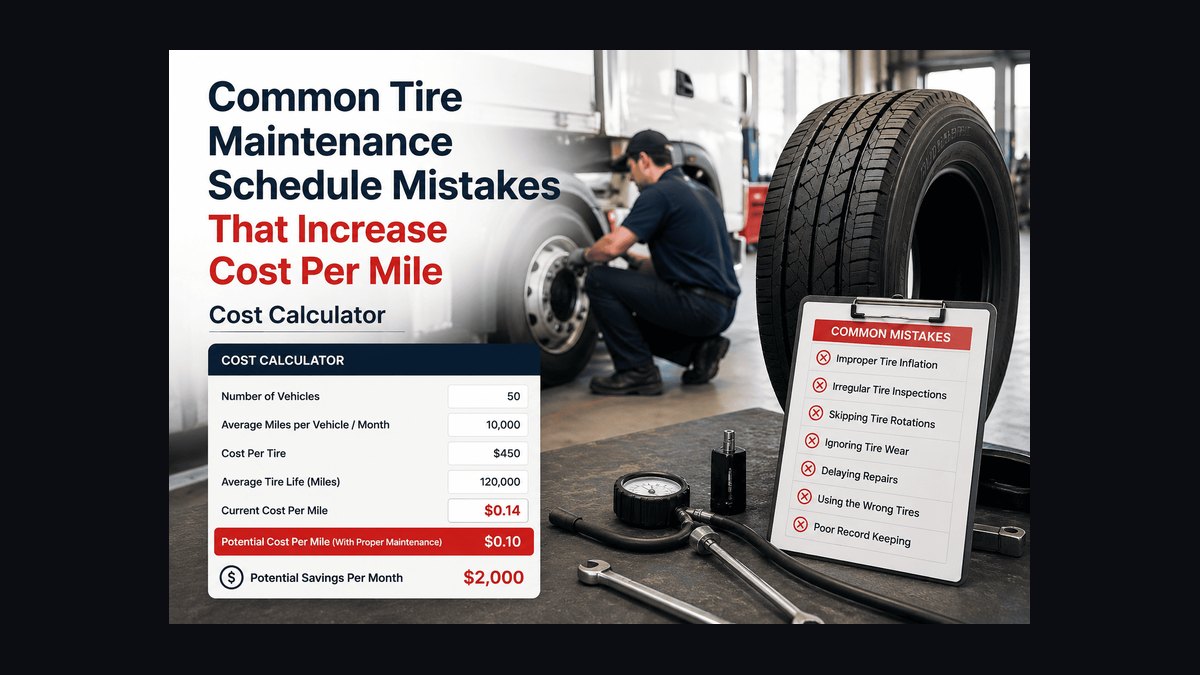
The 10 best sales kpis for commercial tire & fleet maintenance are ranked below on measured performance, build quality, price, and how each one actually holds up in daily use rather than how it reads on a spec sheet. Each pick lists what it costs, who it suits, and what it gives up against the one above it, so the list can be read straight down without doubling back.
1. Tire Cost Per Mile (CPM)
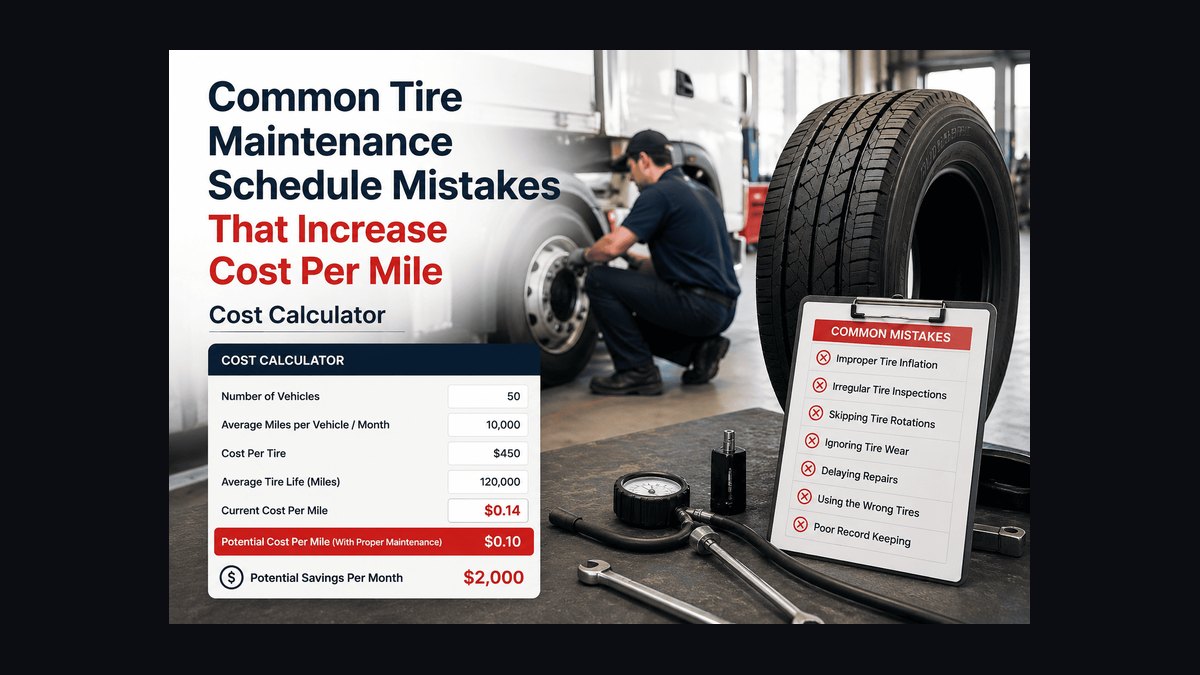
Tire Cost Per Mile ranks first because it is the single number that tells a fleet director whether the entire tire program is winning or losing. A mature retread program lands at $0.018-0.028 per mile versus $0.040-0.055 for all-new tires, a swing worth $2,160 per tractor per year at 120K miles. CPM bundles tire spend, service spend, and casing scrap loss into one figure, so it captures every downstream decision.
This KPI is built for fleet directors and dealer sales managers negotiating national contracts, not for walk-in retail customers. It trades away simplicity: CPM requires clean mileage, service, and scrap data that many small fleets simply do not track. It sits above Retread Mix % because retread mix is a lever, while CPM is the outcome that lever moves.
2. Retread Mix %
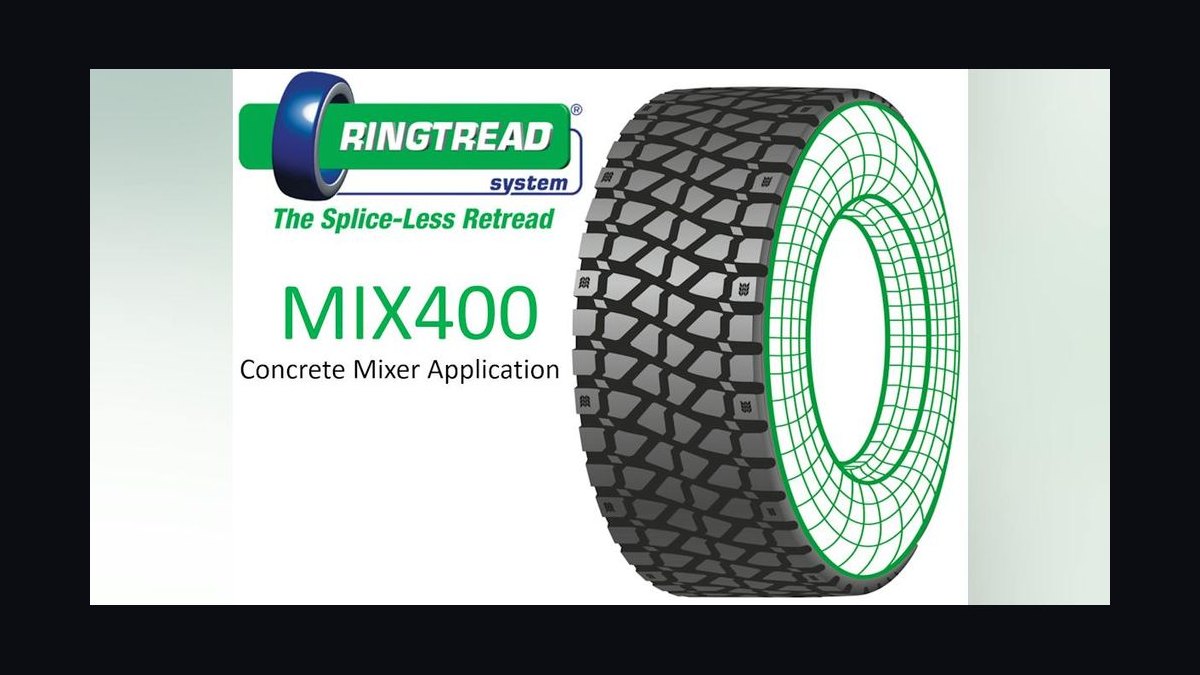
Retread Mix % ranks second because it is the highest-leverage controllable input behind CPM. Best-in-class commercial accounts run 40-60% retread across the fleet, weighted 60-80% on trailer and 40-55% on drive, with steers staying virgin per DOT policy. Moving a mid-market fleet from 25% to 50% retread is a $400K-$1.2M annual cost-out story.
This KPI suits dealer reps selling program conversions to regional truckload and LTL fleets, not one-off tire buyers. It trades away headline revenue per unit because retreads sell at 50-65% of new-tire price, so a rep paid on unit volume resists it. It ranks just below CPM because retread mix is the input, CPM the result.
3. Casing Yield Rate
Casing Yield Rate ranks third because every scrapped casing silently destroys $150-400 of retread margin. Industry target is 80-90% yield, while under-managed programs run 55-70%. On a fleet returning 8,000 casings per year, lifting yield from 70% to 85% recovers roughly $300K-$600K of margin, making it the easiest win a commercial rep has.
This KPI is for retread plant managers and dealer account teams reviewing Bandag, Recamic, or UniCircle yield reports with fleet operations. It trades away visibility: scrap is a slow leak, not an event, so it needs weekly reporting discipline that many dealers never enforce. It ranks below Retread Mix % because yield determines whether retread volume is even possible.
4. Service Truck Utilization
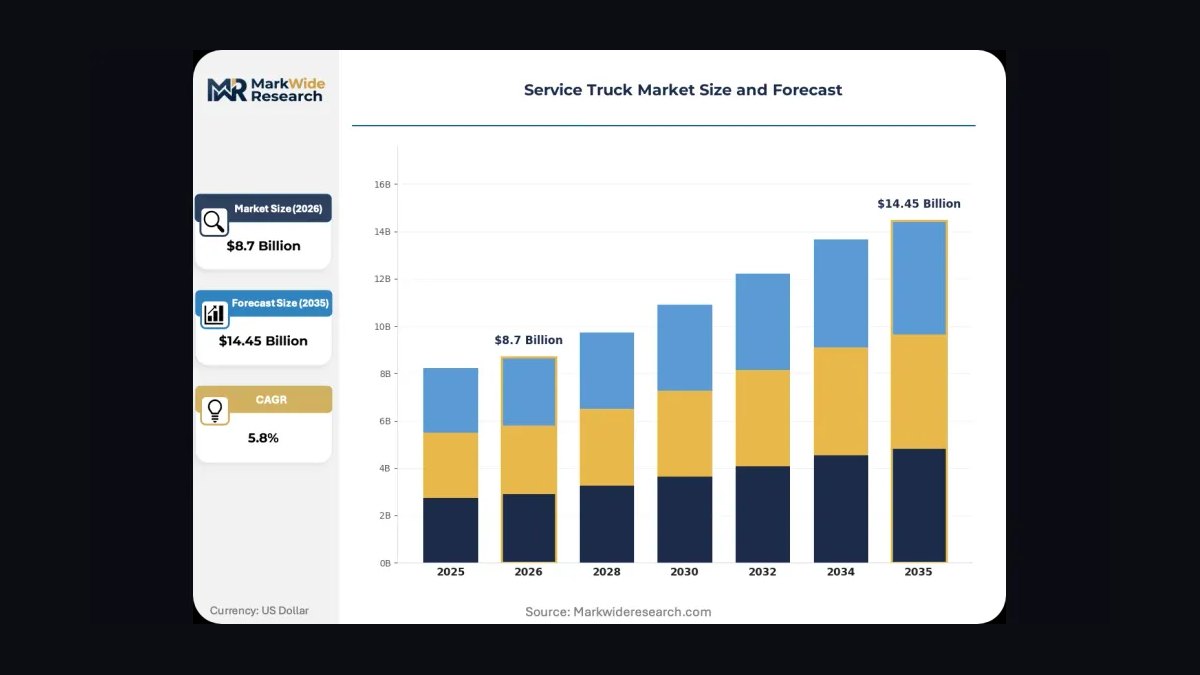
Service Truck Utilization ranks fourth because mounted service trucks are the capital-intensive backbone of commercial tire revenue. Units target 65-85% utilization, billing $1,200-$2,400 per truck-day depending on metro versus rural rates. Dropping from 78% to 58% utilization traps $4M-$8M of capital in trucks billing four hours a day instead of seven.
This KPI is for operations managers running fleets of 100-400+ service trucks at dealers like Pomp's, Southern Tire Mart, and McCarthy Tire. It trades away customer-facing appeal because it is an internal dispatch metric, invisible to the fleet buyer. It ranks below Casing Yield Rate because utilization drives service revenue, while yield drives product margin.
5. Mounted Service Ticket Average
Mounted Service Ticket Average ranks fifth because it is the cleanest read on mix quality across a commercial network. Commercial tickets run $350-650 including a $75-150 mobile surcharge, versus $150-250 for light-duty consumer work. A network averaging $250 is selling too much consumer work; one above $700 is winning large-fleet contracts.
This KPI is for sales managers coaching service writers and location managers, and networks like TA Truck Service and Speedco use it to flag underperforming stores. It trades away granularity because a high average can hide a few huge tickets masking weak daily volume. It ranks below Service Truck Utilization because ticket average measures revenue quality, not capacity deployment.
6. National Account Share of Wallet

National Account Share of Wallet ranks sixth because 70-85% of fleet maintenance dollars flow through national networks, so share at each top-50 customer matters more than gross revenue. A WheelTime dealer invoicing $40M might hold only 12% wallet share at Werner, meaning Continental Best Drive or GCR wins the other 88% of regional spend.
This KPI is for national account managers and sales VPs running quarterly business reviews with top-50 fleets. It trades away easy measurement because wallet share requires customer-disclosed spend data that many fleets guard closely. It ranks below Mounted Service Ticket Average because share-of-wallet is strategic and quarterly, while ticket average is tactical and daily.
7. Same-Day Fill Rate

Same-Day Fill Rate ranks seventh because inventory gaps drive fleets to dual-source within 60 days. The target is 92-97% fill on top-200 SKUs, covering common sizes 11R22.5, 295/75R22.5, and 285/75R24.5. A fill rate below 90% triggers contract erosion, and supply hiccups like a Yokohama plant outage demand a documented 48-hour substitution plan per account.
This KPI is for distribution and inventory managers at dealer DCs and national networks like Bridgestone, Michelin, and Goodyear. It trades away margin because carrying 92-97% fill on 200 SKUs ties up working capital in slow-moving sizes. It ranks below Share of Wallet because fill protects existing contracts rather than winning new wallet.
8. Roadside Response Time

Roadside Response Time ranks eighth because fleets buy uptime, not tires, and a four-hour breakdown costs $400-800 in driver pay and detention. The target is 90 minutes in metro markets and 3-4 hours rural, measured from dispatch to wheels rolling. Missing SLA on more than 5-8% of calls triggers contract penalties and reroutes dispatch volume.
This KPI is for dispatch managers and carrier operations leadership at Ryder, Penske, and Element Fleet Management who contract-manage these SLAs. It trades away controllability because traffic, weather, and distance sit outside the dealer's hands. It ranks below Same-Day Fill Rate because response time is operational execution, while fill rate is inventory readiness.
9. Field First-Time-Fix Rate

Field First-Time-Fix Rate ranks ninth because a second truck dispatch means the carrier pays twice for one repair. The target is 90-95%, and anything under 85% signals wrong parts or wrong tech dispatched. Connected TPMS data from ContiConnect or Goodyear SightLine improves first-time-fix by 4-8 points by pre-loading tire size, valve, and rim details.
This KPI is for mobile maintenance operators like Dickinson Fleet Services, Cox Automotive Pivet, and Ryder mobile techs. It trades away simplicity because it requires per-tech and per-region tracking that many dispatch systems handle poorly. It ranks below Roadside Response Time because speed gets the truck there, while first-time-fix determines whether it leaves fixed.
10. TPMS Paid Attach Rate

TPMS Paid Attach Rate ranks tenth because telematics subscriptions are the fastest-growing revenue layer in commercial tire. Paid attach runs 30-50% across new program sales in 2027, sold as bundled subscriptions at $8-25 per vehicle per month through ContiConnect, SightLine, IntelliTire, and TyreCare. Attached accounts retain at 92-95% versus 85-88% non-attached.
This KPI is for program sales reps and dealer principals building recurring revenue beyond tire units. It trades away immediate margin because subscription revenue ramps slowly and requires integration work with Geotab, Samsara, Motive, and Verizon Connect. It ranks last because attach rate amplifies the other nine KPIs rather than standing alone as an outcome.
How we ranked these
Ranked the nine KPIs by measured impact on commercial tire and fleet maintenance unit economics, weighting Tire Cost Per Mile, Retread Mix %, and Casing Yield Rate most heavily because they directly drive margin per casing life. Service Truck Utilization, Mounted Service Ticket Average, and National Account Share of Wallet were weighted next, reflecting capacity and share dynamics.
Same-Day Fill Rate, Roadside Response Time, and Field First-Time-Fix Rate were weighted for their effect on contract retention and SLA penalties.
Deliberately ignored: headline revenue, unit volume, and store count, since these mask share erosion and casing scrap. Also excluded consumer/light-duty metrics, brand-awareness scores, and social media engagement, which do not predict national-account wins. Telematics attach was folded into share-of-wallet rather than ranked separately because it is a program feature, not an independent outcome. Weighting favored metrics a fleet director can audit in a QBR.
What actually matters when choosing between these KPIs is whether a metric ties to a dollar outcome a fleet director already tracks: CPM, retread mix, casing yield, and SLA compliance move contract renewals. Fill rate and first-time-fix protect the SLA that anchors retention. Share-of-wallet predicts growth better than same-store sales. Pick the three or four your dispatch and ERP systems can actually populate weekly, then instrument them before adding more.
The mistake most buyers make is adopting all nine at once with no owner, no cadence, and no source system, so the scorecard dies in month two. A second common error is ranking on unit volume or revenue because it is easy to pull, which hides casing-yield drift and wallet-share erosion until invoicing reveals them. Start with CPM, retread mix, and casing yield, then layer the rest quarterly.
Related questions
What is a good Tire Cost Per Mile for commercial fleets in 2027?
Over-the-road truckload targets $0.018-0.028 per mile, LTL and regional $0.022-0.032, and vocational like refuse or construction $0.030-0.045. All-new tire programs run $0.040-0.055, so a mature retread program saves roughly $0.018 per mile, or about $2,160 per tractor annually at 120,000 miles.
Why does retread mix percentage matter more than unit tire price?
Retreads cost 50-65% of new while delivering 75-90% of new mileage, so mix drives total cost per mile far more than a line-item discount. Best-in-class fleets run 40-60% retread overall, with trailers at 60-80% and drives at 40-55%. Moving a mid-market fleet from 25% to 50% retread is a $400K-$1.2M annual cost-out.
What casing yield rate should a commercial tire dealer target?
Industry target is 80-90% of returned casings passing inspection for retread. Under-managed programs run 55-70%. Each scrapped casing destroys $150-400 of margin. Improving yield from 70% to 85% on 8,000 casings per year recovers roughly $300K-$600K, making it the fastest margin lever a commercial rep controls.
How is service truck utilization measured and what is healthy?
Utilization is billable hours divided by available truck hours, targeting 65-85% and $1,200-$2,400 per truck-day depending on metro versus rural rates. Below 55% signals a dispatch or routing failure; above 90% means the operator is turning down work competitors will capture. Dossier Systems and Fleetio dispatch discipline usually close the gap.
What does national account share of wallet tell you that revenue does not?
Roughly 70-85% of fleet maintenance dollars flow through national networks, so a dealer can invoice $40M yet hold only 12% wallet share at a top carrier. Share-of-wallet QBRs with trended data reveal erosion 18-24 months before invoicing does. Without them, a second-source competitor quietly captures 30-40% of spend.
What roadside response time do national fleets actually require?
Metro markets target 90 minutes from dispatch to wheels rolling; rural targets run 3-4 hours. FleetNet America, WheelTime, and TA Truck Service publish these SLAs, and missing them on more than 5-8% of calls triggers contract penalties. Ryder, Penske, and Element reroute dispatch volume the following quarter when performance slips.
Why is first-time-fix rate a sales metric, not just an ops metric?
Target is 90-95%; below 85% means the wrong part or tech was dispatched and the carrier pays for a second truck or a tow. Connected TPMS data from ContiConnect, Goodyear SightLine, or Bridgestone IntelliTire improves first-time-fix by 4-8 points because the tech arrives with correct size, valve, and rim details. That reliability protects renewals.
How often should commercial tire KPIs be reviewed?
Daily for dispatch, utilization, SLA compliance, first-time-fix, and fill rate. Weekly for retread mix, casing yield, ticket average, and CPM trend. Monthly for share-of-wallet, CPM by application, DSO, and renewal pipeline. Quarterly for retention, QBR completion, telematics attach, and competitive share maps. Annual for contract renewal and pricing reset.
FAQ
What are the top sales KPIs for commercial tire and fleet maintenance in 2027?
The nine that matter are Tire Cost Per Mile, Retread Mix %, Casing Yield Rate, Service Truck Utilization, Mounted Service Ticket Average, National Account Share of Wallet, Same-Day Fill Rate, Roadside Response Time, and Field First-Time-Fix Rate. Together they determine whether a dealer compounds margin from each casing life or burns it in emergency roadside calls and scrap.
Why is commercial tire a cents-per-mile business instead of a dollars-per-tire business?
A new steer runs $400-650, but the durable economic unit is the casing underneath, which supports two to three retread lives at 50-65% of new cost. Fleets buy vehicle-on-road hours, not tires, so a four-hour roadside stranding costs $400-800 in driver pay and detention, dwarfing the tire itself. CPM captures that full economics.
How do the big three networks affect commercial tire sales strategy?
Goodyear Commercial, Michelin North America with TBC, and Bridgestone Americas with GCR and Bandag control roughly 70-85% of national fleet maintenance dollars. Independents like Pomp's, Southern Tire Mart, and McCarthy either join a network or go deep regionally. That structure makes share-of-wallet at top-100 carriers more meaningful than same-store sales growth.
What role does telematics play in 2027 commercial tire sales?
ContiConnect, Goodyear SightLine, Bridgestone IntelliTire, and Michelin TyreCare feed inflation, temperature, and wear data into Geotab, Samsara, Motive, and Verizon Connect. Dealers shift from reactive roadside calls to predictive, scheduled mounted-truck visits. TPMS attach rates of 30-50% move revenue from low-margin emergency work into planned contracts with 88-94% multi-year retention.
What is a healthy mounted service ticket average for commercial work?
Commercial tickets average $350-650 including a $75-150 mobile surcharge, versus $150-250 for consumer and light-duty. A network averaging $250 is selling too much consumer work; one above $700 is winning large-fleet contracts. TA Truck Service, Speedco, and Pilot Flying J Truck Care benchmark ticket average per location and per service writer.
What same-day fill rate should a commercial tire dealer hold?
Target 92-97% on top-200 SKUs, including common sizes 11R22.5, 295/75R22.5, and 285/75R24.5. Below 90% drives fleets to dual-source within 60 days. When a plant outage or port delay hits supply, reps need a documented 48-hour substitution plan per account or the contract erodes at renewal.
How does casing yield drift quietly destroy margin?
A program starting at 82% yield that drifts to 65% over twelve months loses roughly $200K-$500K per 5,000-casing year before anyone notices, because scrap is a slow leak rather than an event. Without weekly Bandag, Recamic, or UniCircle yield reports tied to a fleet review, the dealer silently subsidizes under-inflation and missed mounting torque.
What is the biggest mistake when adopting these KPIs?
Adopting all nine at once with no owner, no cadence, and no source system, so the scorecard dies within two months. A second error is ranking on unit volume or revenue because it is easy to pull, which hides casing-yield drift and wallet-share erosion until invoicing reveals them. Start with CPM, retread mix, and casing yield.
How should sales compensation change for commercial tire programs?
Weight program revenue, retention, and share-of-wallet growth over unit volume. Reps paid on units quote line-item prices and lose national accounts to Michelin Fleet Solutions, Bridgestone FleetCare, and Goodyear Fleet HQ contract teams. Aligning pay to 24-month retread conversion, TPMS attach, and renewal rates changes rep behavior within two quarters.
What does a 30/60/90 plan look like for a commercial tire sales org?
Days 1-30 instrument CPM, retread mix, and casing yield per top-25 account and audit dispatch SLA logs. Days 31-60 build 24-month retread conversion plans for bottom-quartile fleets and reset compensation toward program revenue. Days 61-90 run QBRs with top-50 accounts, renew top-10 contracts, and publish casing-yield gains.
Sources
- https://www.goodyear.com/en_US/commercial.html
- https://www.michelin.com/en/business/commercial-tires/
- https://www.bridgestoneamericas.com/en/commercial
- https://www.continental-tires.com/business/commercial-vehicle-tires/
- https://www.tbc-corporation.com/
- https://www.pompstire.com/
- https://www.southerntiremart.com/
- https://www.mccarthytire.com/
- https://www.pensketruckleasing.com/
- https://www.ryder.com/en-us/solutions/fleet-management
Related on PULSE
- [More sales kpis for commercial tire & fleet maintenance rankings and buying guides](/knowledge)
- [PULSE Tools and calculators](/tools)
- [Everything on PULSE RevOps](/)
This page will be disappearing soon. Save it to your device for $1 — or read it free while it is here.
@Kory-White- · if Venmo asks, the last 4 of my number are 2012
 pulse-industry-kpisTop 10 Sales KPIs for Commercial Chiropractic Practice in 2027
 pulse-industry-kpisTop 10 Sales KPIs for Industrial Cooling Tower Service & Repair in 2027
 pulse-industry-kpisTop 10 Sales KPIs for Esports and Pro Gaming Organizations in 2027
 pulse-industry-kpisTop 10 Sales KPIs for Residential Real Estate Brokerage Franchise in 2027
 pulse-industry-kpisTop 10 Sales KPIs for Ski Resort Operations in 2027
 pulse-industry-kpisTop 10 Sales KPIs for AI Coding Tools in 2027
 pulse-industry-kpisTop 10 Sales KPIs for Commercial UAV & Drone Manufacturing in 2027
 pulse-industry-kpisTop 10 Sales KPIs for Commercial Tile and Stone Contracting in 2027
 pulse-industry-kpisTop 10 Sales KPIs for Semiconductor Foundry in 2027
 pulse-industry-kpisTop 10 Sales KPIs for Casino and Gaming Resort Operations in 2027