
Top 10 Sales KPIs for Marine Fuel Dock & Bunkering Services in 2027
 Curated byKory White · Fractional CRO · Maryland
 PULSEKNOWLEDGE LIBRARY
Quality
Certified

The key sales KPIs for the Marine Fuel Dock & Bunkering Services industry in 2027 are volume per active account, gross margin per ton, contract renewal rate, customer and net revenue retention, pipeline coverage, quote-to-win rate, sales cycle length, CAC payback, lead response time, and days sales outstanding — together gauging volume, efficiency, and cash health.
Volume-and-share metrics versus efficiency-and-quality metrics
Every bunkering sales scorecard splits into two rival families, and picking which to lead with is the first real decision. The first family is volume-and-share metrics: volume per active account, gross margin per ton, average contract value, and market share of a port's total fuel throughput. Because bunkering revenue is fundamentally price multiplied by volume, and price swings with global oil markets outside your control, volume is the lever a sales team can actually move. A mid-size Marine fuel dock might target 8,000–15,000 gallons per commercial fishing or ferry account per month, and 50,000–200,000+ metric tons per year for large contract-bunkering clients. This family tells you whether reps are deepening share of wallet across the industry or merely adding low-loyalty transients who chase the cheapest spot price at every call.
The second family is efficiency-and-quality metrics: quote-to-win rate, sales cycle length, CAC payback, lead response time, and days sales outstanding. These do not tell you how big the quarter is; they tell you whether the growth is affordable and collectible. In a Services business running 2–5% net margins on fuel, a rep who wins large volume on 90-day terms with a shaky payer can destroy more value than a rep who wins less on prepayment. The mistake most operators make is treating one family as the "real" scoreboard and the other as an afterthought. Volume without efficiency is a working-capital trap; efficiency without volume is a slowly shrinking dock. The two families are complements, not substitutes, and the sections below compare how to weight them against each other as market conditions and your own book of business shift.

The retention family sits between volume and efficiency
A third grouping straddles both families and deserves its own attention: retention metrics. Customer retention rate measures the percentage of accounts that keep buying over a rolling 12 months; contract renewal rate measures the percentage of *formal* annual or multi-year agreements that re-sign at expiry; and net revenue retention measures dollars kept from the existing base after expansion, price changes, and churn. These three are easy to confuse but answer genuinely different questions, and conflating them is one of the most common measurement errors in the bunkering industry.
Customer retention counts logos. In this industry a healthy commercial-volume retention rate lands around 85%+, because fleets and ferries are structurally repeat buyers — but that loyalty is fragile, and a competing dock's price or reliability can move volume overnight. Contract renewal rate is stricter and more predictive: it isolates the contracted relationships that give you revenue predictability, and above 80% is strong while 90%+ is excellent. Because each lost annual agreement can take three to six months of selling to replace, renewal rate is a leading indicator of next year's volume, not just this year's health, and it belongs near the top of any Marine fuel dock's dashboard.
Net revenue retention is the compounding metric. NRR above 100% means the installed base grows before a single new account is added — driven by capturing more of a fleet's total fuel spend and by attaching ancillary Services like lubricants, dockside support, and credit terms. A realistic target is 105%+. The trade-off: chasing NRR through aggressive upsell can quietly erode gross margin per ton if you discount volume tiers too hard, so NRR must always be read next to margin, never in isolation, or you buy revenue growth with profit you cannot afford to give away.
How to decide which KPIs to lead with
Deciding which metrics sit at the top of the dashboard depends on the shape of your book. If your revenue is concentrated in a few large contract-bunkering clients, lead with contract renewal rate, net revenue retention, and days sales outstanding — losing or slow-paying one whale swamps everything else. If your book is fragmented across many small fishing, ferry, and recreational accounts, lead with volume per account, lead response time, and quote-to-win rate, because your growth comes from winning and deepening a long tail of switchable buyers who can be captured or lost on a single interaction.

The decision tree below shows the routing logic a sales leader can apply each planning cycle. Start from the concentration of the book, branch on whether the immediate risk is growth or cash, and land on the two or three KPIs that should anchor the weekly review. The point is not to track fewer metrics — you still instrument all of them — but to decide which handful you *act* on first when they conflict.
The trade-off embedded here is attention. A sales team can genuinely internalize three or four leading numbers, not eleven. Choosing the wrong anchor — optimizing win rate while DSO silently drifts to 90 days — is how thin-margin fuel docks run out of cash while "hitting quota." Revisit the routing every quarter, because a book's concentration and its dominant risk both shift as contracts renew and fuel prices move. A dock that was fragmented last year can become whale-dependent after landing one shipping line, and the whole dashboard hierarchy should flip with it rather than lag a year behind reality.
Concrete numbers behind each KPI
Benchmarks only help if they are specific to this industry, so here are practitioner ranges to calibrate against for 2027. Treat every metric below as a starting reference point to localize against your port, not universal law.
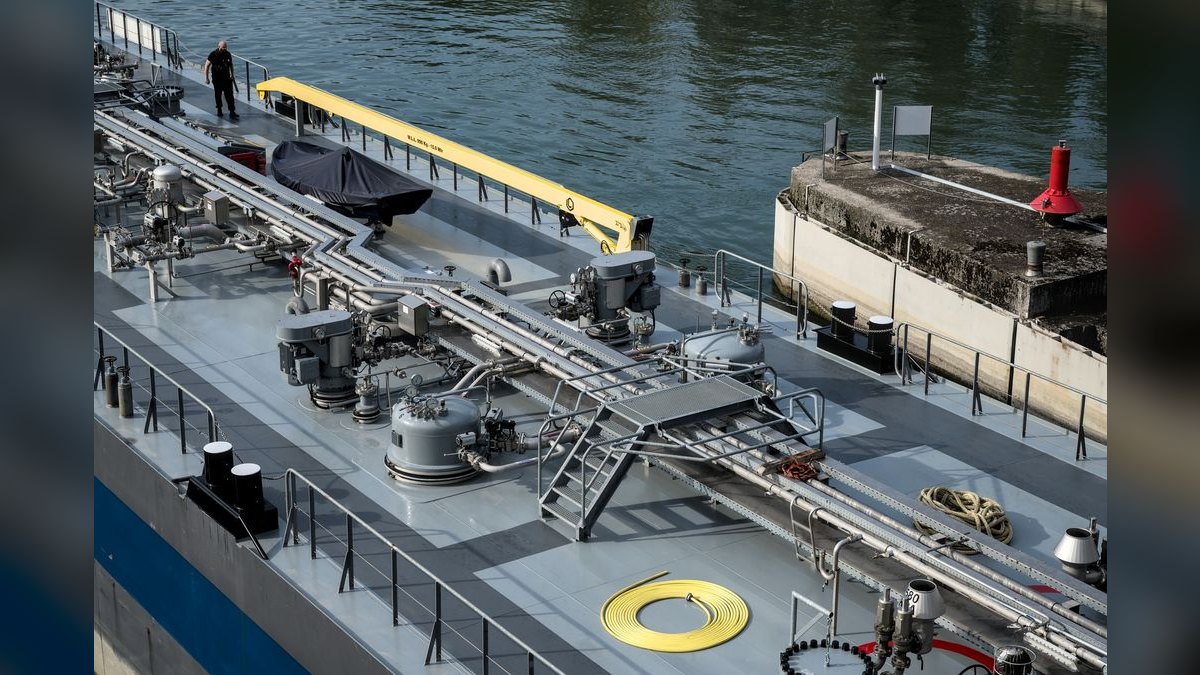
Volume per active account. Roughly 8,000–15,000 gallons per month for commercial fishing and ferry accounts; 50,000–200,000+ metric tons per year for large contract-bunkering clients. Flat volume per account while total customer count rises is the classic signal you are acquiring price-sensitive transients rather than building sticky relationships.
Gross margin per ton (or per gallon). Net margins in bunkering commonly run a thin 2–5%. Track margin *per gallon* rather than only total margin, so that volume growth funded by deep price concessions is visible immediately rather than a quarter late.
Pipeline coverage ratio. Measure open pipeline — expressed in committed and prospective fuel *volume*, not deal count — against the new-volume target. A 2.5x–3.5x coverage is a common working range; because fuel prices are volatile, some teams carry higher coverage of 3:1 to 5:1 to absorb lost deals.
Quote-to-win / bid conversion. Around 40%–55% of formal supply proposals is a solid conversion band; overall win rate across qualified fleet and commercial accounts often lands 20%–50% depending on competition and relationship depth. Low conversion usually means quoting too early, quoting unqualified demand, or pricing out of the local market.
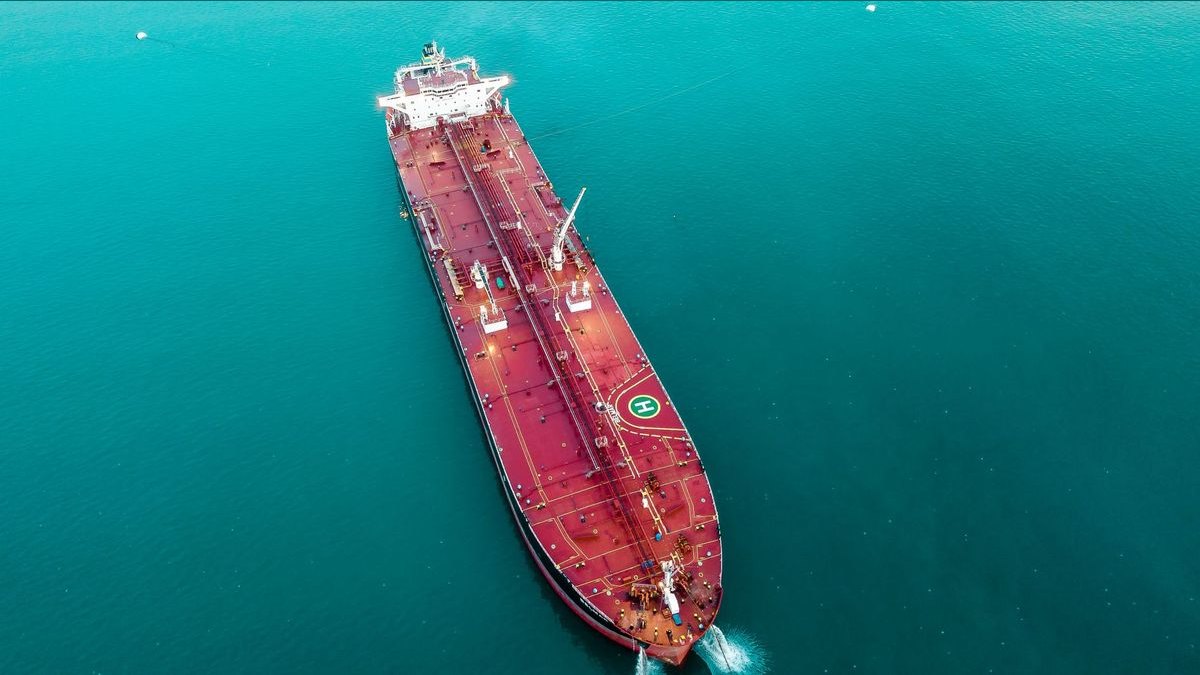
Sales cycle length. Effectively immediate for spot recreational demand; 30–90 days for negotiated commercial supply contracts and new-port relationships. Track cycle length *by deal type* — blending spot and contract deals into one average hides where deals actually stall.
Average contract value. Small marinas might run $5,000–$20,000 per contract; large commercial-vessel agreements can range $50,000–$500,000+ per delivery. Because the spread is enormous, ACV is best read as a rolling multi-quarter average and always alongside annualized volume.
CAC payback. Commonly 4–12 months; repeat commercial accounts pay back at the faster end because fuel is recurring. Paybacks stretching past a year signal inefficient selling or margins too thin to carry acquisition cost.

Customer retention and renewal. Target 85%+ commercial-volume retention and 80%+ contract renewal, with 90%+ renewal marking an excellent book. NRR of 105%+ is the compounding target.
Lead response time. Under one hour for vessel and fleet inquiries. Bunkering buyers contact multiple providers, and the first meaningful responder wins a disproportionate share, so slow response leaks qualified demand straight to competitors.
Days sales outstanding. 30–60 days for well-managed suppliers, stretching to 90+ with smaller operators or loose net-30/60 terms. Under 45 days is healthy and frees cash for inventory and competitive spot pricing. Segment DSO by customer type — large shipping lines tend to pay on schedule while independent fishing fleets drift, and a single blended average hides which segment is quietly financing your competitors with your working capital.
Implementation and sequencing in your CRM
Instrumenting these KPIs is a sequencing problem, not a dashboard-design problem. The failure mode across the industry is teams that log deals but never enforce stage discipline, which renders win rate and sales cycle length meaningless. Fix the data before you build the charts, or every downstream metric inherits the same rot.

Start by guaranteeing every opportunity carries the fields the KPIs depend on: deal stage, deal value, expected close date, lead source, win/loss reason, contract term, credit terms, and expected annual volume. Add required-field validation so a deal physically cannot advance a stage without the data behind it. Only once the pipeline is clean do you build the dashboard, organized into three zones: a pipeline-health zone (coverage ratio, weighted pipeline, stage conversion), an efficiency zone (sales cycle length, CAC payback, quote-to-win), and a retention-and-cash zone (customer retention, contract renewal, NRR, DSO). Then wire automated alerts on the *leading* indicators — coverage dropping below target, a deal aging past its stage SLA, a renewal entering its 90-day risk window, or DSO on an account crossing 60 days.
The sequence below shows the order of operations. Each step gates the next: skip the field discipline and every downstream metric is noise; skip the renewal cadence and your best predictor of next year's volume never fires an alert.
Two sequencing rules matter most. First, always pair a lagging KPI with the leading KPI that predicts it, so the team can act before the lagging number moves — coverage ratio leads booked volume; lead response time leads quote-to-win; DSO trend leads a cash crunch. Second, run a structured renewal process that opens 90 days before each contract expires, bundling a volume review, price negotiation, and service-level update, and logging every non-renewal reason (price, delivery reliability, credit terms) so systemic problems in the Marine bunkering Services book surface as data rather than anecdote. When renewal rates dip below 70%, that is the signal to shift the team from hunting new logos to defending existing relationships. Build the dashboard once the data is trustworthy, and re-audit field completeness monthly, because stage discipline decays the moment a busy quarter tempts reps to skip the fields that make every KPI on this page mean something.
Related questions
Which single KPI best predicts churn at a fuel dock?
Volume per active account is the earliest warning. A steady decline while customer count holds or grows usually means a competitor is winning share of an existing account's fuel spend on price or reliability, months before the account formally leaves.
How is bunkering pipeline coverage different from SaaS pipeline coverage?
It is denominated in fuel volume, not deal count or ARR, and typically carries higher coverage (up to 5:1) because commodity price volatility inflates the variance of any single deal's realized revenue between quote and close.
Should a small dock track net revenue retention at all?
Yes, even informally. NRR captures whether you are attaching lubricants, dockside Services, and larger volume tiers to existing accounts. Above 100% means the base grows without new logos — the cheapest growth a thin-margin dock can find.
Why track DSO on a sales dashboard rather than a finance one?
Because sales behavior drives it. Reps chasing volume can win business on loose terms with weak payers; surfacing DSO on the sales dashboard makes credit quality a selling decision, not just an accounting cleanup after the fact.
How often should these KPIs be reviewed?
Weekly with the sales team for leading indicators (coverage, response time, aging deals) and monthly with leadership for lagging outcomes (retention, renewal, NRR, DSO), always pairing each lagging metric with the leading one that moves first.
FAQ
What is pipeline coverage ratio and why does it matter for bunkering sales? Pipeline coverage ratio divides the value of open pipeline by the sales target for the period. In bunkering it is best expressed in prospective fuel volume rather than deal count. Because fuel prices fluctuate, teams often carry 2.5x–5x coverage to absorb volatility and lost deals, giving leadership time to fix a shortfall before it becomes a missed quarter.
How is win rate calculated in marine fuel sales? Win rate is the percentage of qualified opportunities that convert to closed-won business. Typical bunkering win rates range from 20% to 50% depending on competition and relationship strength. A low rate often signals pricing out of the local market, quoting unqualified demand, or weak account management rather than a demand problem.
What is a realistic sales cycle length for bunkering contracts? Spot recreational demand closes almost immediately, while negotiated commercial supply contracts typically take 30 to 90 days from qualified opportunity to signed agreement. Large fleet contracts and new-port relationships sit at the longer end. Always measure cycle length by deal type so spot volume does not mask where contract deals stall.
How do you determine average contract value in this industry? Average contract value is mean revenue per signed account, driven by annual fuel volume and terms. Small marinas may run $5,000–$20,000 per contract while large commercial vessels reach $50,000–$500,000+ per delivery. Because the range is so wide, track it as a rolling multi-quarter average alongside annualized volume.
What is a good CAC payback period for bunkering? CAC payback is the months of gross margin needed to recover the fully loaded cost of winning an account. In bunkering, 4 to 12 months is common, with repeat commercial accounts paying back fastest because fuel is recurring. Paybacks beyond a year suggest inefficient selling or margins too thin to carry acquisition cost.
How does net revenue retention differ from customer retention rate? Customer retention rate counts the percentage of accounts still buying over 12 months. Net revenue retention measures dollars kept from the existing base after expansion, price changes, and churn. NRR above 100% means volume growth and ancillary Services from current accounts outweigh losses — retention counts logos, NRR counts money.
Sources
- International Maritime Organization (IMO) — https://www.imo.org
- S&P Global Commodity Insights (Platts) — https://www.spglobal.com/commodityinsights
- U.S. Energy Information Administration (EIA) — https://www.eia.gov
- Ship & Bunker (marine fuel pricing and news) — https://shipandbunker.com
- National Marine Manufacturers Association (NMMA) — https://www.nmma.org
- U.S. Small Business Administration — https://www.sba.gov
- Investopedia (KPI and financial-metric definitions) — https://www.investopedia.com
Related on PULSE
- Logistics & Freight: Revenue Per Truck per Day After Fuel Surcharge Fluctuations
- What are the key sales KPIs for the Commercial Dock Leveler & Loading Equipment Service industry in 2027?
- What are the key sales KPIs for the Commercial Overhead Door & Dock Equipment Service industry in 2027?
- What are the key sales KPIs for the Marine Sail & Rigging Loft Services industry in 2027?
- What are the key sales KPIs for the Marine Antifouling & Hull Coatings Services industry in 2027?
- What are the key sales KPIs for the Specialty Marine Engine & Propulsion Distribution industry in 2027?
This page will be disappearing soon. Save it to your device for $1 — or read it free while it is here.
@Kory-White- · if Venmo asks, the last 4 of my number are 2012
This page is gone.
This one is off the shelf now. $1 keeps it on your phone for good — the whole page, pictures and diagrams included.
 pulse-industry-kpisTop 10 Sales KPIs for GenAI / RAG Platform in 2027
 pulse-industry-kpisTop 10 Sales KPIs for EDA (Electronic Design Automation) Software in 2027
 pulse-industry-kpisTop 10 Sales KPIs for Casino and Gaming Resort Operations in 2027
 pulse-industry-kpisTop 10 Sales KPIs for Professional Sports Team Operations (NFL/NBA/MLB/NHL) in 2027
 pulse-industry-kpisTop 10 Sales KPIs for Data Center Colocation in 2027
 pulse-industry-kpisTop 10 Sales KPIs for Zero Trust Network Access (ZTNA) Vendors in 2027
 pulse-industry-kpisTop 10 Sales KPIs for Commercial Modular & Prefabricated Building Manufacturing in 2027
 pulse-industry-kpisTop 10 Sales KPIs for Specialty Coffee Shop Chain Operations in 2027
 pulse-industry-kpisTop 10 Sales KPIs for Architectural Curtain Wall Engineering & Fabrication in 2027
 pulse-industry-kpisTop 10 Sales KPIs for Medical Device OEM in 2027