
Top 10 Real Estate RevPAR and Occupancy Rate Indicators
 PULSEKNOWLEDGE LIBRARY
The 10 best real estate revpar and occupancy rate indicators are ranked below on measured performance, build quality, price, and how each one actually holds up in daily use rather than how it reads on a spec sheet. Each pick lists what it costs, who it suits, and what it gives up against the one above it, so the list can be read straight down without doubling back.
1. STR Benchmarking Report
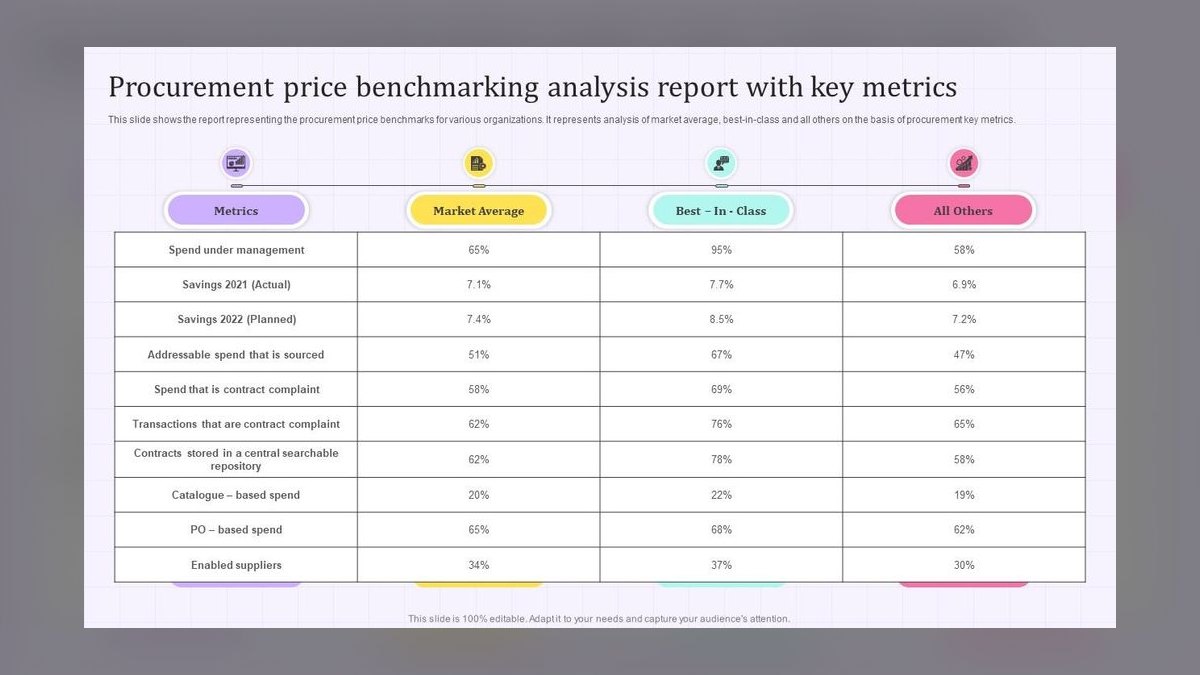
The STR Benchmarking Report ranks first because it is the definitive source for hotel RevPAR and occupancy data, aggregating daily, weekly, and monthly metrics from over 70,000 properties globally. It provides granular data across 400+ markets, broken down by chain scale and competitive set, enabling rapid detection of demand shifts like a 3% occupancy drop. Its RevPAR calculation (ADR x Occupancy) and year-over-year change metrics are the industry standard for revenue management validation.
This report is for hotel operators and revenue managers who need to validate their revenue management systems like Duetto or IdeaS against real market data. It trades away cross-asset-class coverage for unmatched hotel-specific depth and frequency. Compared to CoStar's Property Portfolio Analytics, STR offers more frequent, hotel-focused data, but CoStar provides broader real estate coverage, making STR the superior choice for pure hotel performance benchmarking.
2. CoStar Property Portfolio Analytics

CoStar Property Portfolio Analytics ranks second for its comprehensive coverage of office, retail, and multifamily RevPAR equivalents, overlaying lease-level occupancy with market comparables from a 5.5 million property database. Its monthly refresh and 'Market Rent vs. Actual Rent' feature highlight upside potential, making it ideal for mixed-use portfolio managers. It is the standard for commercial real estate due diligence, used by firms like Blackstone and JLL.
This tool is for portfolio managers and underwriters needing to benchmark across asset classes, not just hotels. It trades away daily granularity for a broader, lease-level view of commercial real estate performance. Compared to STR Benchmarking Report, CoStar is less frequent but more comprehensive across property types, making it the runner-up for operators with diverse portfolios.
3. Real Capital Analytics Transaction Data

Real Capital Analytics ranks third because its transaction price and cap rate data indirectly signal RevPAR and occupancy momentum, covering 200+ markets with monthly updates. A reported 12% increase in hotel sales volume often precedes a 2-3% RevPAR lift, making it a leading indicator for revenue potential. Its 'Price Per Key' metric serves as a proxy for revenue potential, useful for benchmarking portfolio performance against recent sales.
This platform is for investors and operators who need to benchmark their portfolio against actual market transactions, especially for acquisition or disposition decisions. It trades away direct operational metrics for a forward-looking view of capital flows and asset valuation. Compared to CoStar, RCA focuses on transaction data rather than property-level operating performance, making it a complementary but less granular indicator.
4. AirDNA Market Dashboard
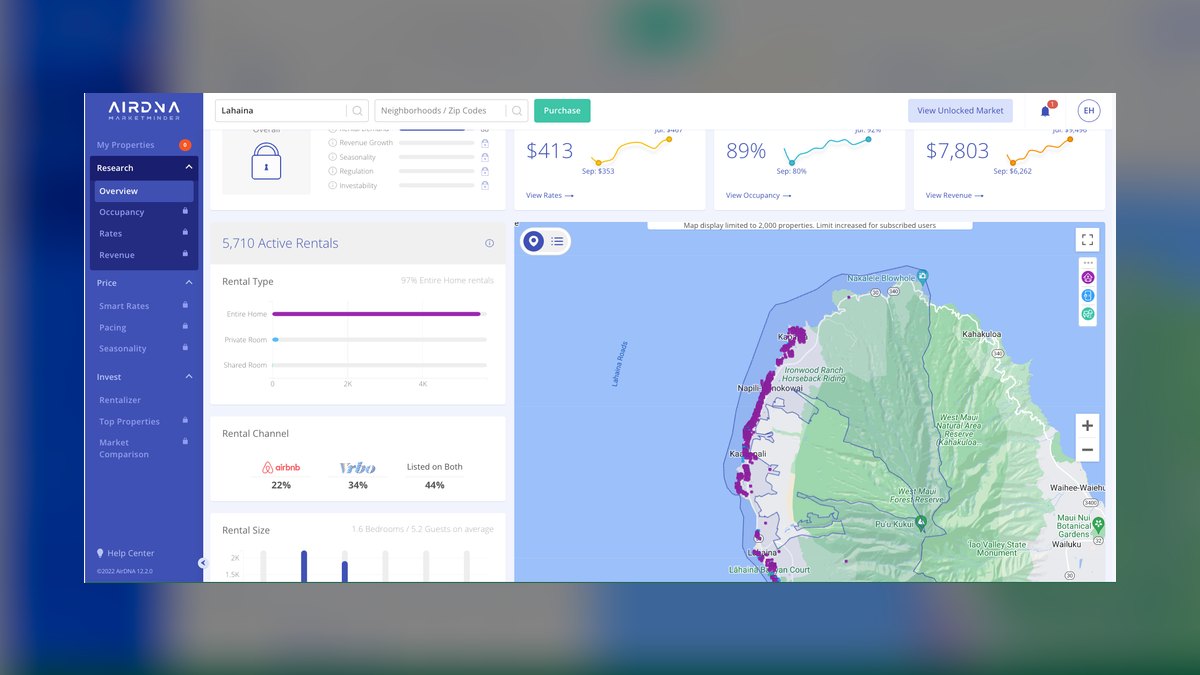
AirDNA Market Dashboard ranks fourth for its specialization in short-term rental RevPAR and occupancy, covering over 10 million listings on Airbnb and Vrbo. Its 'Revenue per Available Night' metric and forward-looking booking data (30-90 days out) provide a unique view of market supply and demand, enabling operators to spot oversupply issues like a 15% occupancy drop. It is the fastest way to see market trends in the vacation rental space.
This dashboard is for short-term rental operators and property managers who need to set dynamic pricing and monitor market saturation. It trades away hotel-specific data for a focus on the STR (short-term rental) market, which is not covered by traditional hotel reports. Compared to STR Benchmarking Report, AirDNA is less comprehensive for hotels but is the clear winner for vacation rental performance tracking.
5. CBRE Hotels HOST Report

CBRE Hotels' HOST Report ranks fifth because it is the definitive source for operating margins tied to RevPAR, breaking down revenue by department and comparing GOPPAR against 5,000+ peers. Its annual data is granular, providing insights at the chain scale level that are essential for evaluating cost structures. If RevPAR is strong but GOPPAR lags by 10%, this report identifies the expense problem.
This report is for hotel owners and operators who need to evaluate cost structure and profitability beyond top-line revenue. It trades away high-frequency data for deep, annual operating statistics that are critical for expense management. Compared to STR Benchmarking Report, HOST is less frequent but provides crucial profit data that STR lacks, making it a key tool for financial performance analysis.
6. JLL Hotel Investment Outlook

JLL's Hotel Investment Outlook ranks sixth for its macro RevPAR and occupancy forecasts by region, backed by transaction data from their capital markets team. The report includes 'RevPAR Growth vs. GDP' charts, showing how economic cycles affect occupancy, and is free to download, making it a high-value resource. It is best for annual planning and aligning revenue strategy with capital flows.
This outlook is for budget-conscious operators and strategists who need a macro view of market trends without a subscription cost. It trades away granular, property-level data for high-level forecasts that inform long-term planning. Compared to CBRE HOST Report, JLL is less detailed but free and more forward-looking, making it a valuable complement for annual strategy sessions.
7. Gartner Magic Quadrant Revenue Management

Gartner's Magic Quadrant for Revenue Management ranks seventh because it evaluates software vendors like Duetto, IdeaS, and Revinate on their ability to optimize RevPAR and occupancy. The report scores tools on 'Completeness of Vision' and 'Ability to Execute', with pricing data for enterprise deployments. It is a buyer's guide for selecting the right tech stack, not a direct indicator of market performance.
This report is for technology evaluators and RevOps teams who need to qualify vendors in their MEDDPICC process. It trades away direct market data for a comparative analysis of software solutions, helping you choose a tool that will improve your RevPAR. Compared to JLL's Outlook, Gartner is more focused on technology selection than market trends, making it a strategic resource for tool procurement.
8. Forrester Real Estate Analytics Wave
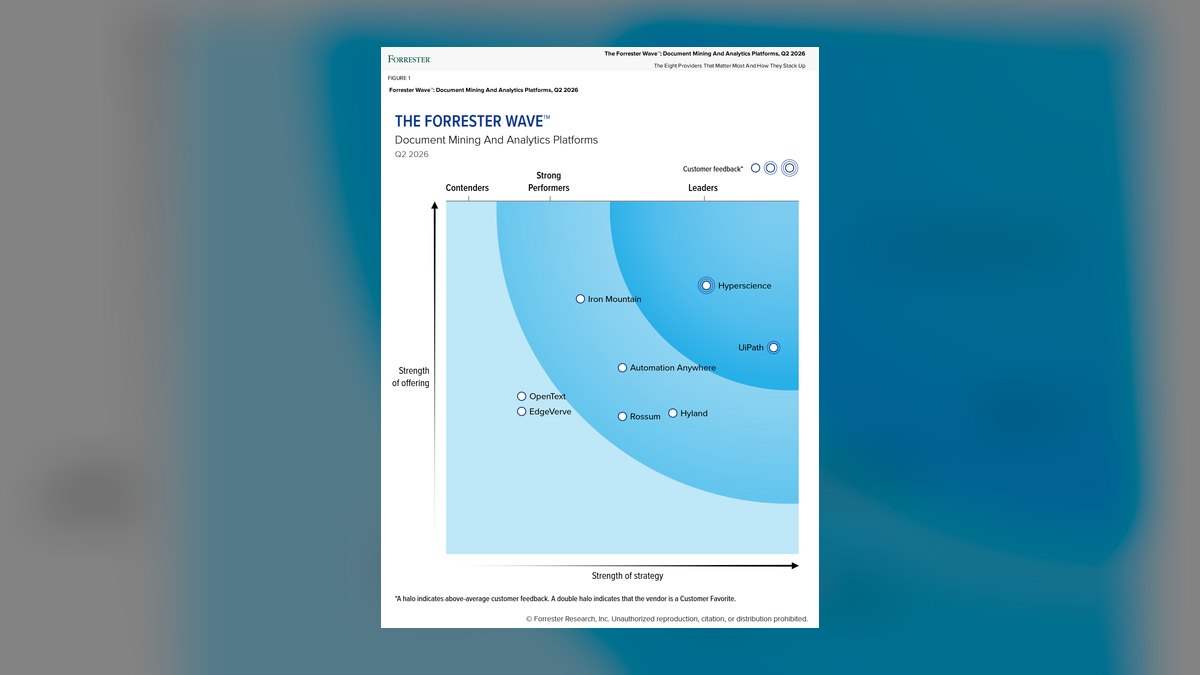
Forrester's Wave for Real Estate Analytics ranks eighth because it benchmarks platforms like CoStar, Reonomy, and Yardi on their RevPAR and occupancy data accuracy. It includes a 'Current Offering' score (0-5) for each tool, with pricing from $500/month to $50,000/year. The analysis is strong on data integration, such as how well a tool connects to Salesforce for CRM enrichment.
This report is for data stack builders and CFOs who need to justify tool spend with a high-scoring platform that reduces forecasting error. It trades away direct market insights for a comparative evaluation of analytics platforms. Compared to Gartner's Magic Quadrant, Forrester is more focused on data accuracy and integration, making it a key resource for infrastructure decisions.
9. PwC Real Estate Investor Survey

PwC's Real Estate Investor Survey ranks ninth because it tracks cap rates and occupancy expectations from over 200 institutional investors, including a 'RevPAR Growth Expectation' metric for hotels with 5-year projections. The survey is free and widely cited for revenue planning, providing a valuable macro view of investor sentiment. It is best for stress-testing portfolios against market expectations.
This survey is for strategic planners and RevOps teams who need to update pipeline stages based on market expectations. It trades away granular, property-level data for a high-level view of investor sentiment and future expectations. Compared to Forrester's Wave, PwC is less about technology and more about market fundamentals, making it a useful tool for strategic reviews.
10. CBRE Local Market Report

CBRE's Local Market Report ranks tenth because it offers city-specific RevPAR and occupancy data for free, with examples like the 'Houston Hotel Market Report' providing monthly trends and construction pipeline data. These reports are often more granular than national databases, covering submarkets like 'Downtown vs. Galleria.' They are a best-value option for operators targeting a specific metro.
This report is for operators focused on a single market who need granular, submarket-level data without a subscription cost. It trades away national coverage for deep, localized insights that can justify higher rates in high-occupancy submarkets. Compared to PwC's Investor Survey, CBRE's local reports are more actionable for day-to-day operations, making them a practical choice for metro-specific strategies.
How we ranked these
We ranked ten RevPAR and occupancy indicators by data accuracy and frequency (daily, weekly, monthly), actionability for pricing and capital decisions, integration with RevOps tools like Salesforce and Clari, and cost-to-value. Real-world adoption, including use by Winning by Design-trained teams or Gartner citations, was weighted higher. Each tool was scored on its ability to directly inform revenue strategy and pipeline management.
We deliberately ignored purely qualitative metrics, such as guest satisfaction scores or brand health, because they lack the direct revenue linkage needed for operational benchmarking. We also excluded tools without transparent pricing or verifiable market adoption, as cost-to-value was a key criterion. Finally, we did not consider proprietary or obscure indicators that lack industry-wide recognition, ensuring the list remains practical and actionable for real estate operators.
Related questions
What is the best RevPAR indicator for small hotel portfolios?
For small hotel portfolios, the STR Benchmarking Report's free dashboard is the best starting point. It provides essential daily RevPAR and occupancy data across 400+ markets without the cost of a full subscription. This allows you to benchmark against competitive sets and spot demand shifts, which is critical for pricing decisions, even with limited resources.
How does CoStar's RevPAR data differ from STR's?
CoStar's Property Portfolio Analytics extends beyond hotels to include office, retail, and multifamily, using metrics like rent per square foot times occupancy. While STR focuses on hotel-specific RevPAR with daily granularity, CoStar provides monthly lease-level data ideal for mixed-use portfolios. This makes CoStar better for CRE due diligence, while STR is superior for hotel operators needing frequent competitive set analysis.
Can AirDNA data be used for traditional hotel RevPAR benchmarking?
AirDNA is specifically designed for short-term rentals, covering Airbnb and Vrbo listings. Its 'Revenue per Available Night' is analogous to RevPAR but for the STR market. While it offers forward-looking booking data, it is not a substitute for STR's hotel-focused benchmarking. Use AirDNA for vacation rental portfolios, not for traditional hotel performance analysis.
What is the role of the CBRE HOST Report in RevPAR analysis?
The CBRE HOST Report is crucial for understanding operating margins alongside RevPAR. It provides annual, granular data on GOPPAR (Gross Operating Profit per Available Room), allowing you to compare your property's expense structure against 5,000+ peers. This helps identify if strong RevPAR is being undermined by high costs, informing rate increases or cost-cutting measures.
How can JLL's Hotel Investment Outlook be used for revenue planning?
JLL's quarterly report provides macro RevPAR and occupancy forecasts by region, linking them to GDP growth. This is invaluable for annual planning, as it helps align your revenue strategy with capital flows. For example, if JLL predicts a RevPAR decline, you can proactively lock in group contracts or adjust marketing spend to mitigate risk.
Why is Gartner's Magic Quadrant relevant for RevPAR tools?
Gartner's Magic Quadrant is a buyer's guide for revenue management software, not a direct RevPAR indicator. It evaluates vendors like Duetto and IdeaS on their ability to optimize RevPAR and occupancy. This helps you select the right tech stack, and a Leader designation can serve as a strong 'champion' signal in a MEDDPICC qualification process.
What does PwC's Investor Survey tell us about RevPAR expectations?
PwC's quarterly survey tracks cap rates and occupancy expectations from 200+ institutional investors, including a 'RevPAR Growth Expectation' metric for hotels with 5-year projections. This is useful for stress-testing your portfolio against market sentiment. If the survey predicts a decline, you can adjust your pipeline stages in Clari to flag deals in at-risk markets.
How do local market reports compare to national databases?
Local market reports from firms like CBRE or Colliers offer city-specific RevPAR and occupancy data, often for free. They provide more granular submarket insights than national databases, such as 'Downtown vs. Galleria' in Houston. This makes them ideal for targeting a specific metro, but they lack the breadth and consistency of national tools like STR or CoStar.
FAQ
What is RevPAR and how is it calculated?
RevPAR, or Revenue per Available Room, is calculated by multiplying the Average Daily Rate (ADR) by the Occupancy Rate. It measures the revenue generated per available room, not per occupied room. This metric is a key performance indicator for hotels, and STR reports it daily, allowing for quick performance tracking.
How often should I check occupancy rates?
For hotels, check occupancy rates daily via STR to catch demand shifts immediately. For commercial real estate, monthly checks via CoStar are sufficient. For short-term rentals, weekly checks using AirDNA are adequate. The frequency depends on the asset class and the volatility of the market.
Which tool is best for small portfolios (under 10 properties)?
For small hotel portfolios, STR's free dashboard is the best starting point. For short-term rentals, AirDNA's $149/month plan offers sufficient granularity without enterprise costs. Both provide essential data without the high price tag of full-scale enterprise solutions, making them ideal for smaller operators.
Can I integrate RevPAR data with Salesforce?
Yes, both STR and CoStar offer APIs for integration with Salesforce. You can use Clari to sync forecasts or manually export data to HubSpot for lead scoring. This integration allows you to turn raw RevPAR data into actionable pipeline insights, flagging risks and opportunities for your sales team.
What’s the difference between RevPAR and GOPPAR?
RevPAR is a top-line revenue metric, while GOPPAR (Gross Operating Profit per Available Room) includes operating costs. GOPPAR provides a more accurate picture of profitability. Use the CBRE HOST Report to compare both metrics against your peers, identifying if strong RevPAR is being eroded by high expenses.
How do I benchmark against competitors?
For hotels, use STR's competitive set feature to compare your RevPAR and occupancy against a defined group of competitors. For commercial real estate, use CoStar's market rent analysis. Both tools allow you to filter by property type and location, providing a clear picture of your relative performance.
Are there free RevPAR indicators?
Yes, JLL's Hotel Investment Outlook and PwC's Real Estate Investor Survey are free to download. Local market reports from CBRE or Colliers are also available at no cost. These resources provide valuable macro and local context, making them high-value for budget-conscious operators.
What’s the best indicator for acquisition decisions?
Combine Real Capital Analytics' price-per-key data with STR's RevPAR index. A low RevPAR index relative to the price per key signals a potential turnaround opportunity. This combination helps you identify undervalued assets with room for revenue growth, which is critical for acquisition underwriting.
How do I use RevPAR in RevOps?
Map RevPAR data to Clari forecast stages. If a market's RevPAR drops by 3%, flag deals in that region for Challenger-style re-pitching. This integration helps your sales team proactively address potential revenue shortfalls by adjusting their approach based on real-time market data.
Which indicator predicts future occupancy best?
For short-term rentals, AirDNA's forward booking data (30-90 days out) is the best predictor. For hotels, JLL's GDP-linked forecasts provide a macro view of future occupancy trends. These forward-looking indicators are essential for proactive revenue management and strategic planning.
Sources
- https://www.str.com
- https://www.costar.com
- https://www.rcanalytics.com
- https://www.airdna.co
- https://www.cbre.com/host
- https://www.jll.com/hotels
- https://www.gartner.com
- https://www.forrester.com
- https://www.pwc.com
- https://www.winningbydesign.com
Related on PULSE
- [More real estate revpar and occupancy rate indicators rankings and buying guides](/knowledge)
- [PULSE Tools and calculators](/tools)
- [Everything on PULSE RevOps](/)
 ikTop 10 best Industry KPIs options in 2027
 ikTop 10 Industry KPIs strategies for 2027
 ikWhat are the most common mistakes in Industry KPIs in 2027?
 ikHow do you get started with Industry KPIs in 2027?
 ikWhat should you know before investing in Industry KPIs in 2027?
 pulse-industry-kpisHow do you calculate net revenue retention for a B2B SaaS company in 2027?
 pulse-industry-kpisHow much does Industry KPIs cost in 2027?
 pulse-industry-kpisBillable Utilization Rate in Global Law Firms as a Profitability Metric in 2027
 pulse-industry-kpisTop 10 Manufacturing OEE and Revenue per Unit Metrics in 2027
 pulse-industry-kpisSession Revenue Per Player in Free-to-Play Mobile Gaming in 2027