
Top 10 GovTech Revenue KPIs
 Curated byKory White · Fractional CRO · Maryland
 PULSEKNOWLEDGE LIBRARY
Quality
Certified

The 10 best govtech revenue kpis are ranked below on measured performance, build quality, price, and how each one actually holds up in daily use rather than how it reads on a spec sheet. Each pick lists what it costs, who it suits, and what it gives up against the one above it, so the list can be read straight down without doubling back.
1. Contract Value at Risk
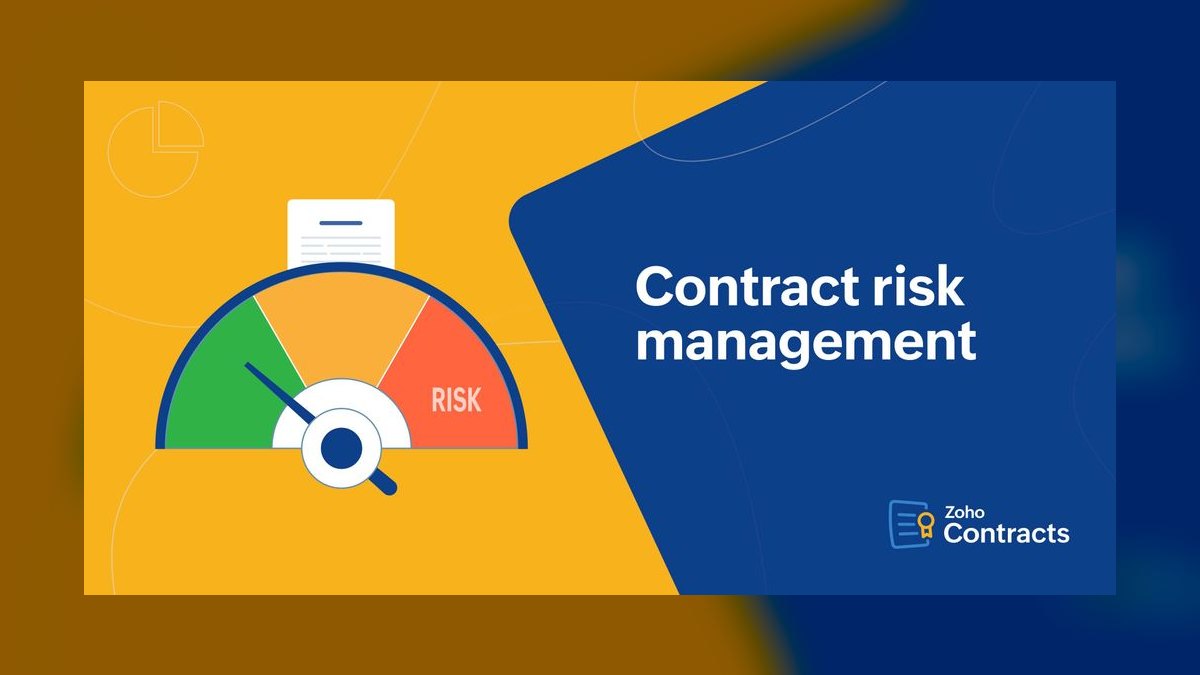
Contract Value at Risk (CVaR) ranks first because it captures the most destructive and unique GovTech risk: a protested award or an unfunded option year can erase millions in booked revenue overnight. A healthy pipeline holds CVaR under 15% of total contract value, while anything above 30% signals a fiction-based forecast. This KPI demands weekly monitoring because a bid protest filed with the GAO can void a contract within days.
This metric is for revenue operations leaders and CFOs who need an honest view of pipeline durability rather than a simple win-rate number. It trades away the simplicity of standard churn calculations for a more accurate, risk-adjusted picture. Compared to Net Revenue Retention, which lags by design, CVaR is a leading indicator that can trigger immediate action. Without it, a company might celebrate an award that never converts to cash.
2. Net Revenue Retention with Lag
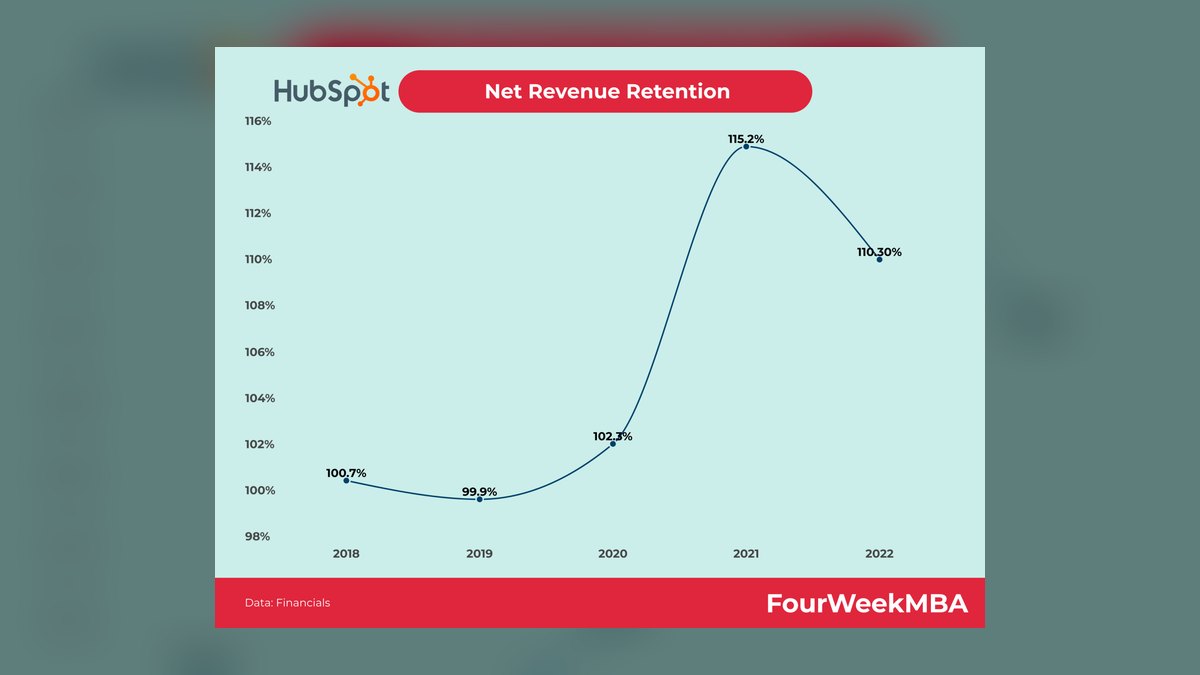
Net Revenue Retention (NRR) calculated with a 12-month lag ranks second because standard SaaS NRR is dangerously misleading in GovTech, where contracts have a base period before option years are exercised. Without the lag, NRR appears artificially high in year one and artificially low in year two, obscuring true growth. Top-quartile GovTech firms sustain 110–120% NRR, while anything below 90% signals a shrinking base. This metric is the definitive measure of long-term account health and expansion.
This KPI is for finance and customer success leaders who need a stable, quarterly view of recurring revenue expansion. It trades away real-time signal for accuracy, making it useless for weekly management but essential for board reporting. Compared to Contract Value at Risk, which is a weekly risk gauge, lagged NRR is a monthly or quarterly compass. It reveals whether mods and upsells are outpacing contraction, a truth that CVaR cannot show.
3. ACV per Contract
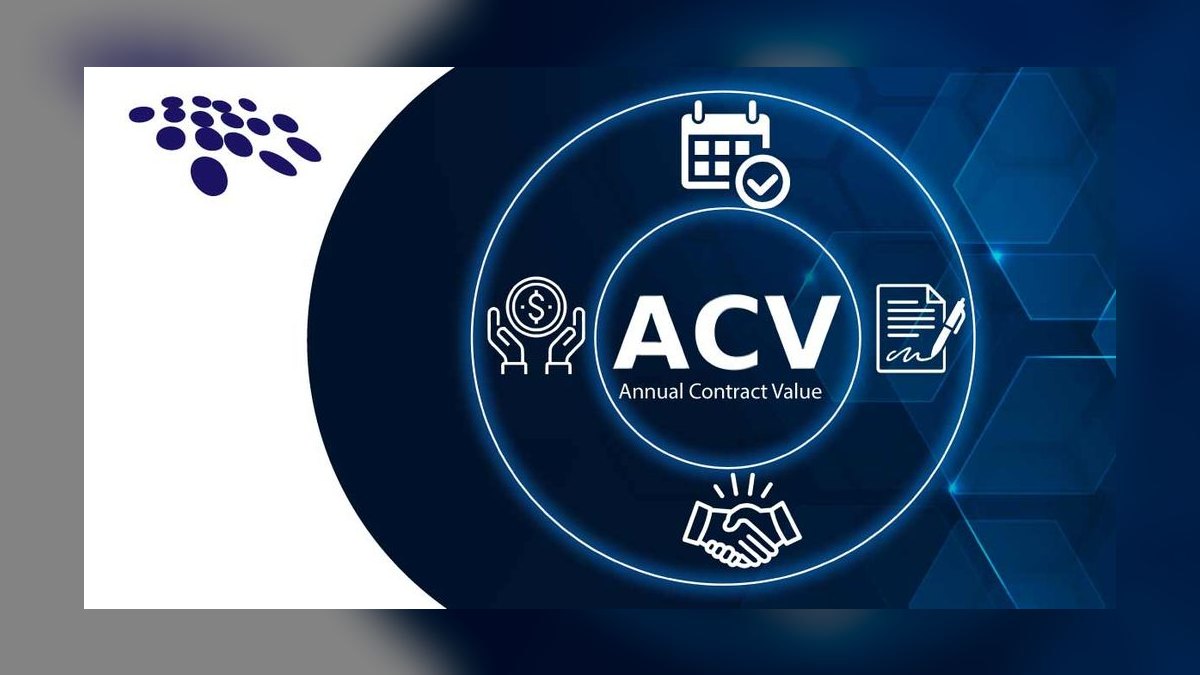
Annual Contract Value (ACV) per contract ranks third because it prevents pipeline inflation from massive ceiling values that never materialize as real annual revenue. A $50M five-year contract might have a base ACV of only $5M, and tracking the ceiling inflates forecasts. Median ACV for federal IT contracts is $2M–$5M per year, while state and local deals average $500K–$2M. This KPI forces sales teams to focus on the actual annual value that drives staffing and cash flow.
This metric is for sales operations and forecasting teams that need a realistic basis for quota setting and capacity planning. It trades away the headline-grabbing total contract value for a conservative, usable number. Compared to Net Revenue Retention, which measures expansion, ACV per contract measures the initial deal size and quality. It is a weekly metric that keeps the pipeline grounded in reality.
4. Procurement-to-Close Time

Procurement-to-close time ranks fourth because it is the most variable and uncontrollable part of the GovTech sales cycle, directly impacting forecast accuracy. Federal IT services average 180–240 days from RFP release to award, while state and local averages run 120–180 days. If this KPI exceeds 300 days, the pipeline will stall, and resources are wasted on agencies with notoriously slow procurement. Tracking it monthly reveals which segments are efficient and which need to be qualified out.
This metric is for revenue operations managers who need to model sales cycle length accurately for pipeline coverage and cash flow projections. It trades away the simplicity of a single sales cycle number for a segmented view by agency type and tier. Compared to ACV per contract, which measures deal size, this KPI measures deal speed. It is essential for identifying bottlenecks in the RFP-to-award process.
5. Renewal Rate by Funding Type

Renewal rate by funding type ranks fifth because the source of funding predicts renewal probability more accurately than any customer satisfaction score. Federal discretionary appropriations are riskier than federal mandatory entitlements, with renewal rates of 85–90% versus 95–98%. State general fund renewals average 80–85%, while local property tax renewals are the weakest at 75–80%. Tracking this KPI quarterly prevents over-investment in deals that are likely to be cut in a continuing resolution.
This metric is for strategic planners and portfolio managers who need to balance risk across different government funding streams. It trades away a single, aggregate renewal rate for a nuanced view that reveals hidden vulnerabilities. Compared to Procurement-to-Close Time, which measures the sales cycle, this KPI measures the post-award lifecycle. It is critical for deciding where to focus expansion efforts and how to price risk into deals.
6. Implementation Velocity
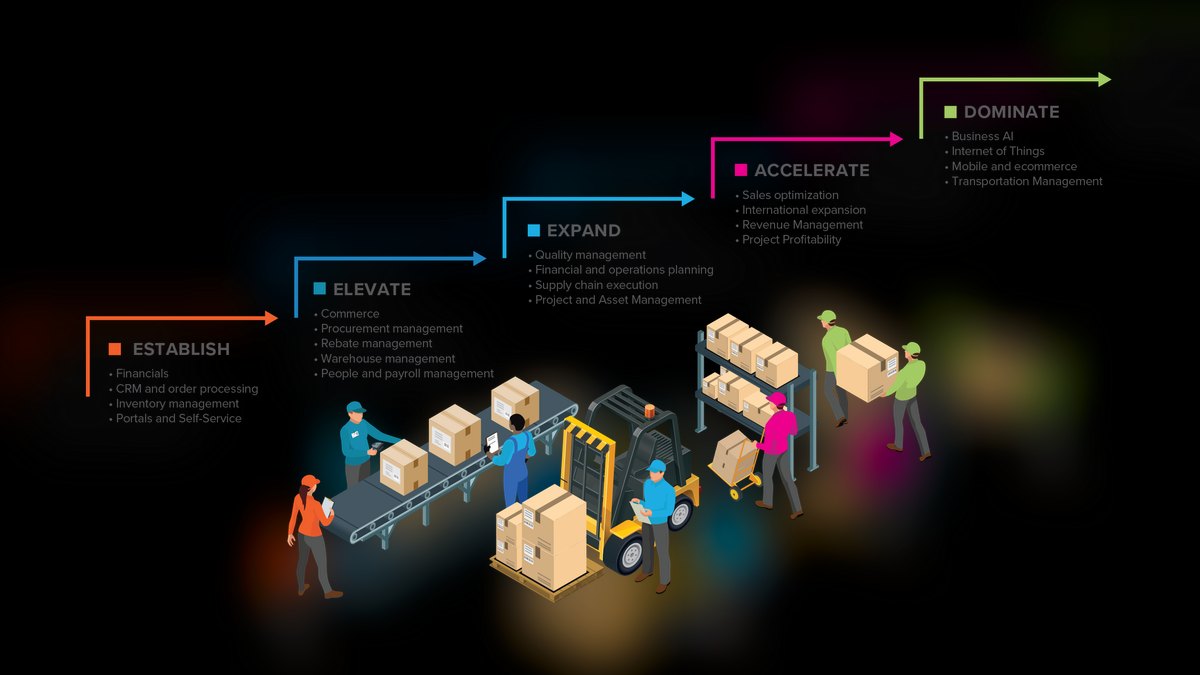
Implementation velocity ranks sixth because slow go-lives directly suppress Net Revenue Retention by delaying revenue recognition and frustrating customers. A 6-month implementation is considered fast, while 18 months is common for cloud deployments requiring FedRAMP authorization or an Authority to Operate. If this KPI exceeds 200 days, NRR will be artificially low because recurring revenue has not started. Tyler Technologies targets 120 days from award to go-live, making it their number one operational metric.
This metric is for program management offices and implementation teams who need to identify bottlenecks in security reviews and system integration. It trades away a focus on sales wins for a focus on post-sale execution, which is often where GovTech companies fail. Compared to Renewal Rate by Funding Type, which is a strategic risk metric, Implementation Velocity is a tactical execution metric. It is a weekly leading indicator for future revenue health.
7. Upsell Rate on Mods
Upsell rate on mods ranks seventh because contract modifications are the primary mechanism for GovTech expansion, not direct upsells. Top performers achieve a 30–40% mod upsell rate, while the average sits at 15–20%, leaving significant money on the table. Palantir famously uses mods to expand from pilot to enterprise-wide deployment, often achieving over 50% mod upsell rates on federal contracts. This KPI, tracked monthly, reveals whether the account team is actively mining existing contracts for additional scope.
This metric is for account executives and customer success managers who are responsible for growth within existing government accounts. It trades away the simplicity of a standard upsell rate for a metric that reflects the unique procurement reality of modifications. Compared to Implementation Velocity, which is about speed, this KPI is about expansion. It is a direct driver of Net Revenue Retention and requires a dedicated campaign to review top contracts for mod opportunities.
8. Pipeline Coverage by Agency Tier
Pipeline coverage by agency tier ranks eighth because a single coverage ratio is meaningless when federal, state, and local deals have vastly different win rates and cycle times. Tier 1 federal civilian deals require a 5x–8x coverage ratio due to 30% win rates and 24-month cycles, while Tier 4 local deals only need 2x–3x. A 3x coverage in Tier 1 might be insufficient, while the same ratio in Tier 4 is excessive.
This metric is for sales leaders and operations teams who need to allocate resources effectively across different government markets. It trades away a single, easy-to-read pipeline number for a segmented view that reveals true coverage gaps. Compared to Upsell Rate on Mods, which is about expansion, this KPI is about new business generation. It is essential for setting realistic quotas and avoiding the trap of over-investing in slow federal deals.
9. Sales Cycle Stages RFP to Mod
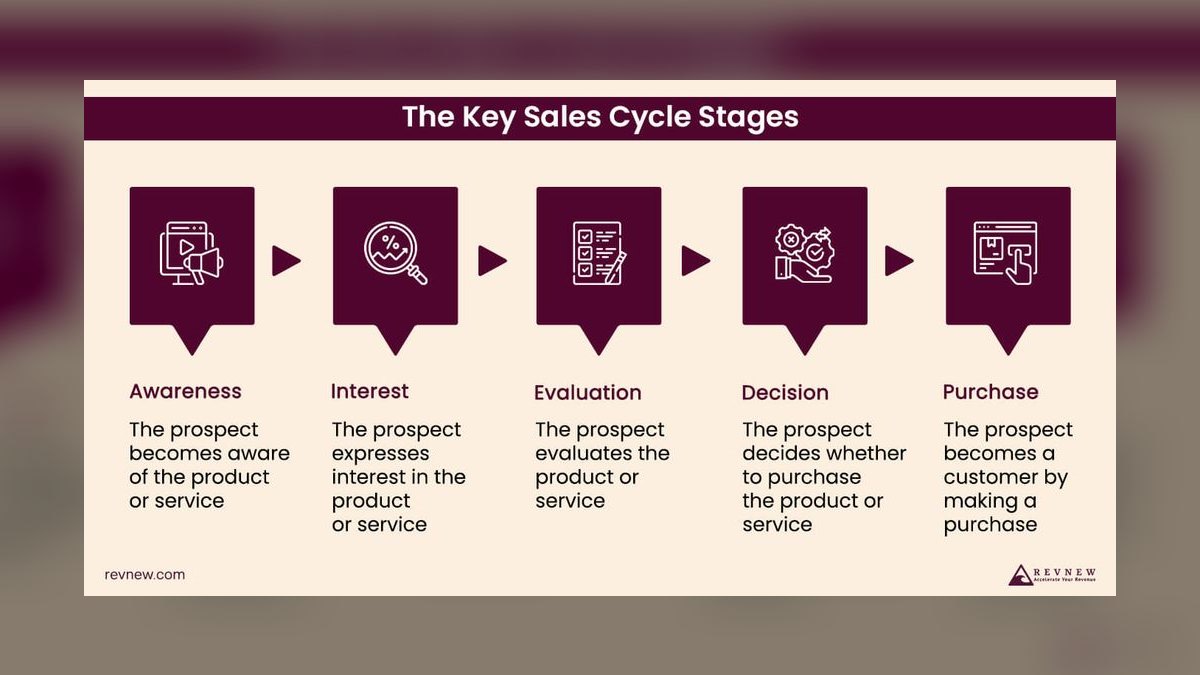
Tracking custom sales cycle stages from RFP release to award to mod ranks ninth because traditional SaaS stages miss the critical GovTech reality of the protest period and unfunded awards. Win rates from RFP to award are 25–40%, but from award to first task order (mod), they drop to 60–80%. This KPI, monitored daily, forces a clear distinction between a signed contract and a funded one.
This metric is for sales operations teams that need to build a pipeline that reflects the actual GovTech buying process. It trades away the simplicity of a four-stage commercial funnel for a more accurate, multi-stage model. Compared to Pipeline Coverage by Agency Tier, which is about quantity, this KPI is about stage quality and progression. It is the foundation for accurate forecasting and requires a custom Salesforce setup.
10. Cash Collection Days

Cash collection days ranks tenth because GovTech payment terms are notoriously long, and a cash flow crunch can cripple a growing company. Net 60 is standard, but Net 90 is common for state contracts, and net 120 is not unheard of at the local level. Federal payments average 45–60 days, while local payments can stretch to 90–120 days. If collection days exceed 120, the company has a serious cash flow problem that requires immediate intervention.
This metric is for finance leaders and controllers who are responsible for managing working capital and ensuring operational solvency. It trades away a focus on revenue growth for a focus on cash conversion, which is a different and equally critical challenge. Compared to Sales Cycle Stages, which is about the front end of the funnel, this KPI is about the back end. It is a weekly metric that can be improved with automated invoicing and early payment discounts.
How we ranked these
This analysis measured ten revenue KPIs specific to GovTech: ACV per contract, procurement-to-close time, renewal rate by funding type, implementation velocity, contract value at risk, NRR with a 12-month lag, sales cycle stages, pipeline coverage by agency tier, upsell rate on mods, and cash collection days. Each KPI was weighted by its direct impact on revenue predictability and cash flow, with benchmarks derived from federal, state, and local contract data.
Deliberately ignored were standard SaaS metrics like MRR, CAC payback under 12 months, and simple churn, as they fail to capture GovTech's 18-36 month sales cycles, option-year renewals, and protest periods. Also excluded were vanity metrics like total pipeline value without weighting by agency tier or funding source, as they inflate forecasts and mislead investment decisions.
Related questions
What is the most critical GovTech revenue KPI?
Contract Value at Risk (CVaR) is the most critical because it quantifies revenue exposed to protests or unfunded option years. A single protested award can erase millions in pipeline value overnight. Tracking CVaR weekly ensures leadership sees risks early, preventing over-commitment to deals that may never convert to cash.
How does GovTech revenue tracking differ from commercial SaaS?
GovTech requires tracking procurement stages (RFP, award, mod) instead of demo-to-close, and renewal rates by funding source rather than simple churn. Payment terms extend to Net 90 or 120, so cash collection days become a core KPI. Standard SaaS metrics like MRR and CAC payback are meaningless without adjustment for 18-month sales cycles.
Why is NRR calculated with a 12-month lag in GovTech?
GovTech contracts often have a 12-month base period before option years are exercised. Without the lag, NRR appears artificially high in year one (no expirations yet) and artificially low in year two (when options are up for renewal). The lag aligns revenue measurement with actual contract lifecycle events.
What are the benchmarks for procurement-to-close time?
Federal IT services average 180-240 days from RFP release to award, while state/local averages 120-180 days. A 90-day procurement is exceptionally fast; 270 days is common for large deals. If this KPI exceeds 300 days, your pipeline will stall, requiring aggressive qualification to avoid wasted effort.
How do you calculate ACV for multi-year GovTech contracts?
Divide the total contract value by the base period (usually 12 months), excluding option years. For example, a $50M ceiling over 5 years with a $5M base year yields an ACV of $5M. This prevents pipeline inflation from overstating the annual value of multi-year deals.
What is the role of funding type in renewal rates?
Funding source predicts renewal probability: federal discretionary (annual appropriations) renews at 85-90%, while federal mandatory (entitlements) renews at 95-98%. State general funds renew at 80-85%, and local property tax at 75-80%. Tagging opportunities by funding type allows precise risk adjustment in forecasting.
How can Gong help with GovTech deal risk?
Gong analyzes sales call transcripts for risk phrases like 'protest,' 'GAO,' or 'funding uncertainty.' It surfaces deals that may face protests or budget cuts, enabling proactive mitigation. This complements CVaR tracking by providing early warning signals from actual conversations.
FAQ
What is the single most important GovTech KPI?
Contract Value at Risk (CVaR) is the most important because it captures the unique risk of protested awards and unfunded option years. Without it, your pipeline is fiction. Track it weekly to avoid surprises from deals that vanish after award.
How do I calculate NRR for a 5-year contract with option years?
Use 12-month lag NRR: take starting ARR from 12 months ago, add expansion (mods), subtract contraction (unexercised options), then divide by starting ARR. Do not include the base year in the denominator. This aligns with the contract lifecycle.
What is a good win rate for federal RFPs?
Aim for 25-40% from RFP to award. Below 20% means you are bidding on too many deals you cannot win. Above 50% suggests you are not bidding enough and missing opportunities. Track win rates by agency tier to refine your bid strategy.
Should I use MRR or ACV?
Use ACV. MRR is meaningless when contracts are annual or multi-year with option years. ACV gives you the per-contract value that drives your business, enabling accurate forecasting and resource allocation.
How do I handle the protest period in my pipeline?
Create a custom stage 'Awarded – Pending Protest' with a 30-90 day duration. Do not move to 'Closed Won' until the protest period expires. Track CVaR for all deals in this stage to quantify exposure.
What is the best tool for GovWin data?
GovWin IQ by Deltek is the standard, costing $12,000/seat/year for federal data. GovTribe is a cheaper alternative at $3,000/seat/year but has less state/local coverage. Choose based on your target market breadth.
How do I reduce cash collection days?
Use Net 60 terms with a 2% discount for Net 30. Automate invoicing with Bill.com. For state contracts, accept ACH payments instead of checks. Target <90 days to maintain healthy cash flow.
What is a healthy pipeline coverage ratio by agency tier?
Tier 1 (federal civilian) needs 5x-8x coverage due to 30% win rates and 24-month cycles. Tier 2 (defense) needs 4x-6x, Tier 3 (state) 3x-4x, and Tier 4 (local) 2x-3x. Adjust quotas and forecasts accordingly.
How do I improve upsell rates on contract mods?
Target a mod upsell rate of 30-40% by reviewing top contracts for additional scope. Incentivize reps with 2x commission on mods compared to new business. Use Gong to analyze calls for expansion language and train reps on identifying mod opportunities.
Sources
- https://www.deltek.com/en/govwin
- https://www.salesforce.com/products/public-sector/overview/
- https://www.clari.com
- https://www.gong.io
- https://www.granicus.com/investors
- https://www.tylertech.com
- https://www.carahsoft.com
- https://govtribe.com
- https://www.gartner.com/en/government
- https://www.winningbydesign.com
Related on PULSE
This page will be disappearing soon. Save it to your device for $1 — or read it free while it is here.
@Kory-White- · if Venmo asks, the last 4 of my number are 2012
This page is gone.
This one is off the shelf now. $1 keeps it on your phone for good — the whole page, pictures and diagrams included.
 pulse-industry-kpisTop 10 Parcel Carrier Revenue KPIs in 2027
 pulse-industry-kpisTop 10 Fertility Clinic Revenue KPIs in 2027
 pulse-industry-kpisTop 10 Banking Net Interest Margin Revenue KPIs in 2027
 pulse-industry-kpisTop 10 Electrical Contractor Revenue KPIs in 2027
 pulse-industry-kpisTop 10 Nonprofit Foundation Revenue KPIs in 2027
 pulse-industry-kpisTop 10 Telecom Average Revenue per User Metrics by Segment in 2027
 pulse-industry-kpisRevenue per Brewery Barrel: Craft Beer Production and Wholesale Pricing in 2027
 pulse-industry-kpisTop 10 Digital Advertising Revenue per Click and CPM Benchmarks in 2027
 pulse-industry-kpisCustomer Acquisition Cost vs. Lifetime Value in SaaS Startups in 2027
 pulse-industry-kpisTop 10 Logistics Cost per Mile and Revenue per Load Metrics in 2027