
Top 10 Laundromat Revenue KPIs in 2027
 Curated byKory White · Fractional CRO · Maryland
 PULSEKNOWLEDGE LIBRARY
Quality
Certified

The 10 best laundromat revenue kpis are ranked below on measured performance, build quality, price, and how each one actually holds up in daily use rather than how it reads on a spec sheet. Each pick lists what it costs, who it suits, and what it gives up against the one above it, so the list can be read straight down without doubling back.
1. Revenue Per Square Foot

Revenue Per Square Foot ranks first because it is the only KPI that captures space utilization and revenue mix in a single number. A 2,000 sq ft store generating $400,000 annually posts a RevPSF of $200. Self-service-only stores benchmark at $150–$300; stores with wash-dry-fold reach $250–$500. Below $150 signals underutilized floor space or a bad machine mix.
This metric is for operators deciding whether to renovate, add services, or renegotiate a lease. It trades away diagnostic precision — it tells you the store is underperforming but not which machine or hour is at fault, which is why Washer/Dryer Turn Rate sits directly below it. Review RevPSF monthly, reconciled against QuickBooks, not weekly; the number moves too slowly for faster cadence.
2. Washer/Dryer Turn Rate
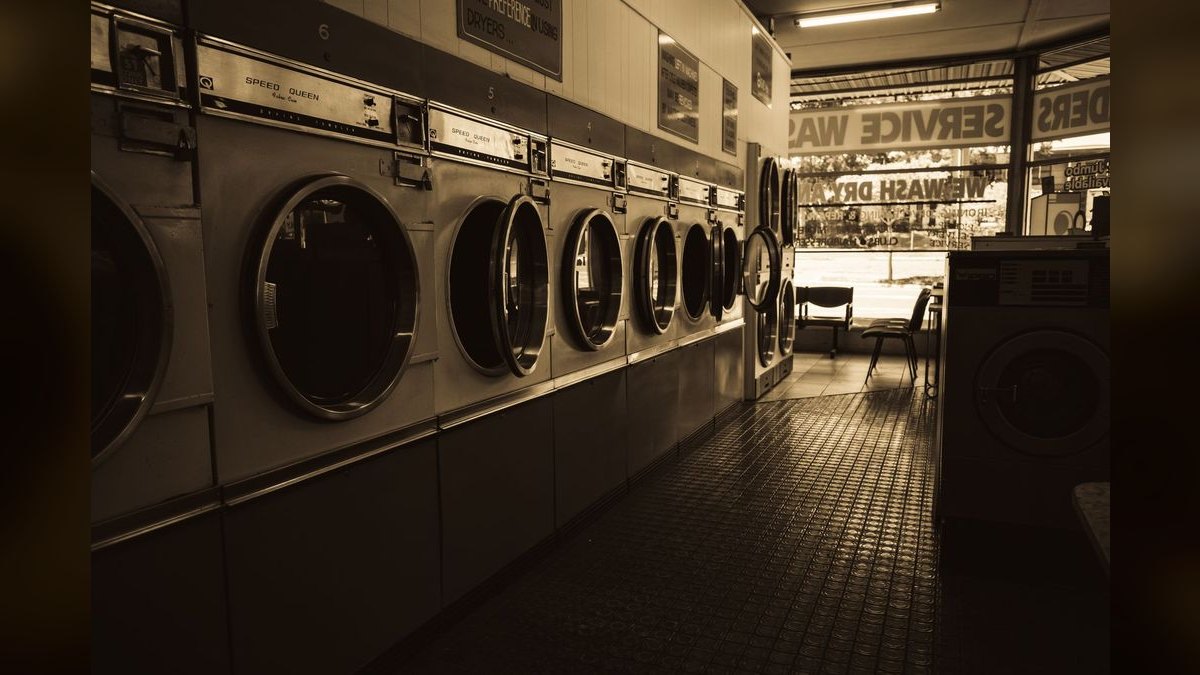
Washer/Dryer Turn Rate ranks second because it converts fixed equipment capital into a daily throughput number. A washer running 6 cycles per day at $4.00 per cycle produces $24/day; the same machine at 3 cycles produces $12/day. Industry average runs 4–8 cycles per machine per day for washers and 6–10 for dryers. Anything under 3 cycles means real underutilization or downtime.
This is for operators with capital already sunk into machines who need yield, not more equipment. It ignores revenue mix entirely — a store with high turn rate and no wash-dry-fold still trails on RevPSF above it. Improve it with shorter cycles for small loads and off-peak dynamic pricing through a POS like Cents, and confirm every machine is actually operational.
3. Operating Expense Ratio
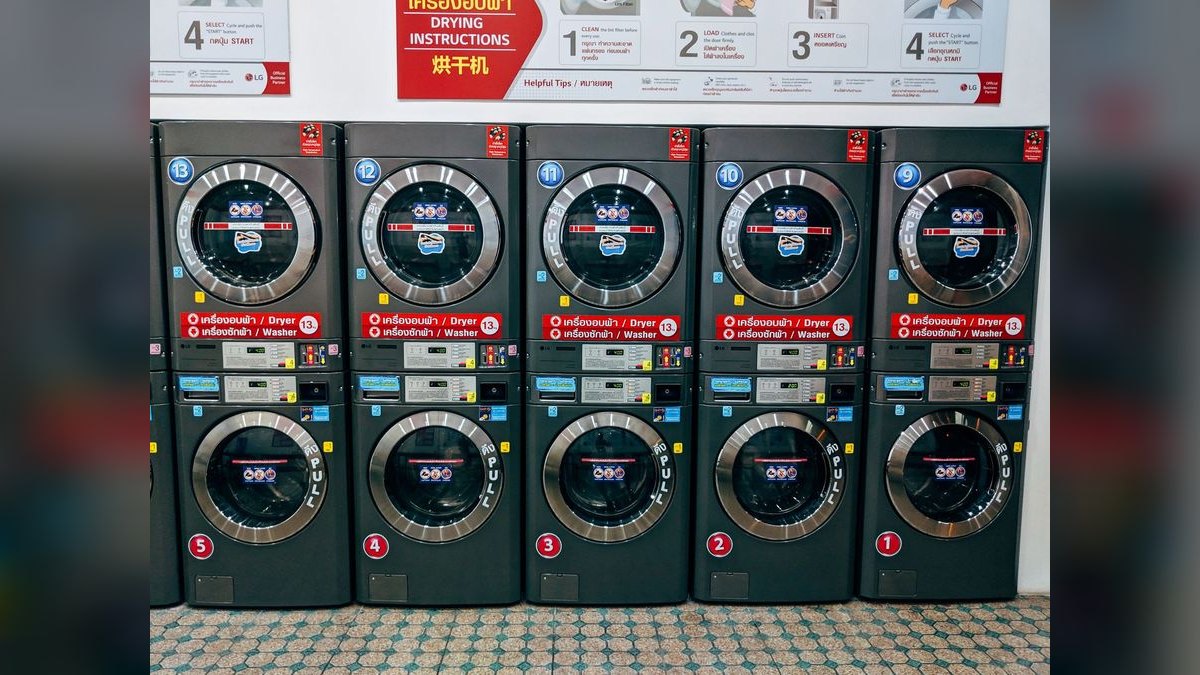
Operating Expense Ratio ranks third because it decides whether revenue gains survive to the bottom line. Healthy laundromats run 60–75%; above 80% the store bleeds cash. Utilities alone should land at 15–20% of revenue, labor at 20–30% when service is offered. A Los Angeles operator with $12,000/month rent hit 80% OER despite 3,000 sq ft of floor.
This KPI is for owners evaluating lease terms, utility contracts, and staffing levels rather than daily operations. It says nothing about growth — a store can cut OER by shrinking service revenue and still lose ground on the throughput metrics ranked above. Lower it by negotiating commercial time-of-use utility rates, installing high-efficiency Speed Queen washers, and cross-training staff to cut overtime.
4. Service Revenue Share
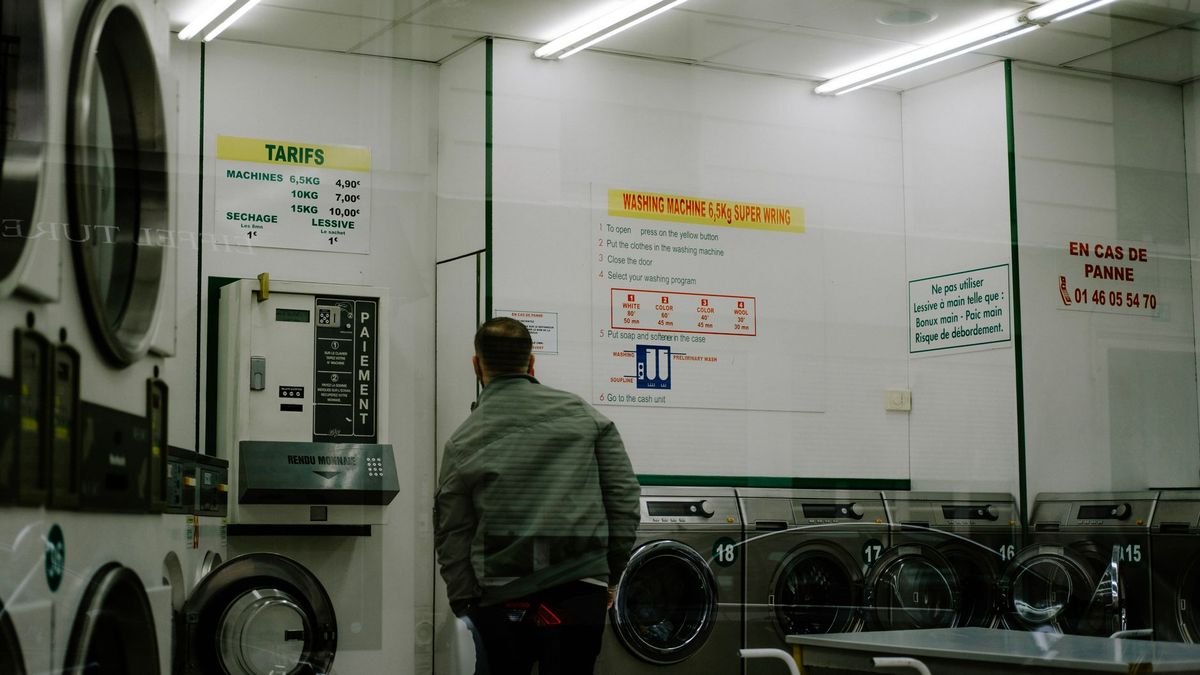
Service Revenue Share ranks fourth because wash-dry-fold carries the highest gross margin in the business at 50–70%. Operators below 20% of total revenue from drop-off are leaving money unclaimed; top performers run 30–40%. A 1,500 sq ft Phoenix store hit 35% service revenue with a $22 average ticket and 72% retention. Per-pound pricing typically runs $1.50–$2.50 depending on market.
This suits operators with floor space or off-peak capacity to spare and the willingness to hire an attendant. It trades capital efficiency for labor exposure — that Phoenix store carried a 72% OER because of staffing, worse than the self-service benchmark. Underpricing is the standard failure: at $1.50/lb against $15/hour labor you need 10 lbs/hour just to break even.
5. Vended Revenue Per Machine
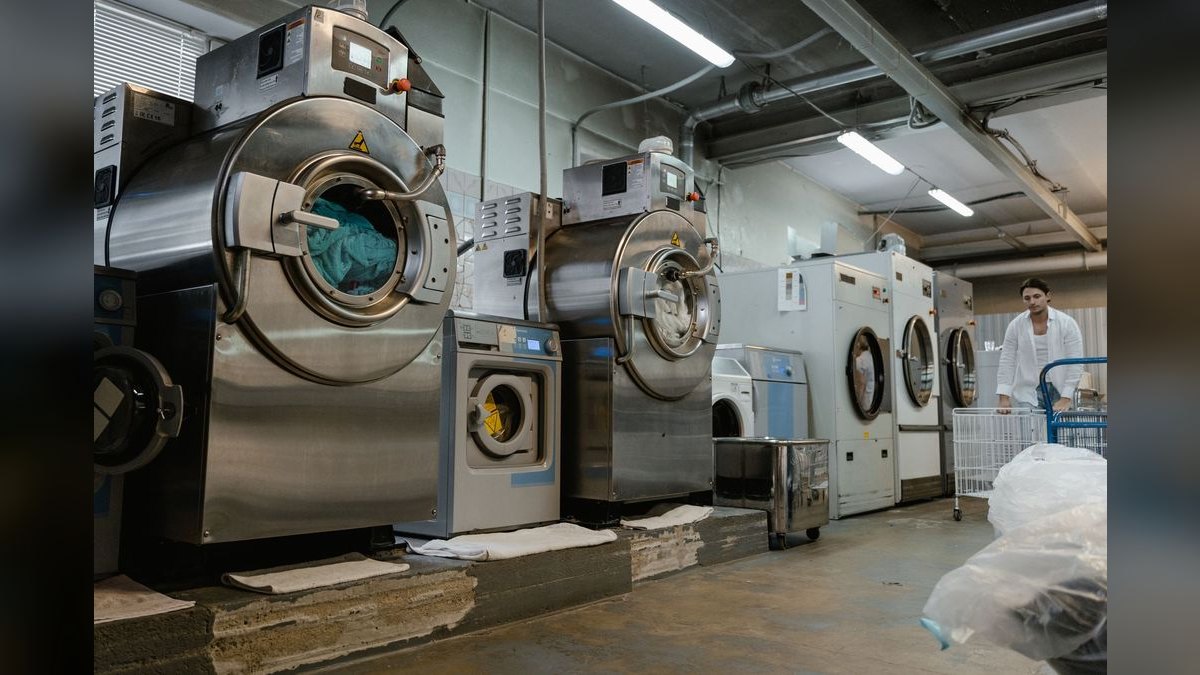
Vended Revenue Per Machine ranks fifth because it isolates the individual asset that Turn Rate averages away. Target $5–$10/day for washers and $3–$6/day for dryers. A washer pulling $3/day is broken, badly placed, or both. A Chicago operator running 30 washers and 20 dryers lifted VRPM 15% by replacing 10 underperformers with Speed Queen high-efficiency models.
This is the working metric for operators doing floor-plan or replacement decisions, checked daily via POS alerts for machines showing zero cycles. It is noisier than Turn Rate above it — single-machine numbers swing on placement and week-to-week traffic. One broken washer left unnoticed costs $100–$200 per month, which is why Cents or LaundryLux monitoring pays for itself.
6. Average Ticket Size
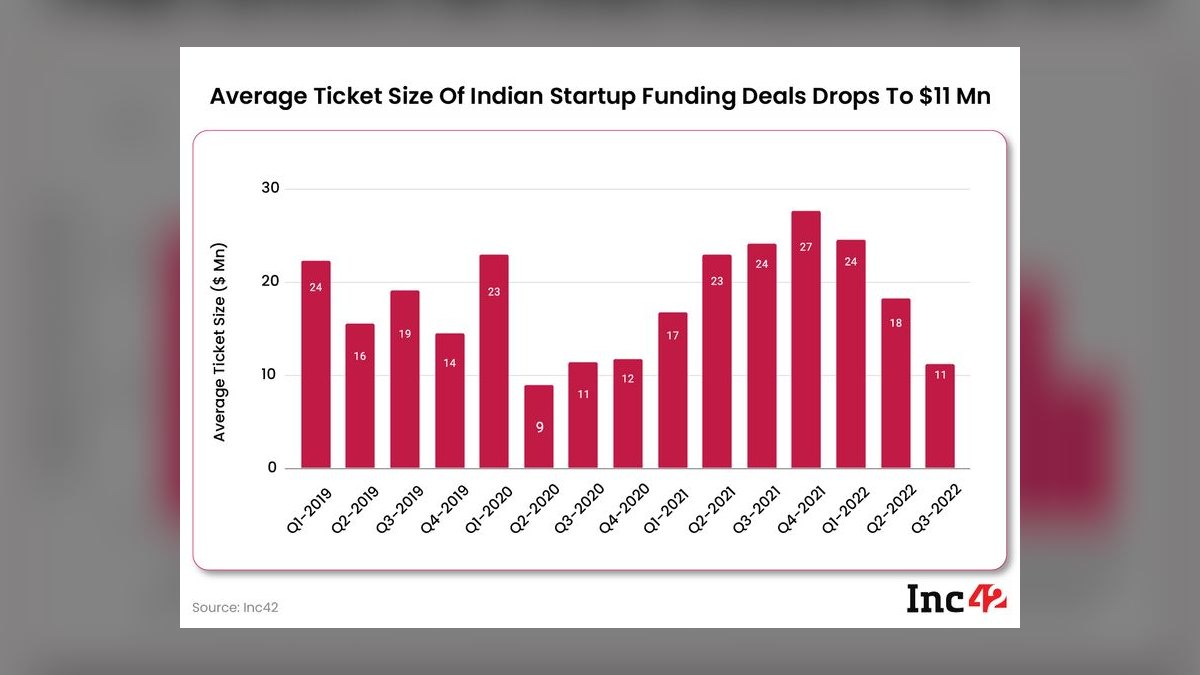
Average Ticket Size ranks sixth because it measures spend per visit, the lever that scales without new machines or new customers. Self-service ATS typically lands at $8–$15; wash-dry-fold runs $15–$30, with $18–$25 a healthy target per order. Below $15 on a drop-off order means underpricing or no upsell. The Phoenix service-heavy store posted $22 against Chicago's self-service $11.
This matters most to operators with steady traffic but flat revenue. It can mislead in isolation — a rising ATS with falling transaction count is a shrinking store, which the throughput KPIs above would catch first. Raise it with bundled pricing like 20 lbs wash-and-fold for $25, vending attachments, and loyalty programs through LaundryLux or the Speed Queen app.
7. Customer Retention Rate
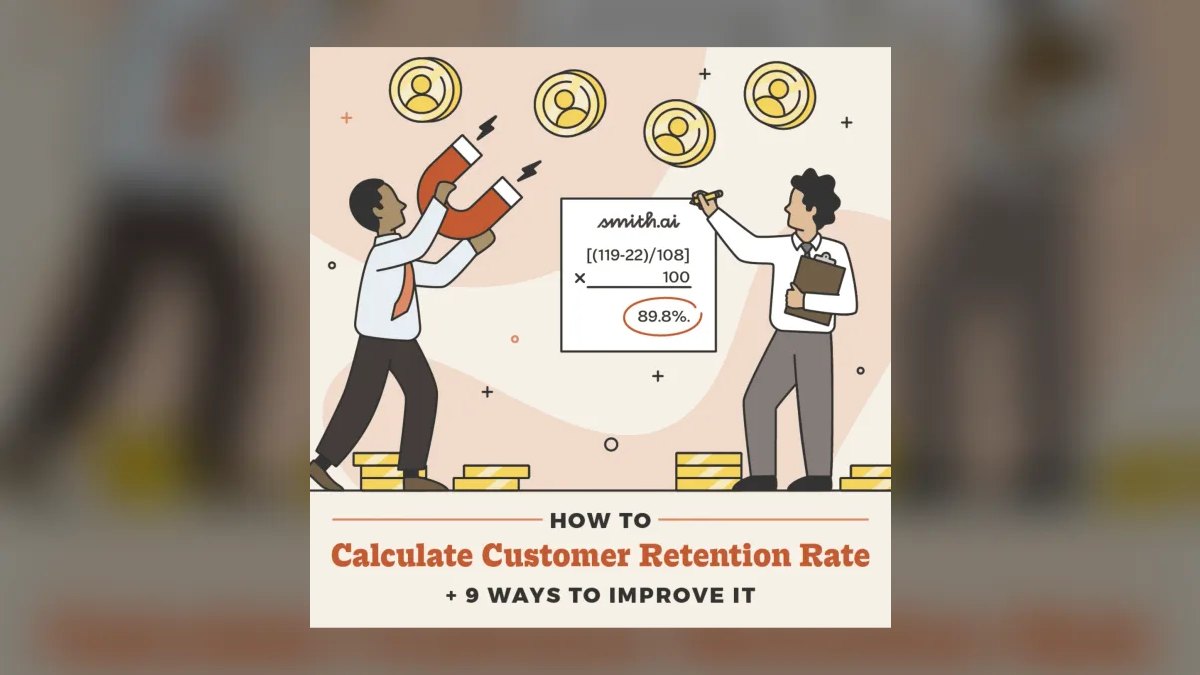
Customer Retention Rate ranks seventh because repeat traffic makes transactional revenue predictable in a business with no subscriptions. Self-service stores average 50–65%; wash-dry-fold stores run 60–75%. A store at 70% has a stable base; one at 40% is paying to reacquire the same volume every month. The Phoenix service operator held 72%, near the top of the range.
This is for operators in competitive local markets where a second laundromat sits within a few blocks. Measuring it honestly requires a loyalty app like PayRange to identify repeat visits — coin-only stores simply cannot compute it, which is one reason Card Load Rate follows. Facility condition drives it more than promotions: dirty floors and broken machines cause churn directly.
8. Card Load Rate
Card Load Rate ranks eighth because payment method changes spend behavior measurably: card users spend 20–30% more per visit than coin users and reload more often. Below 50% card penetration leaves revenue uncollected. Moving a store from 80% coin to 60% card can lift revenue 10–15% while cutting cash-handling cost. USA Technologies ePort readers and PayRange are the standard retrofits.
This is for operators facing a capital decision rather than an operational one — readers cost money per machine and pay back through higher tickets. It is a one-time fix, not an ongoing dial, which is why it ranks below the metrics you watch continuously. Phase out coin-only machines over roughly six months and seed adoption with a load-$20-get-$2 promotion.
9. Peak vs Off-Peak Split

Peak vs Off-Peak Split ranks ninth because it exposes capacity waste that total revenue hides. If 80% of weekly revenue lands during Saturday–Sunday 9am–5pm, the store is turning customers away at peak while machines idle midweek. A 60% peak / 40% off-peak split is the working target — it shortens wait times and raises effective capacity without buying equipment.
This is for operators who are already near machine capacity on weekends and considering an expensive equipment purchase. It requires hourly revenue tracking through a POS like Clover or Square, which many coin-heavy stores lack. Fix it with off-peak discounts such as 50% off dryers Tuesday mornings rather than adding machines that stay idle five days a week.
10. Revenue Per Employee

Revenue Per Employee ranks tenth because it only becomes decisive once labor is a meaningful cost line. Self-service stores with no attendant should hit $80,000–$120,000 per full-time equivalent, owner included. Stores with wash-dry-fold run $50,000–$80,000 because service work is labor-intensive by design. Low RPE against those ranges means overstaffing relative to actual demand.
This is for service-heavy operators, not unattended self-service stores where the number is near-meaningless. It also punishes stores that staff up correctly for growing drop-off volume, so read it alongside Service Revenue Share. Scheduling software like 7shifts matched to peak hours cut one Phoenix operator's labor 10%; batching drop-off orders and automating coin counting handle the rest.
How we ranked these
Ranking weighted four inputs: revenue density per square foot, machine-level throughput (cycles per machine per day), margin quality of the revenue stream behind each metric, and how quickly an operator can act on a bad reading. KPIs that a single store owner can pull weekly from POS data — Cents, LaundryLux, Clover, Square — scored higher than metrics requiring accountant reconciliation. Benchmarks come from operator-reported ranges, not vendor marketing claims.
Deliberately ignored: total customer count, foot traffic, and social followers — vanity numbers that move without revenue following. Also skipped national averages presented as targets, because laundromats are hyper-local; a Los Angeles store at $180 RevPSF with $12,000 rent and a Chicago store at $220 face different math. Machine brand comparisons were excluded too — equipment choice affects utilities and uptime, not which KPI deserves your attention first.
What to look for
What matters is which revenue stream you are actually running. A self-service-only store lives or dies on Washer/Dryer Turn Rate and Vended Revenue Per Machine, because capacity is the ceiling. Add wash-dry-fold and the center of gravity shifts to Average Ticket Size, service revenue share, and Revenue Per Employee, since labor now sits between you and margin. Pick the four KPIs that match your mix.
The common mistake is tracking store-level revenue and calling it measurement. Total revenue hides a broken washer costing $100–$200 monthly, and it hides an 80% peak concentration that means you turn customers away Saturday and sit empty Tuesday. Per-machine and per-hour granularity is where the money is. The second mistake: setting wash-dry-fold at $1.50 per pound without recomputing labor cost quarterly.
Related questions
What is a healthy Revenue Per Square Foot for a laundromat?
Self-service-only stores typically land between $150 and $300 annually per square foot. Add wash-dry-fold and the range moves to $250–$500. Below $150 signals underutilized floor space or a poor machine mix — too many small-capacity washers, too much aisle. Include back-of-house square footage in the denominator, or the number flatters you.
How many cycles per day should each washer run?
Industry range is 4 to 8 cycles per washer per day and 6 to 10 for dryers. At $4.00 per cycle, six turns produce $24 daily versus $12 at three turns — the same machine, the same rent. Anything under 3 cycles means the machine is broken, badly placed, or priced wrong for its slot in the day.
What percentage of revenue should come from wash-dry-fold?
Top operators run 30–40% of total revenue through drop-off service. Below 20% you are leaving margin on the floor, since service carries 50–70% gross margin against labor. The Phoenix operator in this data hits 35% service revenue with a $22 average ticket and 72% retention — but pays for it with a 72% operating expense ratio.
Why does card versus coin load rate affect revenue?
Card and app users spend 20–30% more per visit than coin users and reload more often. A store stuck at 80% coin usage carries lower average tickets plus cash-handling cost. Moving to roughly 60% card can lift revenue 10–15%. Install readers across all machines and run a load-$20-get-$2 promotion to convert holdouts.
What operating expense ratio should a laundromat target?
A healthy OER sits between 60% and 75% of revenue. Above 80% you are bleeding cash — usually rent, as with the Los Angeles store paying $12,000 monthly against $180 RevPSF. Utilities should hold at 15–20% of revenue; labor at 20–30% if you offer service. Ask your utility for commercial time-of-use pricing.
How do I spot an underperforming machine?
Track Vended Revenue Per Machine daily: total revenue from that unit divided by days in the period. Washers should clear $5–$10 daily, dryers $3–$6. A washer at $3 per day is broken, hidden in a dead corner, or both. Machine monitoring through Cents or LaundryLux sends downtime alerts before the month closes.
What is a realistic customer retention rate?
Self-service stores average 50–65% repeat customers; wash-dry-fold pushes that to 60–75%. Retention is cheaper than acquisition, and the levers are unglamorous — clean floors, working machines, no waiting. A loyalty app like PayRange gives you the visit data to measure it instead of guessing from how busy Saturday felt.
Should peak hours carry most of my weekly revenue?
No. If 80% of revenue lands in weekend peak windows, you are turning people away Saturday and paying rent on an empty room Tuesday. Aim closer to 60% peak, 40% off-peak. Off-peak discounts — half-price dryers Tuesday mornings — spread demand, cut wait times, and raise turn rate without buying a single machine.
FAQ
What is the single most important laundromat KPI?
Revenue Per Square Foot. It folds space utilization and revenue mix into one number, which makes it the fastest read on whether the store is working. Below $150 per square foot annually you are underperforming regardless of how busy the floor looks. Diagnose from there using turn rate and per-machine revenue.
How do I track machine utilization without expensive software?
Log it by hand for one week: count cycles per machine per day, then extrapolate to a monthly figure. That is enough to find the dead units. When you want it automated, basic machine monitoring through Cents runs under $50 monthly and sends daily alerts on zero-cycle machines.
What is a good average ticket size?
Self-service tickets typically run $8–$15. Wash-dry-fold orders should land at $18–$25; below $15 you are either underpricing per pound or failing to upsell. Bundled pricing — twenty pounds washed and folded for $25 — and vending detergent at the counter both move the number without new equipment.
How often should I adjust pricing?
Base prices quarterly, promotions weekly. Quarterly gives you enough data to see elasticity without whiplashing regulars; weekly promotions let you test off-peak discounts cheaply. Clover and Square both track hourly revenue, so you can see whether a Tuesday-morning dryer discount actually pulled volume or just discounted people who were coming anyway.
Should I eliminate coin-only machines?
Yes, if your card load rate sits below 40%. Card users spend 20–30% more, and coin handling costs you time and shrink risk. Phase the conversion over roughly six months rather than all at once — some regulars need the runway, and staged replacement spreads the capital hit across two or three quarters.
What is the biggest mistake new operators make?
Underpricing wash-dry-fold. They set $1.50 per pound while labor and utilities cost around $1.20, leaving a margin too thin to survive a slow month. At $15 hourly labor you need ten pounds processed per hour just to break even. Price at $2.00 per pound minimum and recheck the math quarterly.
What reporting cadence should I run?
Daily: revenue per machine, flagging any unit at zero cycles. Weekly: turn rate, average ticket, peak split, per-machine revenue. Monthly: RevPSF, retention, operating expense ratio, service revenue share, reconciled against QuickBooks. Quarterly: revenue per employee and card load rate, with pricing and labor adjustments to follow.
What should Revenue Per Employee look like?
A self-service store with no attended service should clear $80,000–$120,000 per full-time equivalent, owner included. Add wash-dry-fold and $50,000–$80,000 is normal, since service is labor-intensive by design. Numbers below those ranges mean overstaffing — usually schedules built around store hours instead of actual demand curves.
How much can adding wash-dry-fold actually move revenue?
The Los Angeles operator in this dataset, running 3,000 square feet at $180 RevPSF with no service, projects roughly $50,000 in added annual service revenue. That works because unattended floor space and idle machine hours already exist. The cost is a dedicated attendant and the discipline to price labor honestly at $2.00 per pound.
What is the first thing to fix in the first 30 days?
Machine utilization. Run a per-machine revenue report, then repair or replace anything below $3 per day — that is dead capital sitting on leased floor. Install card readers if your card rate is under 40%, and turn on daily downtime alerts. Pricing and labor optimization come in days 31–90, after capacity is real.
Sources
- https://www.coinlaundry.org
- https://www.trycents.com
- https://www.laundrylux.com
- https://www.speedqueencommercial.com
- https://www.payrange.com
- https://quickbooks.intuit.com
- https://www.7shifts.com
- https://www.clover.com
- https://squareup.com
Related on PULSE
This page will be disappearing soon. Save it to your device for $1 — or read it free while it is here.
@Kory-White- · if Venmo asks, the last 4 of my number are 2012
This page is gone.
This one is off the shelf now. $1 keeps it on your phone for good — the whole page, pictures and diagrams included.
 ikWhat should you know before investing in Industry KPIs in 2027?
 pulse-industry-kpisBilling Multiplier Realization: A Consulting Firm’s True Revenue Efficiency KPI in 2027
 pulse-industry-kpisTop 10 Ski Resort Revenue KPIs in 2027
 pulse-industry-kpisMerchant Discount Rate Optimization for Payment Processor Platforms in 2027
 pulse-industry-kpisGross Merchandise Volume (GMV) as a Health Metric for E-Commerce Platforms in 2027
 pulse-industry-kpisTop 10 Streaming Video (SVOD) Churn and ARPU Retention Metrics in 2027
 pulse-industry-kpisTop 10 Logistics Cost per Mile and Revenue per Load Metrics in 2027
 pulse-industry-kpisTop 10 Cruise Line Revenue KPIs in 2027
 pulse-industry-kpisTop 10 Convenience Store Revenue KPIs in 2027
 pulse-industry-kpisTop 10 Med Spa Revenue KPIs in 2027