
Top 10 KPIs for Senior Care & Home Health in 2027
 Curated byKory White · Fractional CRO · Maryland
 PULSEKNOWLEDGE LIBRARY
The 10 best kpis for senior care & home health are ranked below on measured performance, build quality, price, and how each one actually holds up in daily use rather than how it reads on a spec sheet. Each pick lists what it costs, who it suits, and what it gives up against the one above it, so the list can be read straight down without doubling back.
1. Average Daily Census
Average daily census ranks first because it is the single metric that tells an operator whether demand is being captured at all, and every other KPI downstream depends on it. A mid-sized home health agency commonly runs ADC between 250 and 600 patients, and the trend matters more than the absolute value.
This metric is for executive and intake leaders who need one weekly number that reflects pipeline health. It trades away clinical nuance: ADC says nothing about whether those patients are improving, only that they exist and are being billed. Compared with visit completion rate directly below it, census is the demand-side signal while completion is the delivery-side signal, and watching only one of them hides half the problem.
2. Visit Completion Rate

Visit completion rate ranks second because a census number without delivered visits behind it is a promise an agency cannot keep. Healthy operations hold completion above 95% of scheduled visits; anything below 90% is simultaneously a revenue problem and a compliance problem, since patterned missed visits invite audit scrutiny. It converts booked demand into billable reality.
This KPI is for scheduling and field operations managers who control day-to-day capacity. It trades away the bigger picture: completion can look strong while census erodes, which is why it sits below average daily census rather than above it. Compared with visit utilization directly below, completion measures whether scheduled visits happened, while utilization measures whether clinician hours were filled with billable work at all.
3. Visit Utilization Rate

Visit utilization rate ranks third because it is the capacity math that determines how much revenue each clinician can generate without new hiring. A field clinician working 40 hours with 25 billable visit hours sits near 62% utilization; high performers typically operate in the 70% to 80% band after documentation, travel, and coordination time are counted. Pushing past that band reliably increases turnover and documentation errors.
This metric is for staffing and productivity leaders deciding whether to hire. It trades away quality context entirely, since a clinician can hit utilization targets while delivering poorly targeted visits. Compared with visit completion rate directly above, utilization is the ceiling question while completion is the floor question, and the two together define usable capacity.
4. Caregiver Turnover Rate
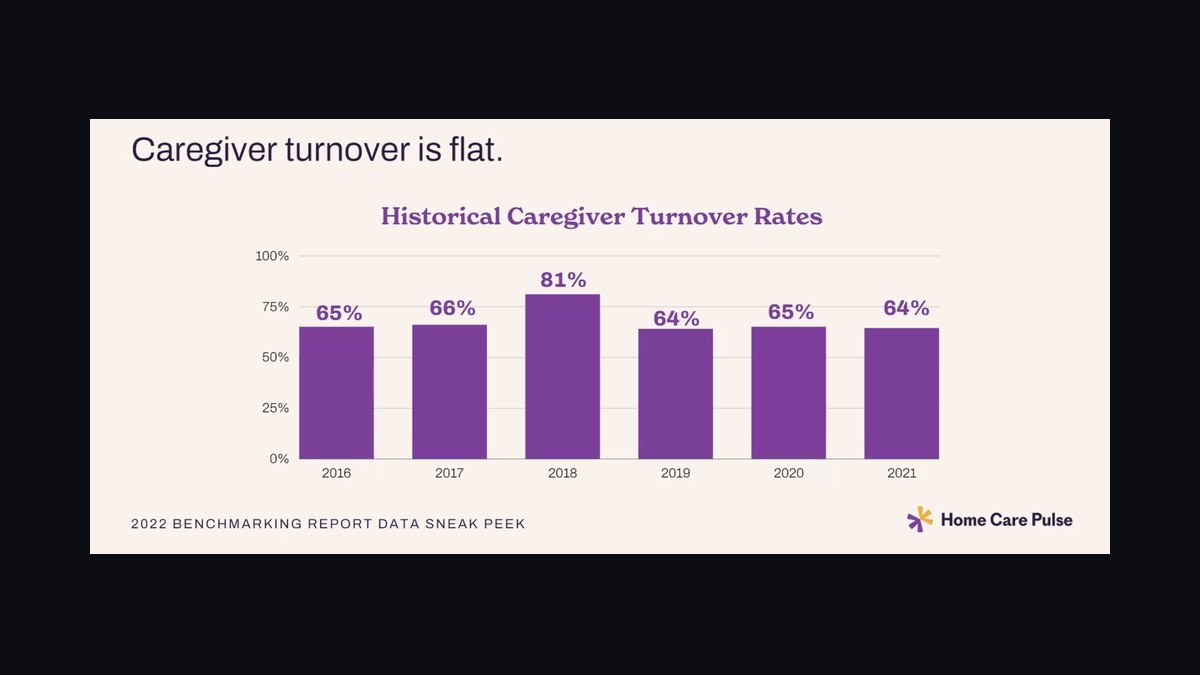
Caregiver turnover rate ranks fourth because in a market where direct care shortages remain the binding constraint, retention produces more usable capacity than any scheduling optimization. Annualized direct care turnover has frequently been reported in the 60% to 80% range industry-wide. Replacing one caregiver commonly costs $2,000 to $4,000 once recruiting, onboarding, training, and lost productivity are counted.
This KPI is for HR and operations leaders who own workforce sustainability. It trades away immediacy: turnover moves slowly and responds to compensation and scheduling changes over quarters, not weeks. Compared with visit utilization directly above, turnover is upstream, because high churn degrades fill rate, completion, timeliness, and continuity before any of those metrics show it.
5. 90-Day Retention Rate

90-Day retention rate ranks fifth because annualized turnover hides whether attrition is early or late, and those two problems require completely different fixes. An agency with 400 caregivers turning over at 70% replaces roughly 280 people a year; improving retention by 10 points avoids about 40 replacements, worth roughly $80,000 to $160,000 in avoided cost before counting protected revenue. Early attrition points to onboarding and scheduling.
This KPI is for recruiting and onboarding managers who can act within a quarter. It trades away the long-tenure picture: a strong 90-day number can mask burnout among experienced staff. Compared with caregiver turnover rate directly above, 90-day retention is the diagnostic cut while turnover is the headline, and reviewing them together separates onboarding failures from workload failures.
6. Acute Care Hospitalization Rate
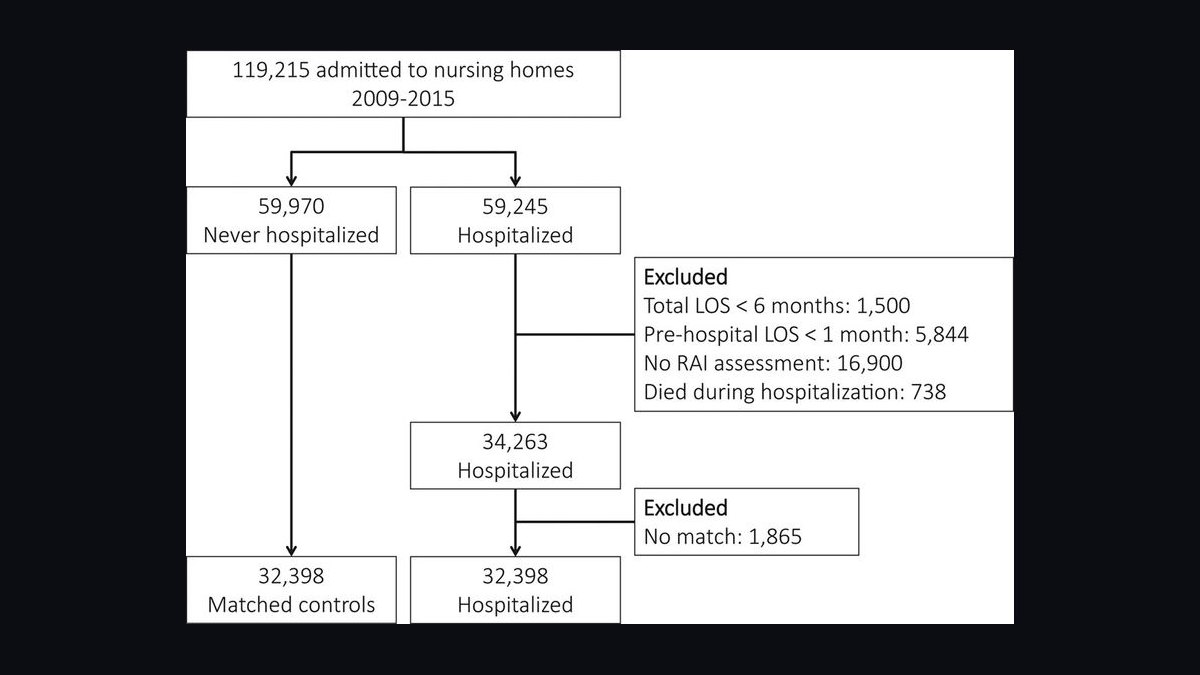
Acute care hospitalization rate ranks sixth because it is the core outcome measure that value-based and Medicare Advantage contracts increasingly pay against. Agencies commonly report 60-day rates in the 12% to 20% range depending on case mix, with lower being better and risk adjustment essential for fair comparison. A single avoided $14,000 readmission can outweigh the visit revenue of an entire short episode.
This KPI is for clinical directors and contract negotiators managing risk-based arrangements. It trades away speed: hospitalization rates move over quarters and require reliable OASIS review and clinician training to be trustworthy. Compared with 90-day retention directly above, hospitalization is a downstream outcome, because unstable staffing shows up as missed visits and deteriorating patients before it shows up in this number.
7. Recertification Rate

Recertification rate ranks seventh because it reveals whether an agency is retaining patients appropriately or retaining ones it cannot stabilize. A rate in the 40% to 55% range is typical for agencies with a strong chronic care population. Rates above 60% warrant clinical review to confirm patients still meet homebound and skilled-need criteria, especially when paired with a high hospitalization rate.
This KPI is for clinical leadership and utilization review teams. It trades away simplicity: a high recert rate is not automatically bad, since chronic patients legitimately need extended care, and a low rate can signal premature discharge. Compared with acute care hospitalization rate directly above, recertification measures retention while hospitalization measures whether that retention is clinically working.
8. Margin Per Visit

Margin per visit ranks eighth because it normalizes profitability for volume, catching the trap where an agency grows visits while shrinking margin as payer mix drifts toward lower-reimbursing contracts. Cost per visit in home health commonly lands between $110 and $170 depending on discipline mix and geography, with skilled nursing at the lower end and therapy at the higher end. Tracking margin by payer and discipline matters more than a single blended target.
This KPI is for finance leaders and contract strategists evaluating payer agreements. It trades away clinical meaning entirely, since a profitable visit can still be an unnecessary one. Compared with recertification rate directly above, margin per visit is the financial durability check while recertification is the clinical appropriateness check, and both are needed before signing new contracts.
9. Days Sales Outstanding
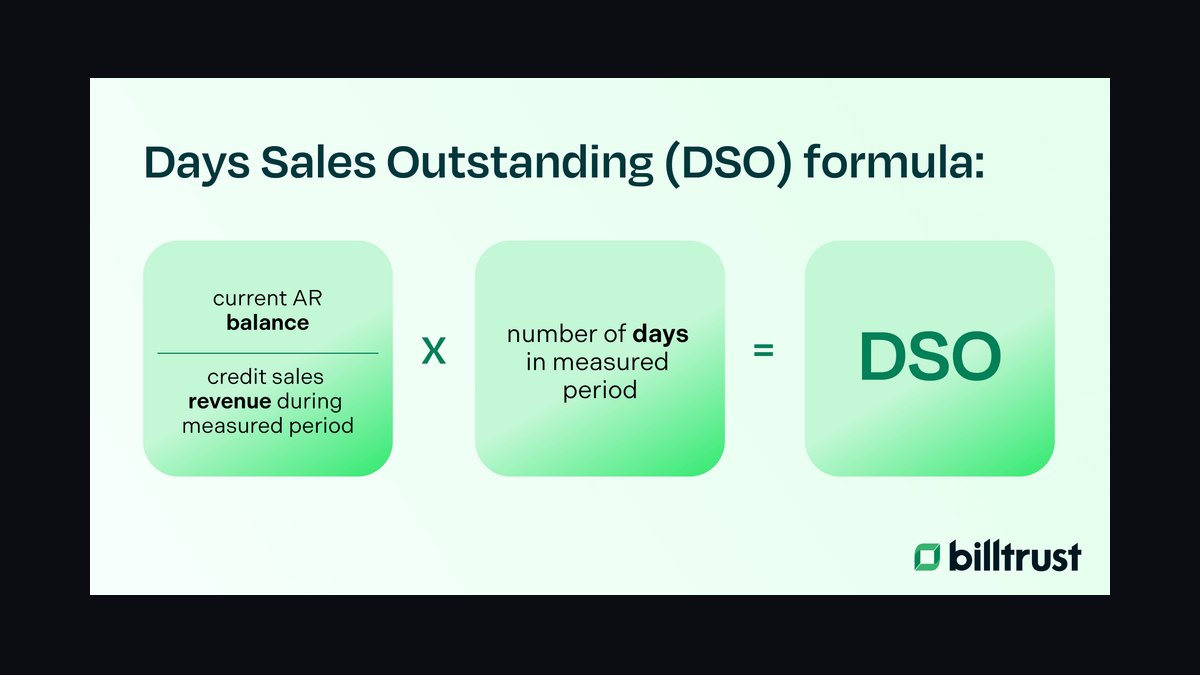
Days sales outstanding ranks ninth because it determines whether an agency can fund operations while waiting for payment, particularly under episodic and value-based arrangements with reconciliation delays. DSO above 60 days strains working capital; best-in-class billing operations often run 35 to 45 days for clean claims. It is the clearest single measure of revenue cycle health.
This KPI is for revenue cycle and finance managers who own cash conversion. It trades away operational insight: DSO can improve while underlying visit volume falls, because fewer claims can mean faster processing on a smaller base. Compared with margin per visit directly above, DSO is the timing question while margin is the amount question, and an agency can be profitable on paper and still run out of cash.
10. Start-of-Care Timeliness

Start-of-care timeliness ranks tenth because referral sources increasingly ask for it directly, making it a commercial metric rather than purely an operational one. Most hospital discharge planners expect a skilled visit within 24 hours of referral for post-acute patients, and agencies commonly target 90% or better within that window. Falling below that threshold reliably shows up in referral volume within one to two quarters.
This KPI is for intake and business development teams managing referral relationships. It trades away internal capacity context: timeliness can be excellent while utilization and margin quietly deteriorate underneath it. Compared with days sales outstanding directly above, timeliness protects future revenue while DSO protects cash already earned, and agencies that ignore the former eventually see the latter worsen.
How we ranked these
We ranked KPIs by weighting four factors: direct revenue linkage, sensitivity to staffing capacity, actionability within a weekly operating cadence, and relevance under 2027 payer mix shifts toward value-based and episodic payment. Census, visit completion, fill rate, turnover, hospitalization rate, margin per visit, and days sales outstanding scored highest because each maps to a distinct failure mode and can be moved by a named owner within one quarter.
We deliberately ignored metrics that are lagging, unauditable, or disconnected from decisions: employee engagement scores, generic patient satisfaction composites, brand awareness, total visits without payer segmentation, and any metric requiring data the agency cannot produce reliably today. We also excluded single-number rankings, because a dashboard missing an entire metric family is blind to a real risk regardless of how well it scores the rest.
What to look for
What actually matters when choosing between these KPI frameworks is whether your data can support them. A sophisticated outcome dashboard built on unreliable visit documentation produces noise, not insight. Confirm numerator, denominator, inclusion criteria, and refresh frequency for every metric before comparing vendors or frameworks, and verify the system can segment by payer, episode day, and discipline.
The mistake most buyers make is adopting a value-based KPI set while running a 70% turnover operation. Every metric downstream of staffing degrades when turnover is that high, so retention and time-to-fill belong in Tier 1 first. Build throughput discipline, stabilize visit completion above 95%, then layer outcome measurement. Skipping that sequence produces a dashboard that only ever shows red.
Related questions
Which single KPI should a home health agency watch weekly?
Average daily census paired with visit completion rate. Census shows whether demand is being captured; visit completion shows whether captured demand is actually delivered. Watching them together surfaces pipeline and capacity problems within a week rather than at month-end close, and both are actionable by scheduling and intake teams immediately.
Do outcome KPIs replace financial KPIs in value-based contracts?
No. They change the weight, not the set. Under value-based arrangements, hospitalization rate and functional improvement become leading indicators of revenue retention, while margin per visit and days sales outstanding still determine whether the agency can fund operations while waiting for reconciliation payments that may arrive months later.
How often should caregiver turnover be reviewed?
Monthly at minimum, with a 90-day retention cut reviewed alongside it. Annualized turnover hides whether the problem is early attrition or long-tenure burnout, and those require different fixes. Rising 90-day attrition points to onboarding and scheduling; rising long-tenure attrition points to compensation, workload, and supervision quality.
What is a realistic target for start-of-care timeliness?
Most referral sources expect a skilled visit within 24 hours of referral for post-acute patients, and within 48 hours at the outside. Agencies commonly target 90% or better within 24 hours. Falling below that threshold reliably shows up in referral volume within one to two quarters, often before it appears in census.
Should private-duty home care use the same KPI set?
The families overlap but specifics differ. Private-duty operators weight fill rate, caregiver turnover, client tenure, and hours billed per client more heavily, and weight recertification and OASIS-based outcomes not at all unless they also hold Medicare certification. Census becomes active clients, and length of stay becomes client tenure measured in months.
How do you set thresholds for each KPI?
Baseline 90 days of history first, because seasonality in admissions and visit volume will otherwise masquerade as trend. Then set thresholds relative to your own baseline, not industry averages, and pre-agree the response when a threshold breaks. A threshold without a pre-agreed action produces discussion rather than correction.
What is the most common KPI implementation failure?
Definitional drift. Fill rate, utilization, and census mean different things to scheduling, recruiting, and finance. Comparing two incompatible definitions across regions produces arguments instead of decisions. Write down numerator, denominator, inclusion criteria, and refresh frequency before anyone builds a report on top of the data.
When should a KPI be retired from the dashboard?
When it has not triggered an action in four consecutive quarters. Dashboards that grow monotonically become unreadable, and unreadable dashboards get ignored. Re-baseline quarterly and prune ruthlessly, keeping Tier 1 to four to six metrics reviewed in a 30-minute weekly operations huddle.
FAQ
Which KPIs matter most in Senior Care and Home Health in 2027?
The core set is census and average daily census, occupancy or visit utilization, length of stay or client tenure, visit completion and fill rate, caregiver turnover and 90-day retention, recertification rate, acute care hospitalization rate, functional improvement, revenue per episode, margin per visit, and days sales outstanding. Which sits at the top depends on payer mix and referral concentration, but all should be measured.
Why does payer mix change which KPIs matter most?
Because payment structure determines which behaviors produce revenue. Fee-for-service rewards volume and visit delivery, so throughput metrics dominate. Value-based and episodic models reward avoided hospitalizations and functional gain, so outcome metrics become leading indicators of financial performance. Measuring the wrong family for your payer mix means optimizing in the wrong direction.
How does caregiver turnover connect to the other metrics?
Turnover is upstream of nearly every operational metric. High turnover degrades fill rate, visit completion, start-of-care timeliness, and continuity of care, which then depresses clinical outcomes and referral-source confidence. That is why retention and time-to-fill belong in Tier 1 even for agencies pursuing value-based contracts.
What is a good visit utilization rate in home health?
High-performing agencies often operate in the 70% to 80% band once documentation, travel, and coordination time are counted. Below roughly 62% suggests idle capacity; pushing beyond 80% reliably increases turnover and documentation errors. Utilization is a metric with a ceiling, not one to maximize indefinitely.
How much does replacing a caregiver actually cost?
Commonly $2,000 to $4,000 per replacement when recruiting, onboarding, training, and lost productivity are counted. An agency with 400 caregivers at 70% turnover replaces roughly 280 people annually. Improving retention by 10 points avoids about 40 replacements, or roughly $80,000 to $160,000 in avoided cost before counting protected revenue.
What hospitalization rate should a home health agency target?
Agencies commonly report 60-day acute care hospitalization rates in the 12% to 20% range depending on case mix, with lower being better. Risk adjustment is essential for fair comparison across populations. A rise of more than two points above the prior quarter's baseline should trigger a clinical case review of affected episodes.
What days sales outstanding is considered healthy?
Above 60 days strains working capital and often signals billing or authorization problems. Best-in-class billing operations frequently run 35 to 45 days for clean claims. DSO is a useful early warning because it deteriorates before margin does, giving finance time to intervene on payer-specific issues.
How should a KPI dashboard be tiered?
Tier 1 is weekly and small, four to six metrics maximum, reviewed in a 30-minute operations huddle. Tier 2 is monthly and covers clinical and financial performance. Tier 3 is quarterly and strategic, covering outcomes, contract performance, and referral-source health. Putting everything in Tier 1 destroys the tiering.
What is margin per visit and why does it matter?
Margin per visit is reimbursement per visit minus direct cost per visit, including labor, travel, and supplies. It matters because it normalizes for volume. An agency can grow total visits while shrinking margin if payer mix drifts toward lower-reimbursing contracts, and only per-visit margin reveals that drift early enough to act.
How long does a KPI framework rollout take?
Realistically one to two quarters for definitional discipline, baselining, ownership assignment, and tiering. Outcome metrics take longer because they require reliable OASIS review and clinician training. Sequencing matters more than tooling: stabilize visit completion and start-of-care timeliness before layering outcome measurement on top.
Sources
- https://www.cms.gov/medicare/quality/home-health
- https://www.medpac.gov/reports
- https://www.cdc.gov/nchs/fastats/home-health-care.htm
- https://www.bls.gov/ooh/healthcare/home-health-aides.htm
- https://www.ahrq.gov/patient-safety/settings/index.html
- https://www.kff.org/medicare/
- https://www.commonwealthfund.org/publications
- https://www.jointcommission.org/standards/
- https://www.leadingage.org/research-and-data
- https://www.nahc.org/resources/
Related on PULSE
- [More kpis for senior care & home health rankings and buying guides](/knowledge)
- [PULSE Tools and calculators](/tools)
- [Everything on PULSE RevOps](/)
This page will be disappearing soon. Save it to your device for $1 — or read it free while it is here.
@Kory-White- · if Venmo asks, the last 4 of my number are 2012
 pulse-industry-kpisTop 10 Sales KPIs for Mobile Equipment & OTR Tire Retreading in 2027
 pulse-industry-kpisTop 10 Logistics Cost per Mile and Revenue per Load Metrics in 2027
 pulse-industry-kpisTop 10 KPIs for Medical Devices & Supplies in 2027
 pulse-industry-kpisTop 10 Cost KPIs for airline revenue in 2027
 pulse-industry-kpisTop 10 Sales KPIs for Commercial UAV & Drone Manufacturing in 2027
 pulse-industry-kpisTop 10 Sales KPIs for Document Management and Capture in 2027
 pulse-industry-kpisBilling Multiplier Realization: A Consulting Firm’s True Revenue Efficiency KPI in 2027
 pulse-industry-kpisMerchant Discount Rate Optimization for Payment Processor Platforms in 2027
 pulse-industry-kpisTop 10 KPIs for Legal in 2027
 pulse-industry-kpisTuition Revenue per Enrolled Student: Private School Financial Health Metric in 2027