
What genre defined film noir in the 1940s and why did it fade out in 2027?
 Curated byKory White · Fractional CRO · Maryland
 PULSEKNOWLEDGE LIBRARY
Quality
Certified
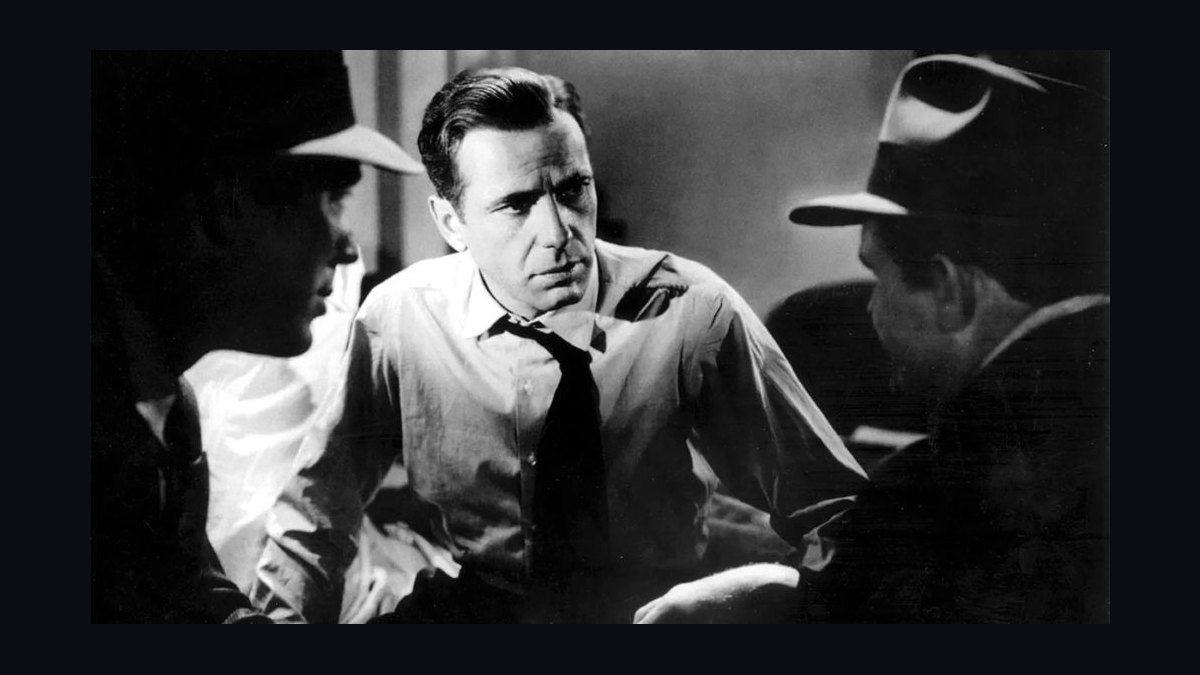
Film noir was defined not by a single genre but by a style and mood that fused hardboiled crime fiction with German Expressionist cinematography. In the 1940s, American studios produced roughly 300–400 noir films, mostly low-budget B pictures. The style faded in the late 1950s as television absorbed crime drama, censorship loosened, and color widescreen became the default format.
The two traditions that defined film noir
Film noir was never a genre in the studio-marketing sense. Nobody at Warner Bros. or RKO in 1946 labeled a picture "noir." The term came later, coined by French critics — most famously Nino Frank in 1946 and later Raymond Borde and Étienne Chaumeton in their 1955 book *Panorama du film noir américain*. What those critics noticed was a cluster of visual and narrative conventions that had coalesced during the 1940s and that felt distinctly darker than the Hollywood product around it.
The first tradition feeding noir was hardboiled American crime fiction. Writers like Dashiell Hammett, James M. Cain, Raymond Chandler, Cornell Woolrich, and Horace McCoy supplied the source material and the moral weather: cynical protagonists, femmes fatales, corrupt institutions, and dialogue that crackled with fatalism. Between roughly 1940 and 1958, studios adapted dozens of these novels and short stories. *The Maltese Falcon* (1941) came from Hammett; *Double Indemnity* (1944) from Cain; *The Big Sleep* (1946) from Chandler; *The Postman Always Rings Twice* (1946), again Cain. The literary DNA gave noir its themes — betrayal, obsession, the sense that the system is rigged and the individual is doomed.
The second tradition was visual and technical, and it arrived largely through European émigrés fleeing the Nazi regime. Directors such as Fritz Lang, Otto Preminger, Billy Wilder, Robert Siodmak, and cinematographers like John Alton brought German Expressionist habits with them: extreme chiaroscuro lighting, canted camera angles, deep shadows, wet streets, and compositions that trap characters in doorframes, stairwells, and window blinds. German Expressionism had already produced *M* (1931) and *The Cabinet of Dr. Caligari* (1920); the émigrés translated that vocabulary into the American crime film. French Poetic Realism — Jean Renoir, Marcel Carné — contributed a second European layer of doomed romance and working-class fatalism.
What made the fusion work was economics. Noir was cheap. Low-key lighting hid modest sets. Location shooting in real Los Angeles streets was faster than building backdrops. B-picture budgets meant directors had unusual freedom because executives paid less attention. That combination — literary source material, imported visual grammar, and low-budget production conditions — is what actually defined the cycle. It was a style, a mood, and a production niche, not a genre with a studio label.
The stylistic markers were consistent enough to be recognizable. Roughly 90% of noir scenes take place at night or in shadowed interiors. Voiceover narration, often first-person and retrospective, appears in a large share of the cycle — *Double Indemnity*, *Sunset Boulevard* (1950), *Out of the Past* (1947), *D.O.A.* (1949). The femme fatale — Barbara Stanwyck in *Double Indemnity*, Jane Greer in *Out of the Past*, Rita Hayworth in *Gilda* (1946) — became the cycle's signature figure, a woman whose sexuality is both the protagonist's temptation and his destruction. The protagonist is usually a flawed man: a private eye, an insurance salesman, a boxer, a drifter, a cop who crosses a line.
The cycle peaked between 1945 and 1950, when postwar disillusionment, returning veterans, and urban anxiety gave the material extra resonance. Somewhere between 300 and 400 American films released between 1940 and 1960 are now classified as noir by historians, with the densest concentration in 1947–1948. The label has since been stretched backward to *Stranger on the Third Floor* (1940) and forward to *Touch of Evil* (1958), Orson Welles's border-town noir that many critics treat as the cycle's closing statement.
How to decide which noir tradition a film belongs to
For anyone cataloguing, teaching, or programming noir, the practical question is how to classify a given title. The decision usually comes down to which tradition dominates — the literary-thematic or the visual-technical — and whether the film sits inside the classic 1940s–1950s window or in a later revival.

The first filter is period. Classic noir runs roughly 1940 to 1958. Anything after that is usually called neo-noir: *Chinatown* (1974), *Body Heat* (1981), *Blade Runner* (1982), *Blood Simple* (1984), *Se7en* (1995). Neo-noir keeps the mood but often adds color, explicit violence, and postmodern self-awareness. The second filter is visual grammar: does the film rely on chiaroscuro, night exteriors, canted angles, and shadow as a narrative device? If yes, it leans toward the Expressionist lineage. The third filter is narrative stance: is there a flawed protagonist, a femme fatale or equivalent, a corrupt world, and a fatalistic ending? If yes, it leans toward the hardboiled lineage.
A workable decision tree looks like this. If the film is pre-1958, in black and white, and built on crime or psychological suspense, it is a classic noir candidate. If it is post-1958 and uses noir visual codes knowingly, it is neo-noir. If it is pre-1940 but shows the same visual grammar — *M*, *Fury* (1936), *You Only Live Once* (1937) — historians often call it a "proto-noir" or "precursor." If it is a comedy or a Western using noir lighting and voiceover, it is a noir-inflected hybrid: *The Big Lebowski* (1998) is a comic neo-noir; *Pursued* (1947) is a Western noir.

The trade-off in classification is between strictness and usefulness. A strict definition — black and white, 1940s, American, crime — excludes *The Third Man* (1949, British), *Rififi* (1955, French), and *Sunset Boulevard* (which is a Hollywood drama about Hollywood, not a crime film). A loose definition includes so much that the term stops meaning anything. Most film scholars settle on a middle position: noir is a style or movement, not a genre, and the boundaries are deliberately porous. That is why the question "what genre defined film noir" is slightly misleading — noir was defined by a style that cut across genres, including crime, melodrama, Western, and even science fiction.
Concrete numbers behind the cycle
The scale of the noir cycle is measurable, and the numbers explain both its prominence and its eventual decline.
Volume. Historians generally count between 300 and 400 American films as noir across the classic period. The densest years are 1947 and 1948, each producing roughly 30–40 noir titles. By contrast, the entire 1940s saw about 5,000 American feature releases, so noir was a meaningful but minority slice — perhaps 6–8% of output in peak years.
Budget. Most noir was B-picture territory. A typical B noir in the mid-1940s cost between $100,000 and $400,000, against A-picture budgets of $1 million to $3 million. *Detour* (1945), directed by Edgar G. Ulmer, was shot in roughly six days for around $20,000–$30,000 — an extreme case, but it illustrates how cheaply the style could be produced. *Double Indemnity* was an A picture with a larger budget, but the cycle's center of gravity was the low end.

Runtime. Noir films were typically short: 65 to 95 minutes. B pictures were often under 75 minutes to fit double-feature programming. This compressed runtime is part of the style — plots move fast, dialogue is economical, and there is little room for subplot.
Box office and awards. Noir was not an awards category, so direct statistics are hard to cite. But several noir titles were major commercial and critical successes: *Double Indemnity* was nominated for seven Academy Awards; *Sunset Boulevard* was nominated for eleven and won three; *The Lost Weekend* (1945) won Best Picture, Best Director, Best Actor, and Best Screenplay. These were exceptions. Most noir titles were profitable B pictures that never entered the awards conversation.

Decline timeline. The classic cycle is usually dated as ending around 1958, with *Touch of Evil* as a common endpoint. The reasons are multiple and interlocking. Television ownership in the United States jumped from roughly 9% of households in 1950 to about 90% by 1960, and TV absorbed the crime-drama audience that had sustained B pictures. The Paramount Decree of 1948 forced studios to divest theaters, breaking the block-booking system that had guaranteed B pictures a screen. The Production Code, which had shaped what noir could show and imply, weakened through the 1950s and was replaced by the ratings system in 1968. Color and widescreen — CinemaScope arrived in 1953 — made black-and-white low-key photography look dated to exhibitors and audiences. And the cultural mood shifted: postwar anxiety gave way to 1950s affluence and then 1960s counterculture, and the fatalistic noir protagonist no longer fit the moment.
Revival numbers. Neo-noir has been a steady presence since the 1970s. *Chinatown* (1974) won an Oscar for Best Original Screenplay. *Body Heat* (1981) launched Kathleen Turner's career. *Blade Runner* (1982) flopped on release but became a landmark. *L.A. Confidential* (1997) won two Oscars from nine nominations. The style has proven durable precisely because it is a mood and a visual grammar, not a genre tied to a specific era.

Implementation details and sequencing for studying or programming noir
If you are building a noir syllabus, a film series, or a research dataset, the sequencing matters. The cycle did not appear fully formed in 1941; it evolved through phases, and understanding those phases helps you order titles meaningfully.
Phase 1 — Precursors and early noir (1940–1943). Start with *Stranger on the Third Floor* (1940), often cited as the first true noir, and *The Maltese Falcon* (1941), the template-setter. Add *This Gun for Hire* (1942) and *Shadow of a Doubt* (1943). This phase establishes the visual grammar and the hardboiled tone. Roughly 20–30 films belong here.
Phase 2 — Peak noir (1944–1950). The densest and most canonical stretch. *Double Indemnity* (1944), *Laura* (1944), *Murder, My Sweet* (1944), *The Lost Weekend* (1945), *Detour* (1945), *The Big Sleep* (1946), *The Postman Always Rings Twice* (1946), *Gilda* (1946), *Out of the Past* (1947), *The Lady from Shanghai* (1947), *Key Largo* (1948), *White Heat* (1949), *The Third Man* (1949), *Sunset Boulevard* (1950), *D.O.A.* (1949), *Gun Crazy* (1950). This is where the femme fatale, the voiceover, and the fatalistic ending are most concentrated.
Phase 3 — Late classic noir (1951–1958). The style begins to mutate. *Strangers on a Train* (1951), *The Big Heat* (1953), *Kiss Me Deadly* (1955), *The Killing* (1956), *Sweet Smell of Success* (1957), *Touch of Evil* (1958). Color starts appearing. Budgets tighten. Television competition bites. The mood becomes more paranoid and more violent.
Phase 4 — Neo-noir (1970s onward). *Chinatown* (1974), *Taxi Driver* (1976), *Body Heat* (1981), *Blade Runner* (1982), *Blood Simple* (1984), *Miller's Crossing* (1990), *Se7en* (1995), *L.A. Confidential* (1997), *Memento* (2000), *Drive* (2011). Neo-noir often comments on the original cycle rather than simply continuing it.
For a research dataset, the practical sequencing is: define inclusion criteria (period, visual grammar, narrative stance), pull a candidate list from standard references, then code each title on dimensions such as lighting style, voiceover presence, femme fatale presence, ending type (fatalistic vs. redemptive), and budget tier. The most common reference lists come from the American Film Institute, the Criterion Collection's noir releases, and academic filmographies such as those in *Film Noir: An Encyclopedic Reference to the American Style* (1979, edited by Alain Silver and Elizabeth Ward).
The trade-off in any sequencing is between completeness and coherence. A chronological list is easy to build but mixes A and B pictures, major and minor directors, and canonical and forgotten titles. A thematic list — say, "noir and the femme fatale" or "noir and the city" — is more coherent but harder to bound. Most programmers use a hybrid: a chronological spine with thematic clusters.
Related questions
Was film noir a genre or a style?
Film noir is best understood as a style or movement, not a genre. It cut across crime, melodrama, Western, and psychological drama. French critics coined the term to describe a mood and visual grammar they saw in American films of the 1940s, not a studio category.
What ended the classic noir cycle?
Multiple forces converged in the late 1950s: television absorbed the B-picture audience, the 1948 Paramount Decree broke block booking, the Production Code weakened, color widescreen became standard, and the postwar fatalistic mood gave way to 1950s affluence and later 1960s counterculture.
Which film is considered the first noir?
*Stranger on the Third Floor* (1940) is the most commonly cited first true noir, though *The Maltese Falcon* (1941) is often treated as the template-setter. Precursors like *M* (1931) and *Fury* (1936) are sometimes called proto-noir.
Why is the term "film noir" French?
French critics coined it. Nino Frank used the phrase in 1946, and Raymond Borde and Étienne Chaumeton published *Panorama du film noir américain* in 1955. The term entered English-language criticism later, in the 1960s and 1970s.
Did noir disappear completely after the 1950s?
No. The classic cycle ended around 1958, but the style survived as neo-noir from the 1970s onward. *Chinatown*, *Body Heat*, *Blade Runner*, and *L.A. Confidential* are all neo-noir, keeping the mood while updating the format.
FAQ
What genre defined film noir in the 1940s?
No single genre defined it. Film noir was a style and mood that drew on hardboiled crime fiction and German Expressionist cinematography. It appeared most often in crime films, but it also shaped melodramas, Westerns, and psychological dramas. The 1940s is when the cycle peaked, with the densest output between 1945 and 1950.
Why did film noir fade out in the late 1950s?
Television ownership in the US rose from roughly 9% of households in 1950 to about 90% by 1960, pulling the B-picture audience away. The 1948 Paramount Decree ended block booking. The Production Code weakened. Color widescreen became standard, making black-and-white low-key photography look dated. And the cultural mood shifted away from postwar fatalism.
Was film noir a genre or a movement?
Most film scholars treat it as a movement or style, not a genre. It has recognizable conventions — chiaroscuro lighting, voiceover, femme fatale, flawed protagonist, fatalistic ending — but those conventions appear across multiple genres. That is why the term is notoriously hard to define strictly.
How many classic noir films were made?
Historians generally count between 300 and 400 American films as noir across the classic period, roughly 1940 to 1958. The densest years are 1947 and 1948, each producing around 30–40 noir titles. Most were B pictures with budgets between $100,000 and $400,000.
What is the difference between film noir and neo-noir?
Classic noir runs roughly 1940 to 1958, mostly in black and white, often on B-picture budgets. Neo-noir begins in the 1970s and uses noir codes knowingly, usually in color, with more explicit violence and often a postmodern, self-aware relationship to the original cycle. *Chinatown* and *Body Heat* are standard examples.
Who coined the term "film noir"?
French critics coined it. Nino Frank used the phrase in 1946, and Raymond Borde and Étienne Chaumeton popularized it in their 1955 book *Panorama du film noir américain*. English-language critics adopted the term in the 1960s and 1970s.
Sources
- https://www.britannica.com/art/film-noir
- https://www.criterion.com/explore/10-film-noir
- https://www.afi.com/afis-10-top-10/
- https://www.loc.gov/programs/national-film-preservation-board/film-registry/
- https://www.bfi.org.uk/features/where-begin-film-noir
- https://www.moma.org/calendar/film/
- https://www.oscars.org/oscars/ceremonies
- https://www.imdb.com/search/title/?genres=film-noir
Related on PULSE
- How did German Expressionism shape Hollywood cinematography in the 1930s and 1940s?
- What is the difference between classic noir and neo-noir in film studies?
- How did the Paramount Decree of 1948 change Hollywood studio economics?
- Why did black-and-white cinematography decline in the 1950s and 1960s?
- How do film historians classify genres versus movements versus styles?
This page will be disappearing soon. Save it to your device for $1 — or read it free while it is here.
@Kory-White- · if Venmo asks, the last 4 of my number are 2012
This page is gone.
This one is off the shelf now. $1 keeps it on your phone for good — the whole page, pictures and diagrams included.
 revopsHow does a movie earn an NC-17 rating instead of an R in 2027?
 revopsHow much does it cost to restore and re-release a silent film with a live orchestral score in 2027?
 revopsHow much does it cost to restore and preserve an original 35mm film print in 2027?
 revopsHow does the industry decide which movies get preserved in the National Film Registry in 2027?
 revopsHow do movie studios decide which films to release during the summer blockbuster season versus other times of year in 2027?
 revopsHow does streaming a movie in 4K actually affect data usage compared to HD in 2027?
 revopsWhat makes a movie's sound design win an Oscar in 2027?
 revopsHow do child actors typically transition out of Hollywood after a franchise ends in 2027?
 revopsWhat made Casablanca a classic when it was considered a routine studio picture at the time in 2027?
 pulse-gtmWhat is the average cost per lead for paid search in B2B SaaS in 2027?